Plunging pound and crumbling confidence: How the new UK government stumbled into a political and financial crisis of its own making

By David McMillan, University of Stirling 

The new British government is off to a very rocky start – after stumbling through an economic and financial crisis of its own making.

Just a few weeks into its term on Sept. 23, 2022, Prime Minister Liz Truss’ government released a so-called mini-budget that proposed £161 billion – about US$184 billion at today’s rate – in new spending and the biggest tax cuts in half a century, with the benefits mainly going to Britain’s top earners. The aim was to jump-start growth in an economy on the verge of recession, but the government didn’t indicate how it would pay for it – or provide evidence that the spending and tax cuts would actually work.

Financial markets reacted badly, prompting interest rates to soar and the pound to plunge to the lowest level against the dollar since 1985. The Bank of England was forced to gobble up government bonds to avoid a financial crisis.

After days of defending the plan, the government did a U-turn of sorts on Oct. 3 by scrapping the most controversial component of the budget – elimination of its top 45% tax rate on high earners. This calmed markets, leading to a rally in the pound and government bonds.

As a finance professor who tracks markets closely, I believe at the heart of this mini-crisis over the mini-budget was a lack of confidence – and now a lack of credibility.

A looming recession

Truss’ government inherited a troubled economy.

Growth has been sluggish, with the latest quarterly figure at 0.2%. The Bank of England predicts the U.K. will soon enter a recession that could last until 2024. The latest data on U.K. manufacturing shows the sector is contracting.

Consumer confidence is at its lowest level ever as soaring inflation – currently at an annualized pace of 9.9% – drives up the cost of living, especially for food and fuel. At the same time, real, inflation-adjusted wages are falling by a record amount, or around 3%.

It’s important to note that many countries in the world, including the U.S. and in mainland Europe, are experiencing the same problems of low growth and high inflation. But rumblings in the background in the U.K. are also other weaknesses.
Since the financial crisis of 2008, the U.K. has suffered from lower productivity compared with other major economies. Business investment plateaued after Brexit in 2016 – when a slim majority of voters chose to leave the European Union – and remains significantly below pre-COVID-19 levels. And the U.K. also consistently runs a balance of payments deficit, which means the country imports a lot more goods and services than it exports, with a trade deficit of over 5% of gross domestic product.
In other words, investors were already predisposed to view the long-term trajectory of the U.K. economy and the British pound in a negative light.

An ambitious agenda

Truss, who became prime minister on Sept. 6, 2022, also didn’t have a strong start politically.

The government of Boris Johnson lost the confidence of his party and the electorate after a series of scandals, including accusations he mishandled sexual abuse allegations and revelations about parties being held in government offices while the country was in lockdown.

Truss was not the preferred candidate of lawmakers in her own Conservative Party, who had the task of submitting two choices for the wider party membership to vote on. The rest of the party – dues-paying members of the general public – chose Truss. The lack of support from Conservative members of Parliament meant she wasn’t in a position of strength coming into the job.

Nonetheless, the new cabinet had an ambitious agenda of cutting taxes and deregulating energy and business.

Some of the decisions, laid out in the mini-budget, were expected, such as subsidies limiting higher energy prices, reversing an increase in social security taxes and a planned increase in the corporate tax rate.

But others, notably a plan to abolish the 45% tax rate on incomes over £150,000, were not anticipated by markets. Since there were no explicit spending cuts cited, funding for the £161 billion package was expected to come from selling more debt. There was also the threat that this would be paid for, in part, by lower welfare payments at a time when poorer Britons are suffering from the soaring cost of living. The fear of welfare cuts is putting more pressure on the Truss government.

A collapse in confidence

Even as the new U.K. Chancellor of the Exchequer Kwasi Kwarteng was presenting the mini-budget on Sept. 23, the British pound was already getting hammered. It sank from $1.13 the day before the proposal to as low as $1.03 in intraday trading on Sept. 26. Yields on 10-year government bonds, known as gilts, jumped from about 3.5% to 4.5% – the highest level since 2008 – in the same period.

The jump in rates prompted mortgage lenders to suspend deals with new customers, eventually offering them again at significantly higher borrowing costs. There were fears that this would lead to a crash in the housing market.

In addition, the drop in gilt prices led to a crisis in pension funds, putting them at risk of insolvency.

Many members of Truss’ party voiced opposition to the high levels of borrowing likely necessary to finance the tax cuts and spending and said they would vote against the package.

The International Monetary Fund, which bailed out the U.K. in 1976, even offered its figurative two cents on the tax cuts, urging the government to “reevaluate” the plan. The comments further spooked investors.

To prevent a broader crisis in financial markets, the Bank of England stepped in and pledged to purchase up to £65 billion in government bonds.

Besides causing investors to lose faith, the crisis also severely dented the public’s confidence in the U.K. government. The latest polls showed the opposition Labour Party enjoying a 24-point lead, on average, over the Conservatives.

So the government likely had little choice but to reverse course and drop the most controversial part of the plan, the abolition of the 45% tax rate. The pound recovered its losses. The recovery in gilts was more modest, with bonds still trading at elevated levels.

Putting this all together, less than a month into the job, Truss has lost confidence – and credibility – with international investors, voters and her own party. And all this over a “mini-budget” – the full budget isn’t due until November 2022. It suggests the U.K.‘s troubles are far from over, a view echoed by credit rating agencies.The Conversation

About the Author:

David McMillan, Professor in Finance, University of Stirling

This article is republished from The Conversation under a Creative Commons license. Read the original article.

The Analytical Overview of the Main Currency Pairs on 2022.10.06

By JustForex

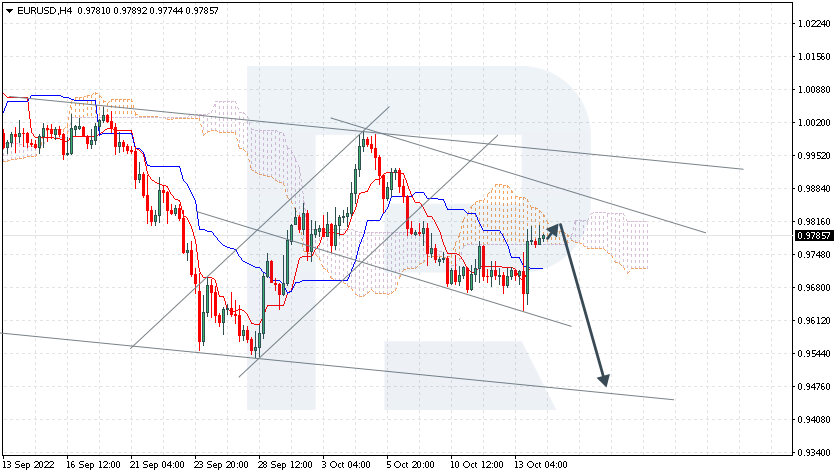
The EUR/USD currency pair

Technical indicators of the currency pair:
  • Prev Open: 0.9981
  • Prev Close: 0.9868
  • % chg. over the last day: -1.15 %

Fed Funds futures traders still estimate a roughly 67% chance of another Fed Funds interest rate hike of 75 basis points in early November and an almost 70% chance of another 50-75 bps hike by the end of the year. Thus, experts believe that the current decline of the dollar is temporary. Goldman Sachs analysts said there is a 30% chance that the US will go into recession within the next 12 months, but the probability of recession in the Eurozone is twice as high.

Trading recommendations
  • Support levels: 0.9845, 0.9748, 0.9666.
  • Resistance levels: 0.9965, 1.0111, 1.0162, 1.0230

From the technical point of view, the trend on the EUR/USD currency pair on the hourly time frame is bullish. The MACD indicator has become inactive, but the price is trading above the average lines, and the buyer’s pressure remains high. Buy trades should be considered from the support level of 0.9883. Sell deals can be considered from the resistance level of 1.0058, but only with confirmation.

Alternative scenario: if the price breaks down through the support level of 0.9666 and fixes below it, the downtrend will likely resume.

EUR/USD
News feed for 2022.10.06:
  • – Eurozone ECB Monetary Policy Meeting Accounts at 14:30 (GMT+3);
  • – US Initial Jobless Claims (w/w) at 15:30 (GMT+3).

The GBP/USD currency pair

Technical indicators of the currency pair:
  • Prev Open: 1.1462
  • Prev Close: 1.1321
  • % chg. over the last day: -1.25 %

The British Pound is “frozen in the air” because of the uncertainty of further steps of the British Government. Now the Bank of England has to make a move to balance the situation and not let the British currency plummet to lows again. Analysts believe that the fundamental component still points to GBP/USD quotes decrease due to the difference in the interest rates of the US Federal Reserve and the Bank of England, and also because of the growing problems in the UK, especially in the energy sector, before the coming winter.

Trading recommendations
  • Support levels: 1.1248, 1.1121, 1.0915, 1.0816, 1.0711, 1.03
  • Resistance levels: 1.1478, 1.1693, 1.1816, 1.1901

From the technical point of view, the GBP/USD currency pair trend on the hourly time frame is bullish. The MACD indicator has become inactive, but the divergence is still present. Under such market conditions, buy trades can be considered from the support level of 1.1248 or 1.1121, but only with confirmation. Sell trades are best to look for on intraday time frames. The nearest resistance level is 1.1478, but better also with a confirmation in the form of a false breakout since the level has already been tested.

Alternative scenario: if the price breaks down of the 1.0817 support level and fixes below it, the downtrend will likely resume.

GBP/USD
News feed for 2022.10.06:
  • – UK Construction PMI (m/m) at 11:30 (GMT+3).

The USD/JPY currency pair

Technical indicators of the currency pair:
  • Prev Open: 144.06
  • Prev Close: 144.67
  • % chg. over the last day: +0.42 %

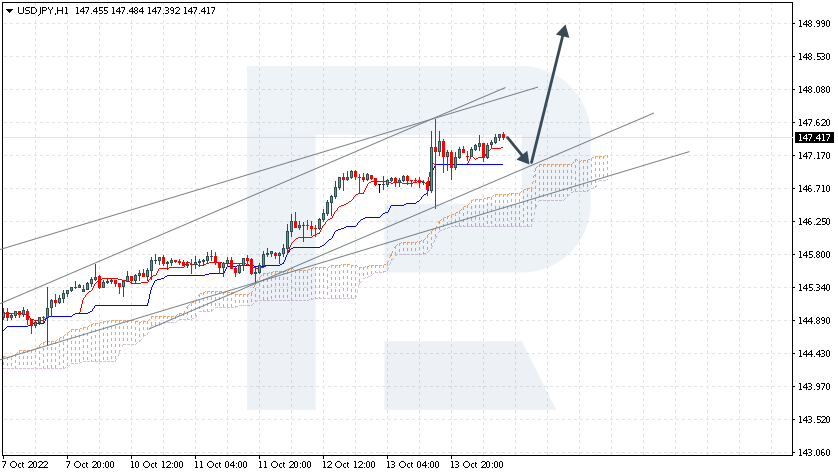
The situation on the USD/JPY currency pair remains the same. The Bank of Japan is keeping its ultra-soft monetary policy and will not change it before the end of the year. The US Federal Reserve, on the contrary, is in a cycle of tightening monetary policy and aggressively raises the interest rate at each of its meetings. Such divergent policy has already caused unprecedented growth of USD/JPY quotes for the last half a year, which resulted in the Ministry of Finance of Japan conducting an intervention in currency and informing to defend the level of 145. The problem is that the situation has not changed fundamentally, and USD/JPY is inclined to grow. The question is whether the Ministry of Finance of Japan has enough courage and resources to intervene more to hold the rate.

Trading recommendations
  • Support levels: 143.00, 140.60, 139.61, 138.78, 137.65, 136.80, 135.20
  • Resistance levels: 144.66, 145.35

From the technical point of view, the medium-term trend on the currency pair USD/JPY is bullish. The MACD indicator has become inactive, and the price is trading at the level of moving averages. Under such market conditions, buy trades can be searched for on intraday time frames from the support level of 143.00, but with confirmation. Sell deals can be searched from the resistance level of 144.66 or 145.35, but only with additional confirmation.

Alternative scenario: If the price fixes below 140.60, the downtrend will likely resume.

USD/JPY
News feed for 2022.10.06:
  • – Japan BOJ Gov Kuroda Speaks at 03: (Tentative).

The USD/CAD currency pair

Technical indicators of the currency pair:
  • Prev Open: 1.3517
  • Prev Close: 1.3617
  • % chg. over the last day: +0.74 %

The Canadian dollar is a commodity currency and depends on the performance of the dollar index and oil prices. Yesterday, the OPEC+ countries agreed to cut oil production by 2 million barrels daily. Oil producers do not want to allow oil prices to fall and keep the price of “black gold” above $90 per barrel. After this statement, Goldman Sachs has increased at once by $10 up to $110 by the end of the year. Thus, the growth in oil prices can trigger a new round of inflation acceleration on the background of growing energy prices. However, the Canadian dollar will only benefit from it and will get stronger as oil prices go up.

Trading recommendations
  • Support levels: 1.3434, 1.3297, 1.3212, 1.3053, 1.2990, 1.2958
  • Resistance levels: 1.3660, 1.3755, 1.3858, 1.3968

From the point of view of technical analysis, the trend on the USD/CAD currency pair is bearish. The price is trading below the moving lines. The MACD indicator has become inactive. Under such market conditions, buy trades should be considered on the lower time frames from the support level of 1.3534, but with confirmation. For sell deals, it is better to consider the resistance level of 1.3660 or 1.3756, but only after the additional confirmation.

Alternative scenario: if the price breaks out through and consolidates above the resistance level of 1.3756, the uptrend will likely resume.

USD/CAD
News feed for 2022.10.06:
  • – Canada Ivey PMI (m/m) at 17:00 (GMT+3).

By JustForex


This article reflects a personal opinion and should not be interpreted as an investment advice, and/or offer, and/or a persistent request for carrying out financial transactions, and/or a guarantee, and/or a forecast of future events.

OPEC+ countries are cutting production. Credit Suisse bank moves toward default

By JustForex

After a smaller-than-expected interest rate hike by the RBA this week and the UN asking central banks to slow interest rate hikes, the fundamental narrative shifted toward a potential “turnaround” by the Fed toward a slower interest rate hike. This has helped support stock markets. On the other hand, the US Consumer Confidence and Service Sector Activity Index data were better than expected, suggesting that the US economy is holding up relatively well so far. Thus, the US Fed may not shy away from its hawkish bias, which will once again put pressure on stocks.

As the stock market closed yesterday, the Dow Jones Index (US30) decreased by 0.14%, and the S&P 500 Index (US500) lost 0.20%. NASDAQ technology index (US100) fell by 0.30%.

Mary Daley, President of the San Francisco Federal Reserve, said that the Fed’s goal is to keep tightening monetary policy until interest rates are at a restrictive level. The policymaker added that the US Federal Reserve does not expect interest rates to fall in 2023.

Credit Suisse’s credit risk continues to rise sharply. Yesterday, SocGen analysts wrote that Credit Suisse must actively deleverage its investment banking operations or risk default. But analysts at HSBC said Credit Suisse has no immediate concerns about liquidity and funding.

Equity markets in Europe were mostly down yesterday. German DAX (DE30) was 1.21% lower, French CAC 40 (FR40) fell by 0.90%, Spanish IBEX 35 (ES35) decreased by 1.52%, British FTSE 100 (UK100) was 0.48% lower.

With almost 90% of the storage capacity in the EU, Europe will survive the coming winter with only a few scratches, barring any political or technical surprises, but the real difficulties will start in February or March when the storage capacity needs to be filled again.

The German economy minister blamed the United States and other “friendly” gas-supplying countries for the astronomical prices of their supplies. According to the minister, some gas suppliers are profiting from the consequences of the war in Ukraine, which has led to a sharp rise in global energy prices. Russia’s invasion of Ukraine continues to undermine energy markets, global supply chains remain trapped in China’s COVID-19 strategy, and advanced economies are moving ever closer to stagflation.

Leaders from more than 40 countries, meeting Thursday in the Czech capital, are set to create a “European Political Community,” which aims to increase security and prosperity across the continent. But critics say the new forum is an attempt to stall the expansion of the European Union.

OPEC+ countries have agreed to cut oil production by 2 million BPD. OPEC+ oil production cuts will take effect in November. Oil producers do not want to allow oil prices to fall and will reduce production to maintain “profit.” In a statement issued after the OPEC+ decision, the White House said it was disappointed by the short-sighted decision to cut production quotas at a time when the world economy is facing the continued negative impact of Putin’s invasion of Ukraine. Biden also directed the Energy Secretary to explore additional actions to increase domestic fuel production. Goldman raised its oil forecast immediately by $10 to $110 by the end of the year.

OPEC+ will no longer meet monthly. Meetings will now be held every two months.

Bond yields have corrected downward in recent days amid speculation that the Fed may move to a less aggressive policy in the near future amid growing tensions in financial markets and fears of a global recession. This situation supported gold and silver prices, causing a sharp rally in recent days. But the outlook for gold and silver remains bearish in the medium and long term as the tightening cycle goes on.

Asian markets traded higher yesterday. Japan’s Nikkei 225 (JP225) increased by 0.48%, Hong Kong’s Hang Sengv(HK50) jumped by 5.90%, and Australia’s S&P/ASX 200 (AU200) ended the day up by 1.74%.

S&P 500 (F) (US500) 3,783.28 −7.65 (−0.20%)

Dow Jones (US30) 30,273.87 −42.45 (−0.14%)

DAX (DE40) 12,517.18 −153.30 (−1.21%)

FTSE 100 (UK100) 7,052.62 −33.84 (−0.48%)

USD Index 111.15 +1.09 (+0.99%)

Important events for today:
  • – Japan BOJ Gov Kuroda Speaks at 03:30 (Tentative);
  • – UK Construction PMI (m/m) at 11:30 (GMT+3);
  • – Eurozone ECB Monetary Policy Meeting Accounts at 14:30 (GMT+3);
  • – US Initial Jobless Claims (w/w) at 15:30 (GMT+3);
  • – Canada Ivey PMI (m/m) at 17:00 (GMT+3);
  • – US Natural Gas Storage (w/w) at 17:30 (GMT+3).

By JustForex


This article reflects a personal opinion and should not be interpreted as an investment advice, and/or offer, and/or a persistent request for carrying out financial transactions, and/or a guarantee, and/or a forecast of future events.

Mid-Week Technical Outlook: Commodity Currencies & Minors

By ForexTime 

A sense of caution lingered across financial markets on Thursday as investors weighed the impact of rising oil prices on economic growth. Anticipation ahead of the US jobs report on Friday added to the tense atmosphere with market players adopting a guarded approach toward riskier assets. In the equity space, stocks in Europe edged higher as global markets searched for normality after the recent volatility. There was an uneasy calm in the currency markets with the dollar on standby while oil prices hovered near three-week highs after OPEC+ agreed to cut output by 2 million barrels a day.

Over the past few days, our attention has been on the mighty dollar but this morning the spotlight shines on commodity currencies and minors. The minors refer to non-USD forex currency pairs while commodity currencies are those which are correlated with the value of a particular commodity. With oil bulls back in the building thanks to OPEC+ latest decision this could influence commodity currencies. Economic, domestic, and political forces impacting non-USD currencies may translate to increased volatility across minor pairs. Where there is volatility, this presents opportunity and our tool will be technical analysis.

USDCAD eyes 1.3840

Canadian Dollar bulls failed to draw inspiration from the rebound in oil prices yesterday. The USDCAD could be experiencing a technical rebound from 1.3502 which may encourage an incline back towards 1.3840. Overall, the currency pair remains bullish on the daily charts as there have been consistently higher highs and higher lows. A solid breakout above 1.3840 could trigger a move towards 1.4000. Below 1.3502, bears will be eyeing 1.3390.

NZDUSD to resume downtrend?

After failing to conquer the 0.5800 resistance level, the NZDUSD could be preparing to resume its journey south.

All eyes will be on how prices behave around the 0.5720 level which has acted as a resistance in the past. A strong breakdown below this point could encourage a selloff towards 0.5560 and 0.5467. If bulls can push prices back above 0.5800, this could open the doors towards 0.5880 and higher.

AUDUSD trapped within range

There is nothing much going on for AUDUSD but the pressure is building. Support can be found at 0.6390 and resistance at 0.6520. Although there have been consistently lower lows and lower highs, the currency pair could need a directional catalyst to breakout/down. A solid move above 0.6520 could trigger an incline towards 0.6650 and higher. Alternatively, a move below 0.6300 may result in a selloff towards 0.6270 and 0.6200, respectively.

GBPJPY wobbles above 100 SMA

If you are craving action, then look no further.  The GBPJPY has been incredibly volatile over the past few days thanks to fundamental forces in the United Kingdom. Prices are trading below 164.00 as of writing and could edge lower if the 100-day SMA gives way. Bears may target 162.00 and 160.00 if the pound continues to weaken. Alternatively, a move back above 164.00 could open the doors towards 165.50 and 167.00.

EUR/JPY back within range

The EURJPY is trading back within a range with support at 141.50 and resistance at 144.00. A breakout could be on the horizon. Bulls could take control of the driving seat if prices push beyond 144.00. Such a development is likely to open the doors toward 145.60. Should 144.00 prove to be reliable resistance, the currency pair may decline back towards 141.50 and 139.00.


Forex-Time-LogoArticle by ForexTime

ForexTime Ltd (FXTM) is an award winning international online forex broker regulated by CySEC 185/12 www.forextime.com

Kenya’s new finance minister has good credentials but he can’t work miracles

By XN Iraki, University of Nairobi 

President William Ruto has nominated Njuguna Ndung’u to head Kenya’s National Treasury. A Central Bank of Kenya governor for eight years between 2007 and 2015, Ndung’u is also an accomplished researcher and a University of Nairobi academic. He has extensive expertise in macroeconomics (inflation, economic growth, national income and unemployment) and poverty reduction.

If parliament approves his nomination, Ndung’u will lead the treasury in difficult circumstances. The country is just emerging from divisive electoral campaigns. It also faces economic challenges.

The government is spending more than it gets in revenue, inflation is rising and the value of the shilling is tumbling against major currencies.

Ndung’u has his work cut out for him. Ruto campaigned on the platform of mending a broken economy and redistributing growth dividends to low-income earners.

With a PhD in economics, Ndung’u has a deep understanding of both local and global economic trends. His latest stint was as executive director of the Africa Economic Research Consortium, a research and policy think-tank.

He has been an advisor to international organisations, such as the Brookings Institution and the International Development Research Centre (Africa’s regional office).

The job at hand

The Treasury Cabinet Secretary (finance minister) manages the revenues and expenditures of the country.

The government gets its revenue from taxes, grants, debts and dividends paid by state-owned enterprises. The treasury (ministry of finance) delegates powers to raise such revenues.

On the spending side, the ministry has to contend with the dictates of other institutions like parliament, the central bank and multilateral organisations like the World Bank and the International Monetary Fund. Decisions have to be made about how the revenue is shared and used – for recurrent expenditure like paying salaries and debt, and for development such as building roads or hospitals.

In Kenya, the decision is complicated by another factor. The money must be shared with 47 counties.

What he brings to the position

Ndung’u will have to make Ruto’s bottom-up economics model work. That means focusing on the people at the bottom of the pyramid who lack capital and opportunities to run businesses. The expectation is that empowering this segment of society would create more jobs and give more citizens a higher standard of living. This model is contrasted with trickle-down economics, which gives resources to a few at the “top” in the hope that it spreads down to the masses.

Ndung’u previously worked at the Kenya Institute of Public Policy Research and Analysis, which advises government departments, including the National Treasury, on policy issues. In 2001, he helped develop a macroeconomics model to analyse Kenya’s economy.

He is back in familiar waters, having been a central bank governor at the chaotic start of Mwai Kibaki’s second term in 2008, when post-election violence and the global financial crisis slowed down the Kenyan economy. He was a member of the National Economic and Social Council that Kibaki put together to lift the economy.

His most valuable experience for the task at hand is, perhaps, his mastery of monetary tools as a central banker. His new role focuses on fiscal policy (spending, tax and debt).

He is likely to work in tandem with the central bank, avoiding fiscal policies that upset monetary measures (like interest rates). Harmony between fiscal and monetary policies would be good for stability of the currency (as the UK is finding out).

Ndung’u is also known to have championed financial inclusion, mainly through mobile banking. This implies mass access to affordable payments, savings, credit and insurance.

He was bold in getting banks to accept mobile money, which was unpopular at the time. This may be a quality needed to drive bottom-up economics. There will have to be institutional changes to accommodate bottom-up economics and some resistance is to be expected. Kenyans are used to trickle-down economics.

Missing in his tool box

But Ndung’u lacks political experience in a cabinet dominated by politicians. He is a technocrat and, as Uhuru Kenyatta’s first term showed, some technocrats find it hard to fit into a new political dispensation. Political experience matters even in the most technical of jobs. In addition, Kenyatta lost his political clout partly because his cabinet, dominated by technocrats, lacked the political weight to sell government programmes to his core support base.

Ruto, too, needs to be careful, in my view. The Treasury under his regime should give free markets a human face. For example, the removal of subsidies could be seen as heartless.

What may not change

I doubt debt taps will close during Ndung’u’s tenure. The debt ceiling may be raised again in the new administration. Given the country’s budget deficit, which is about 6.2% of annual production (GDP), borrowing is bound to continue.

If there is change, it might come in the mixture of debt between long term and short term, as well as bilateral and multilateral loans.

At the moment, Kenya borrows equally from local and foreign lenders. Ruto wants Kenyans to save more, reducing the need for external borrowing. This is unlikely in the short run because of the poverty levels. People save after taking care of the basics, like food and shelter.

Inflation is also likely to remain an issue. Will interest rate hikes slow down inflation? Will government raise wages and salaries to cushion workers? Could cutting taxes be a better option despite fears of stoking inflation? The UK is a good case study – its tax cuts have led to a weaker currency, which implies higher inflation.

Finally, reliance on fiscal and monetary tools may not bear fruit. Kenya is a very informal economy. Tools like interest rate cuts may not work effectively when people borrow mostly informally.

Foreign direct investment and increased trade would be more effective than borrowing, as long as the business environment is attractive to investors.The Conversation

About the Author:

XN Iraki, Associate Professor, Faculty of Business and Management Sciences, University of Nairobi

This article is republished from The Conversation under a Creative Commons license. Read the original article.

Hurricane Ian capped 2 weeks of extreme storms around the globe: Here’s what’s known about how climate change fuels tropical cyclones

By Mathew Barlow, UMass Lowell and Suzana J. Camargo, Columbia University 

When Hurricane Ian hit Florida, it was one of the United States’ most powerful hurricanes on record, and it followed a two-week string of massive, devastating storms around the world.

A few days earlier in the Philippines, Typhoon Noru gave new meaning to rapid intensification when it blew up from a tropical storm with 50 mph winds to a Category 5 monster with 155 mph winds the next day. Hurricane Fiona flooded Puerto Rico, then became Canada’s most intense storm on record. Typhoon Merbok gained strength over a warm Pacific Ocean and tore up over 1,000 miles of the Alaska coast.

Major storms hit from the Philippines in the western Pacific to the Canary Islands in the eastern Atlantic, to Japan and Florida in the middle latitudes and western Alaska and the Canadian Maritimes in the high latitudes.

A lot of people are asking about the role rising global temperatures play in storms like these. It’s not always a simple answer.

Record-setting cyclones in late September 2022.
Mathew Barlow

It is clear that climate change increases the upper limit on hurricane strength and rain rate and that it also raises the average sea level and therefore storm surge. The influence on the total number of hurricanes is currently uncertain, as are other aspects. But, as hurricanes occur, we expect more of them to be major storms. Hurricane Ian and other recent storms, including the 2020 Atlantic season, provide a picture of what that can look like.

Our research has focused on hurricanes, climate change and the water cycle for years. Here’s what scientists know so far.

Rainfall: Temperature has a clear influence

The temperature of both the ocean and atmosphere are critical to hurricane development.

Hurricanes are powered by the release of heat when water that evaporates from the ocean’s surface condenses into the storm’s rain.

A warmer ocean produces more evaporation, which means more water is available to the atmosphere. A warmer atmosphere can hold more water, which allows more rain. More rain means more heat is released, and more heat released means stronger winds.

Simplified cross section of a hurricane.
Mathew Barlow

These are basic physical properties of the climate system, and this simplicity lends a great deal of confidence to scientists’ expectations for storm conditions as the planet warms. The potential for greater evaporation and higher rain rates is true in general for all types of storms, on land or sea.

That basic physical understanding, confirmed in computer simulations of these storms in current and future climates, as well as recent events, leads to high confidence that rainfall rates in hurricanes increase by at least 7% per degree of warming.

Storm strength and rapid intensification

Scientists also have high confidence that wind speeds will increase in a warming climate and that the proportion of storms that intensify into powerful Category 4 or 5 storms will increase. Similar to rainfall rates, increases in intensity are based on the physics of extreme rainfall events.

Damage is exponentially related to wind speed, so more intense storms can have a bigger impact on lives and economies. The damage potential from a Category 4 storm with 150 mph winds, like Ian at landfall, is roughly 256 times that of a category 1 storm with 75 mph winds.

Hurricane Ian’s water vapor on Sept. 28, 2022, meant heavy rainfall for large parts of Florida.
NOAA

Whether warming causes storms to intensify more rapidly is an active area of research, with some models offering evidence that this will probably happen. One of the challenges is that the world has limited reliable historical data for detecting long-term trends. Atlantic hurricane observations go back to the 1800s, but they’re only considered reliable globally since the 1980s, with satellite coverage.

That said, there is already some evidence that an increase in rapid intensification is distinguishable in the Atlantic.

Within the last two weeks of September 2022, both Noru and Ian exhibited rapid intensification. In the case of Ian, successful forecasts of rapid intensification were issued several days in advance, when the storm was still a tropical depression. They exemplify the significant progress in intensity forecasts in the past few years, although improvements are not uniform.

There is some indication that, on average, the location where storms reach their maximum intensity is moving poleward. This would have important implications for the location of the storms’ main impacts. However, it is still not clear that this trend will continue in the future.

Storm surge: Two important influences

Storm surge – the rise in water at a coast caused by a storm – is related to a number of factors including storm speed, storm size, wind direction and coastal sea bottom topography. Climate change could have at least two important influences.

Stronger storms increase the potential for higher surge, and rising temperatures are causing sea level to rise, which increases the water height, so the storm surge is now higher than before in relation to the land. As a result, there is high confidence for an increase in the potential for higher storm surges.

Speed of movement and potential for stalling

The speed of the storm can be an important factor in total rainfall amounts at a given location: A slower-moving storm, like Hurricane Harvey in 2017, provides a longer period of time for rain to accumulate.

There are indications of a global slowdown in hurricane speed, but the quality of historical data limits understanding at this point, and the possible mechanisms are not yet understood.

Frequency of storms in the future is less clear

How the number of hurricanes that form each year may change is another major question that is not well understood.

There is no definitive theory explaining the number of storms in the current climate, or how it will change in the future.

Besides having the right environmental conditions to fuel a storm, the storm has to form from a disturbance in the atmosphere. There is currently a debate in the scientific community about the role of these pre-storm disturbances in determining the number of storms in the current and future climates.

Natural climate variations, such as El Niño and La Niña, also have a substantial impact on whether and where hurricanes develop. How they and other natural variations will change in the future and influence future hurricane activity is a topic of active research.

How much did climate change influence Ian?

Scientists conduct attribution studies on individual storms to gauge how much global warming likely affected them, and those studies are currently underway for Ian.

However, individual attribution studies are not needed to be certain that the storm occurred in an environment that human-caused climate change made more favorable for a stronger, rainier and higher-surge disaster. Human activities will continue to increase the odds for even worse storms, year over year, unless rapid and dramatic reductions in greenhouse gas emissions are undertaken.The Conversation

About the Author:

Mathew Barlow, Professor of Climate Science, UMass Lowell and Suzana J. Camargo, Lamont Research Professor of Ocean and Climate Physics, Columbia University

This article is republished from The Conversation under a Creative Commons license. Read the original article.

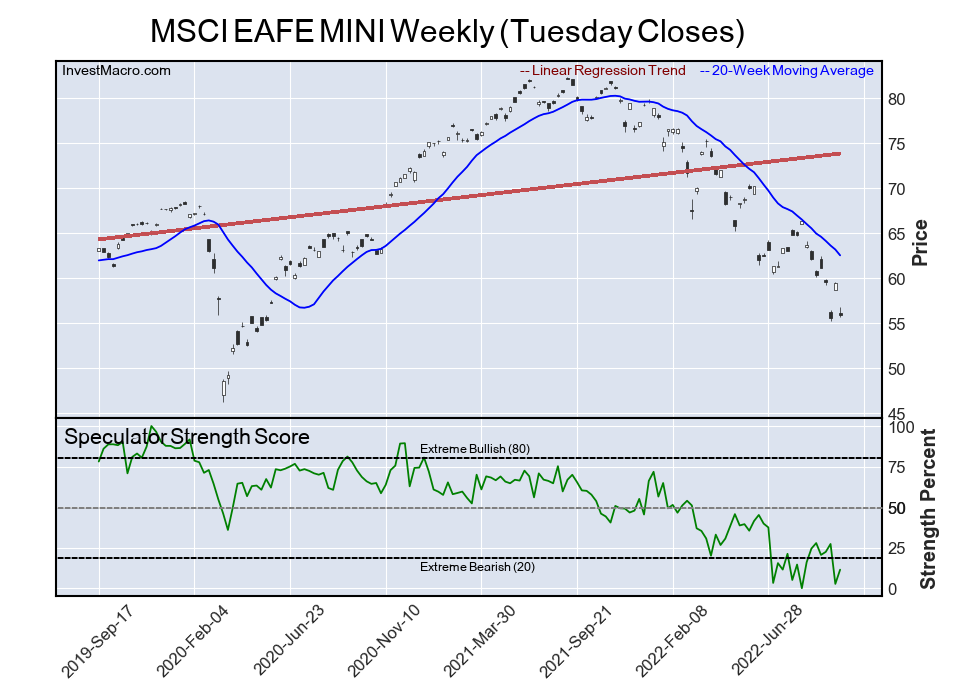
MSCI EAFE ETF dropped by -1.06 percent – October 05 2022

By InvestMacro.com | #stocks #EAFE

EAFE ETF End of Day Update: October 5th 2022

The EAFE EFA ETF finished the day with a decline of -1.06 percent and closed the day around the 58.78 price level, according to unofficial data at the New York close. The EAFE opened the market today at 58.42 with the high of the day being 59.105 and the low of the day bottoming at 58.095.

The EAFE is currently below both the 50-day simple moving average and the 200-day sma. The 50-sma crossed over the 200-sma in early 2022, signaling a potential downtrend that materialized shortly after and continues today.

MSCI EAFE ETF dropped by -1.06 percent - October 05 2022

The EAFE RSI level is Bearish:

The Relative Strength Index, an indicator that can indicate overbought (above 80) and oversold levels (below 20), shows that the current RSI score is at 46.8 for a Bearish reading on the daily time-frame.

EAFE Trends:

The EAFE has fallen by -0.03 percent over the past 10 days while seeing a fall of -7.61 over the past 30 days. The 90-day change is -15.53 while the 180-day return and the 365-day return are -24.49 and -23.58, respectively.

By InvestMacro.com

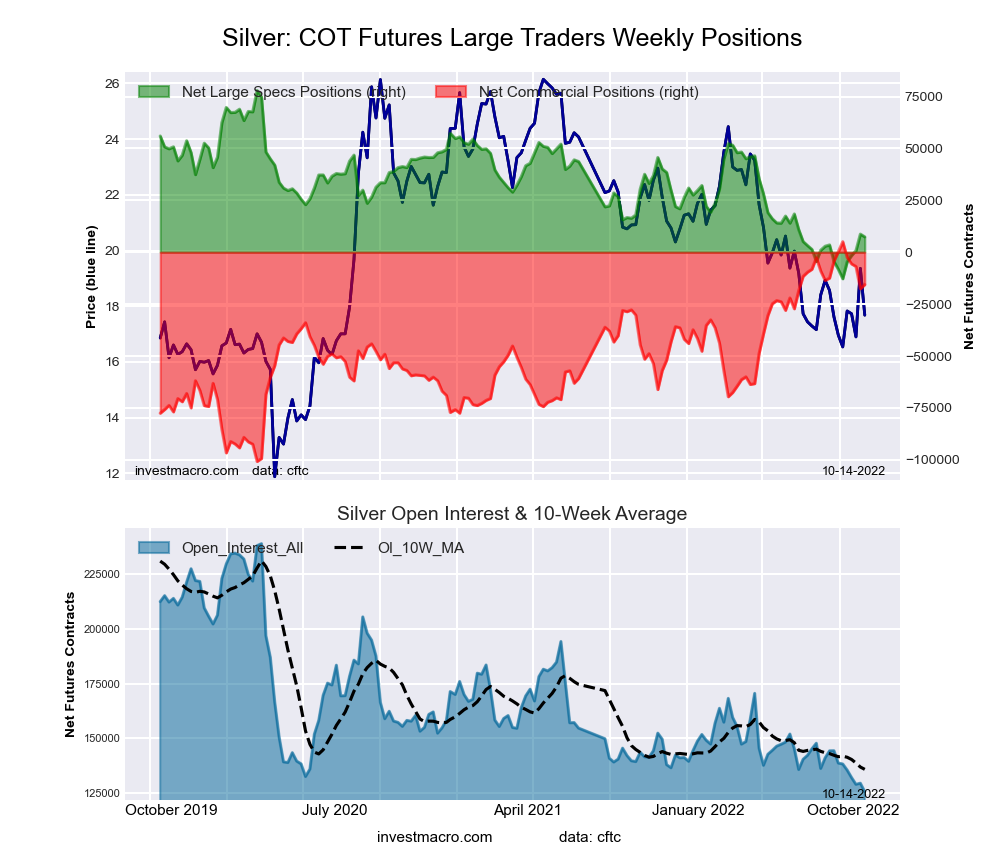
Silver ETF dropped by -1.91 percent – October 5th 2022

By InvestMacro.com | #metals #silver #xagusd #slv

Silver End of Day Update: October 05 2022

The Silver SLV ETF finished the day with a decline by -1.91 percent, closing the day around the 18.99 price level, according to unofficial data at the New York close. SLV opened the at 18.69 with the high reaching approximately 19.1085 and the low of the day bottoming at 18.3684.

The Silver RSI level is Bullish:

The Relative Strength Index, an indicator that can indicate overbought (above 80) and oversold levels (below 20), shows that the current RSI score is at 61.9. This is a Bullish reading on the daily time-frame.

Silver Trends:

The Silver SLV ETF has risen by 5.15 percent over the past 10 days while seeing a gain by 7.78 over the past 30 days. The 90-day change is -6.50 while the 180-day return and the 365-day return are -12.45 and -22.24, respectively.

By investmacro.com

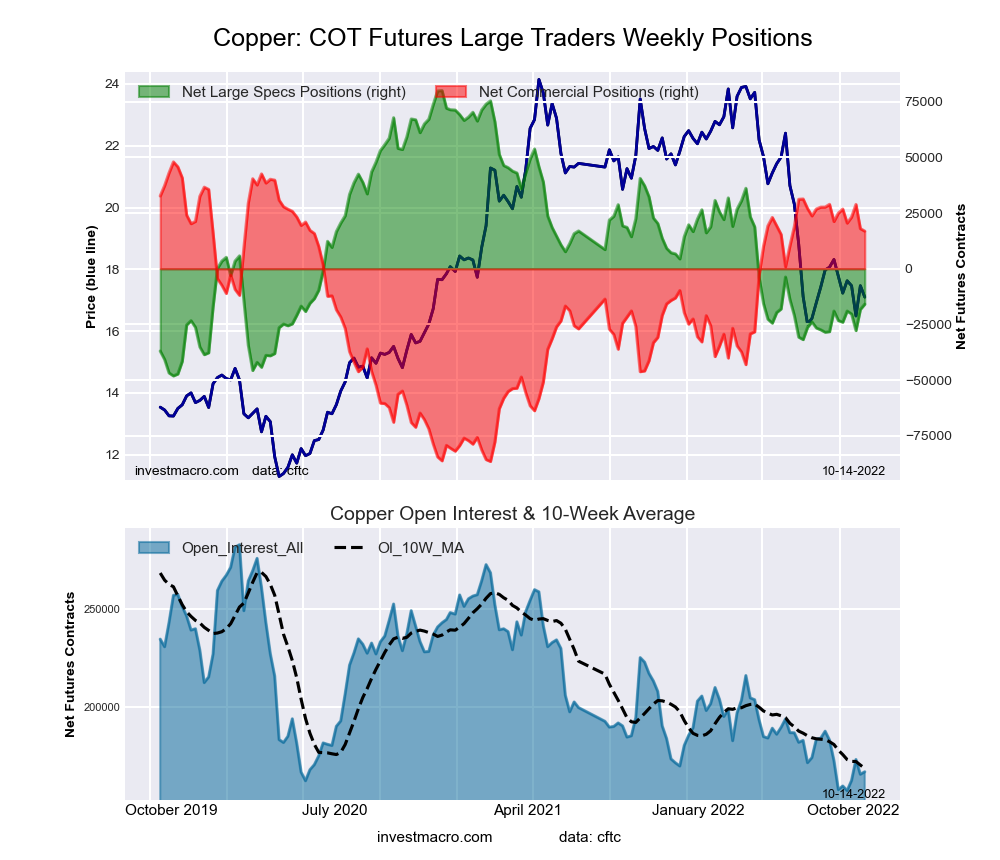
Copper JJC ETF rose by 1.43 percent today – October 05 2022

By InvestMacro.com | #metals #copper #xcuusd #jjc

Copper End of Day Update: October 05 2022

The Copper JJC ETF finished the day with an increase of 1.43 percent and closed the day around the 17.72 price level, according to unofficial data at the New York close. JJC opened the day at 17.41 with the high of the day being 17.78 and the low of the day at 17.26.

The current price is trading slightly above its 50-day simple moving average after a long recent drawdown. The ETF price, meanwhile, is trading quite a ways under the 200-day moving average.

Copper got a lift by 1.43 percent - October 05 2022

The Copper JJC ETF RSI level is Bullish:

The Relative Strength Index, an indicator that can indicate overbought (above 80) and oversold levels (below 20), shows that the current RSI score is at 56.0. This is a Bullish reading on the daily time-frame.

Copper Trends:

The Copper ETF is higher by 2.61 percent over the past 10 days while seeing a decline of -3.28 over the past 30 days. The 90-day change is -16.85 while the 180-day return and the 365-day return are -19.69 and -15.22, respectively.

Copper ETF is higher by 2.61 percent over the past 10 days

By investmacro.com

Russia’s energy war: Putin’s unpredictable actions and looming sanctions could further disrupt oil and gas markets

By Amy Myers Jaffe, Tufts University 

Russia’s effort to conscript 300,000 reservists to counter Ukraine’s military advances in Kharkiv has drawn a lot of attention from military and political analysts. But there’s also a potential energy angle. Energy conflicts between Russia and Europe are escalating and likely could worsen as winter approaches.

One might assume that energy workers, who provide fuel and export revenue that Russia desperately needs, are too valuable to the war effort to be conscripted. So far, banking and information technology workers have received an official nod to stay in their jobs.

The situation for oil and gas workers is murkier, including swirling bits of Russian media disinformation about whether the sector will or won’t be targeted for mobilization. Either way, I expect Russia’s oil and gas operations to be destabilized by the next phase of the war.

The explosions in September 2022 that damaged the Nord Stream 1 and 2 gas pipelines from Russia to Europe, and that may have been sabotage, are just the latest developments in this complex and unstable arena. As an analyst of global energy policy, I expect that more energy cutoffs could be in the cards – either directly ordered by the Kremlin to escalate economic pressure on European governments or as a result of new sabotage, or even because shortages of specialized equipment and trained Russian manpower lead to accidents or stoppages.

Dwindling natural gas flows

Russia has significantly reduced natural gas shipments to Europe in an effort to pressure European nations who are siding with Ukraine. In May 2022, the state-owned energy company Gazprom closed a key pipeline that runs through Belarus and Poland.

In June, the company reduced shipments to Germany via the Nord Stream 1 pipeline, which has a capacity of 170 million cubic meters per day, to only 40 million cubic meters per day. A few months later, Gazprom announced that Nord Stream 1 needed repairs and shut it down completely. Now U.S. and European leaders charge that Russia deliberately damaged the pipeline to further disrupt European energy supplies. The timing of the pipeline explosion coincided with the start up of a major new natural gas pipeline from Norway to Poland.

Russia has very limited alternative export infrastructure that can move Siberian natural gas to other customers, like China, so most of the gas it would normally be selling to Europe cannot be shifted to other markets. Natural gas wells in Siberia may need to be taken out of production, or shut in, in energy-speak, which could free up workers for conscription.

European dependence on Russian oil and gas evolved over decades. Now, reducing it is posing hard choices for EU countries.

Restricting Russian oil profits

Russia’s call-up of reservists also includes workers from companies specifically focused on oil. This has led some seasoned analysts to question whether supply disruptions might spread to oil, either by accident or on purpose.

One potential trigger is the Dec. 5, 2022, deadline for the start of phase six of European Union energy sanctions against Russia. Confusion about the package of restrictions and how they will relate to a cap on what buyers will pay for Russian crude oil has muted market volatility so far. But when the measures go into effect, they could initiate a new spike in oil prices.

Under this sanctions package, Europe will completely stop buying seaborne Russian crude oil. This step isn’t as damaging as it sounds, since many buyers in Europe have already shifted to alternative oil sources.

Before Russia invaded Ukraine, it exported roughly 1.4 million barrels per day of crude oil to Europe by sea, divided between Black Sea and Baltic routes. In recent months, European purchases have fallen below 1 million barrels per day. But Russia has actually been able to increase total flows from Black Sea and Baltic ports by redirecting crude oil exports to China, India and Turkey.

Russia has limited access to tankers, insurance and other services associated with moving oil by ship. Until recently, it acquired such services mainly from Europe. The change means that customers like China, India and Turkey have to transfer some of their purchases of Russian oil at sea from Russian-owned or chartered ships to ships sailing under other nations’ flags, whose services might not be covered by the European bans. This process is common and not always illegal, but often is used to evade sanctions by obscuring where shipments from Russia are ending up.

To compensate for this costly process, Russia is discounting its exports by US$40 per barrel. Observers generally assume that whatever Russian crude oil European buyers relinquish this winter will gradually find alternative outlets.

Where is Russian oil going?

The U.S. and its European allies aim to discourage this increased outflow of Russian crude by further limiting Moscow’s access to maritime services, such as tanker chartering, insurance and pilots licensed and trained to handle oil tankers, for any crude oil exports to third parties outside of the G-7 who pay rates above the U.S.-EU price cap. In my view, it will be relatively easy to game this policy and obscure how much Russia’s customers are paying.

On Sept. 9, 2022, the U.S. Treasury Department’s Office of Foreign Assets Control issued new guidance for the Dec. 5 sanctions regime. The policy aims to limit the revenue Russia can earn from its oil while keeping it flowing. It requires that unless buyers of Russian oil can certify that oil cargoes were bought for reduced prices, they will be barred from obtaining European maritime services.

However, this new strategy seems to be failing even before it begins. Denmark is still making Danish pilots available to move tankers through its precarious straits, which are a vital conduit for shipments of Russian crude and refined products. Russia has also found oil tankers that aren’t subject to European oversight to move over a third of the volume that it needs transported, and it will likely obtain more.

Traders have been getting around these sorts of oil sanctions for decades. Tricks of the trade include blending banned oil into other kinds of oil, turning off ship transponders to avoid detection of ship-to-ship transfers, falsifying documentation and delivering oil into and then later out of major storage hubs in remote parts of the globe. This explains why markets have been sanguine about the looming European sanctions deadline.

One fuel at a time

But Russian President Vladimir Putin may have other ideas. Putin has already threatened a larger oil cutoff if the G-7 tries to impose its price cap, warning that Europe will be “as frozen as a wolf’s tail,” referencing a Russian fairy tale.

U.S. officials are counting on the idea that Russia won’t want to damage its oil fields by turning off the taps, which in some cases might create long-term field pressurization problems. In my view, this is poor logic for multiple reasons, including Putin’s proclivity to sacrifice Russia’s economic future for geopolitical goals.

Russia managed to easily throttle back oil production when the COVID-19 pandemic destroyed world oil demand temporarily in 2020, and cutoffs of Russian natural gas exports to Europe have already greatly compromised Gazprom’s commercial future. Such actions show that commercial considerations are not a high priority in the Kremlin’s calculus.

How much oil would come off the market if Putin escalates his energy war? It’s an open question. Global oil demand has fallen sharply in recent months amid high prices and recessionary pressures. The potential loss of 1 million barrels per day of Russian crude oil shipments to Europe is unlikely to jack the price of oil back up the way it did initially in February 2022, when demand was still robust.

Speculators are betting that Putin will want to keep oil flowing to everyone else. China’s Russian crude imports surged as high as 2 million barrels per day following the Ukraine invasion, and India and Turkey are buying significant quantities.

Refined products like diesel fuel are due for further EU sanctions in February 2023. Russia supplies close to 40% of Europe’s diesel fuel at present, so that remains a significant economic lever.

The EU appears to know it must kick dependence on Russian energy completely, but its protected, one-product-at-a-time approach keeps Putin potentially in the driver’s seat. In the U.S., local diesel fuel prices are highly influenced by competition for seaborne cargoes from European buyers. So U.S. East Coast importers could also be in for a bumpy winter.

This article has been updated to reflect conflicting reports about the draft status of Russian oil and gas workers.The Conversation

About the Author:

Amy Myers Jaffe, Research professor, Fletcher School of Law and Diplomacy, Tufts University

This article is republished from The Conversation under a Creative Commons license. Read the original article.