
By Esther Ndumi Ngumbi, University of Illinois Urbana-Champaign
Across North America, in places such as Illinois, Iowa and Texas, farmers are busy growing the crops the world depends on for food, fuel and fiber.
But as their tractors roll across fields, a pressing concern weighs heavily on many farmers: the rising cost of synthetic fertilizers, widely considered essential for crop production.
After an expensive spring, with the war in Iran restricting fertilizer and petroleum shipments and raising prices, farmers may be wondering whether they can cut back on fertilizer now and in the future to save money.
The answer has a lot to do with a hidden world beneath our feet, where billions of soil-dwelling, beneficial microbes help sustain productive, resilient and healthy crops and agricultural systems.
As a researcher working to uncover the hidden roles of beneficial soil microbes and understand how they improve crop productivity and strengthen plants’ resilience against drought and insect pests, I know that cutting down on fertilizers is not a bad thing. In fact, studies suggest that using less fertilizer can boost this natural workforce.
Plants do not grow alone
Soils hold a vast and extraordinarily diverse hidden world teeming with billions of microbes that are essential for sustaining life on Earth and supporting productive and resilient crops.
Plants including corn, soybeans, wheat and tomatoes form intimate and mutually beneficial relationships with these soil-dwelling microbes. Their partnerships help sustain both plant health and the microbial communities.
A notable group of beneficial soil microbes is arbuscular mycorrhizal fungi and plant growth-promoting rhizobacteria. These soilborne microbes can colonize plant roots, living around the roots, on the plant surface or even inside plant tissue.
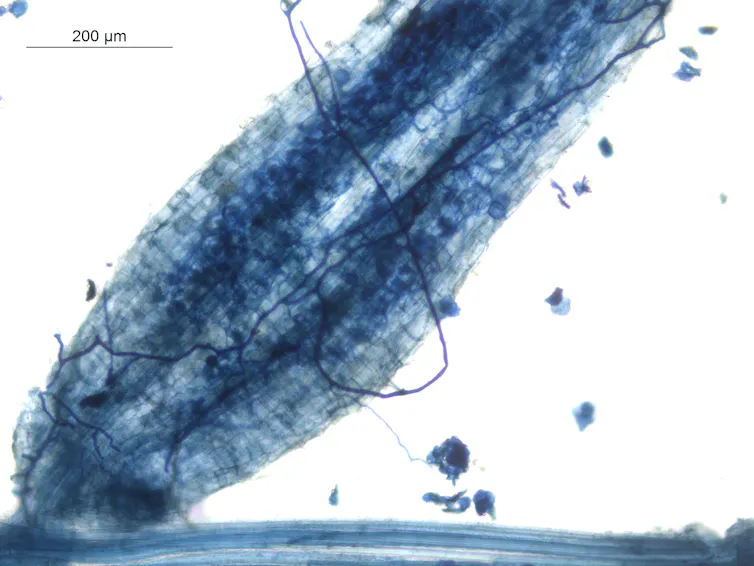
Rajarshi Rit/The University of Burdwan, CC BY
In exchange for shelter, nutrients and carbon-rich sugars that plants produce through photosynthesis, these microbes offer many benefits to plants. They improve plant health and growth, increase yields and enhance the plant’s water and nutrient uptake. They can also boost plants’ ability to withstand pathogens, plant-eating insects and diseases, and survive drought and flooding.
Research has shown that adding microbes, such as arbuscular mycorrhizal fungi, near plant roots can increase plant biomass by nearly 50%. That includes significantly increasing nitrogen absorption by about two-thirds and more than doubling phosphorus uptake, two of the most important nutrients for plant growth.
One analysis found that under drought stress, plants with beneficial microbes in or around their roots had nearly 50% higher growth than those without.
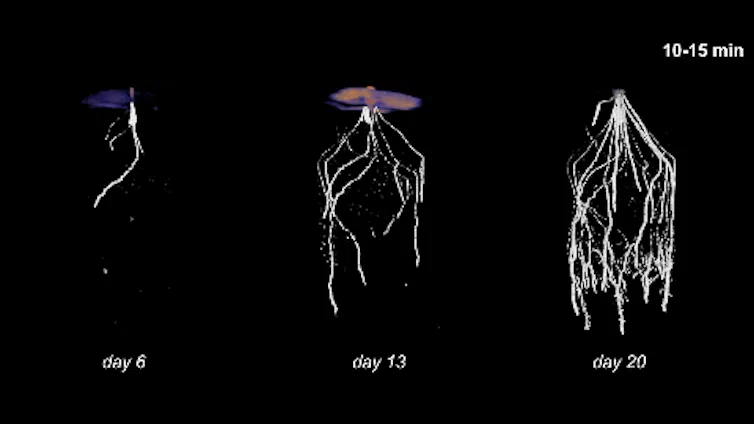
My own team’s research has shown that mycorrhizal fungi can alter chemicals released by plants in ways that are useful for repelling insects while attracting pollinators and insects’ natural enemies. These chemicals can also alert plant neighbors of dangers and threats.

Catherine N. Jacott, Jeremy D. Murray and Christopher J. Ridout, 2017, CC BY
Soil microbes are also associated with many aspects of soil quality and health. They break down organic matter, cycle nutrients, suppress disease-causing pathogens and detoxify contaminants.
How fertilizers harm the microbe-plant relationship
Synthetic fertilizers have certainly played important roles in food and fiber production and increasing crop yields over the years. However, excessive fertilizer use can quietly harm these beneficial soil microbe communities, in addition to fueling water pollution.
Studies have shown that overfertilizing can weaken the underground partnerships between plants and microbes that are fundamental to helping plants access nutrients and tolerate stress. Too much nitrogen fertilizer can reduce the diversity and abundance of beneficial soil microbes.
Researchers have offered several explanations for why synthetic fertilizers harm soil microbes.
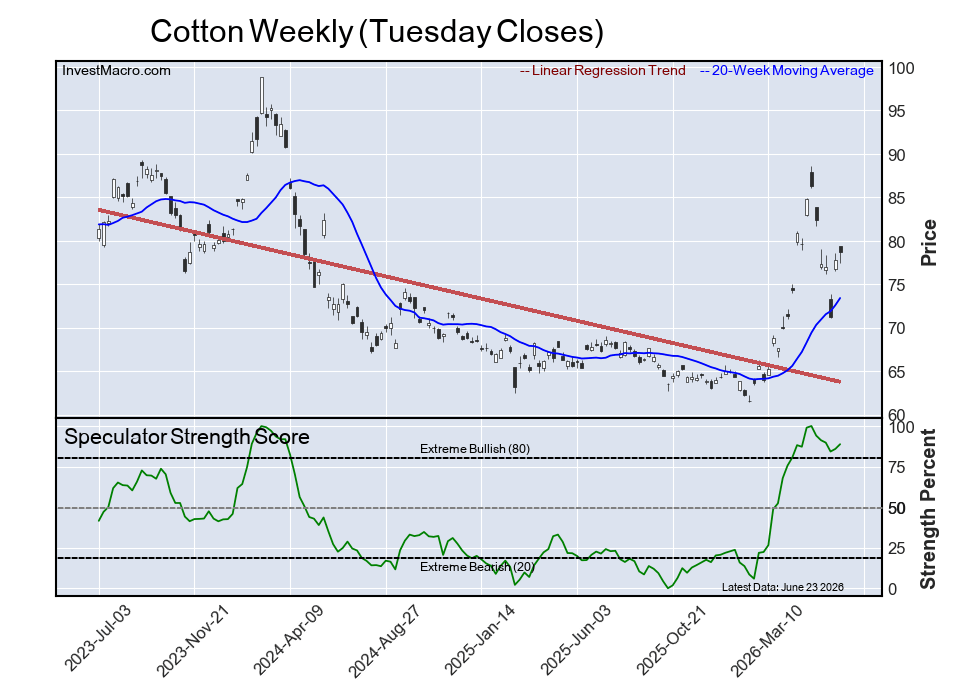
First, adding nutrients reduces the amount of carbon that plants send below ground to microbes. This can lead to the loss of some fungal species or favor microbes that contribute little to plant health.
Sina R. Schultes, et al., 2025, CC BY
Second, adding synthetic fertilizers rich in phosphorus or nitrogen can disrupt the harmonious partnership between plants and microbes. That partnership involves a trade system in which plants provide microbes with sugars from photosynthesis while the microbes help plants acquire limited nutrients from the soil. When nutrients are abundant, plants may forgo the partnership. Ultimately, without an active partnership, fewer microbes will grow.
Third, adding synthetic fertilizer makes soil more acidic, which can inhibit arbuscular mycorrhizal fungi and mycelial development. Research has shown that shifts in soil pH to higher acidity can reduce the growth of some microbes, undermining plant-microbe partnerships that have evolved over millions of years.
The effects of fertilizers on soils, soil microbial communities and beneficial microbe groups such as mycorrhizal fungi vary and are at times inconsistent. They can be affected by many factors, including agricultural management and farming practices, such as cover cropping or tilling, or the crop species and breeding history.
Fertilizing in economically strategic ways
With fertilizer costs high, I believe farmers, researchers and others involved in food production should use this moment to rethink how crops and soils are nourished.
The answer is not to abandon fertilizers but to find a balance between fertilizer use and nurturing the living soils and the billions of microbial communities that quietly sustain American and global agriculture.
In an era of extreme weather, climate uncertainty, geopolitical tensions and rising fertilizer costs, keeping soil healthy and nurturing the billions of microbes living there is not only necessary but also economically strategic.![]()
About the Author:
Esther Ndumi Ngumbi, Assistant Professor, Department of Entomology; African-American Studies, University of Illinois Urbana-Champaign
This article is republished from The Conversation under a Creative Commons license. Read the original article.


 The Dames Point Bridge spans a river in Jacksonville, Fla.