By InvestMacro
Here are the latest charts and statistics for the Commitment of Traders (COT) data published by the Commodities Futures Trading Commission (CFTC).
The latest COT data is updated through Tuesday July 21st and shows a quick view of how large traders (for-profit speculators and commercial entities) were positioned in the futures markets.
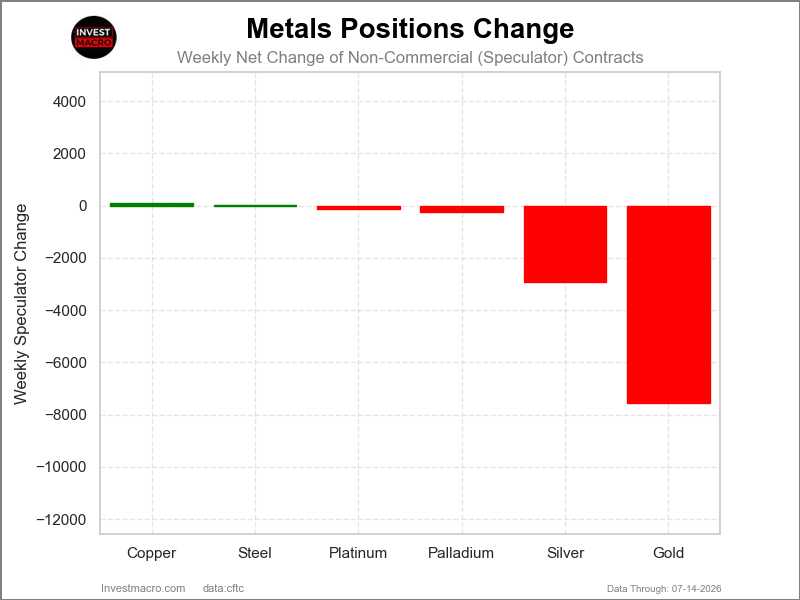
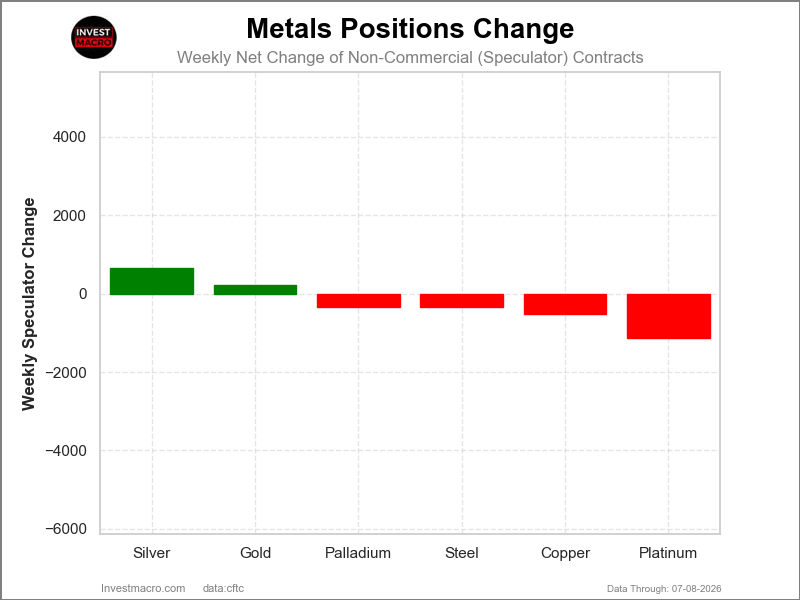
Weekly Speculator Changes led by Copper
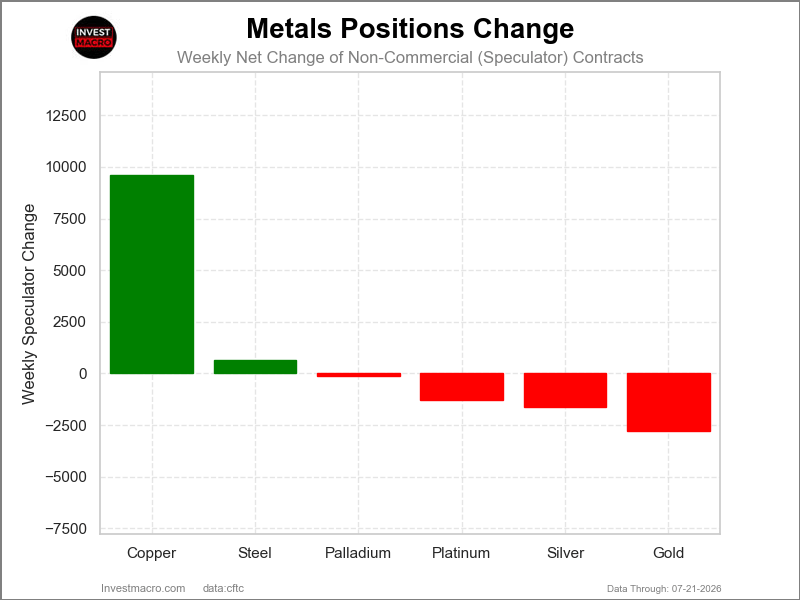
The COT metals markets speculator bets were lower this week as two out of the six metals markets we cover had higher positioning while the other four markets had lower speculator contracts.
Leading the gains for the metals was Copper (9,592 contracts) with Steel (664 contracts) also showing a positive week.
The markets with declines in speculator bets for the week were Gold (-2,772 contracts), Silver (-1,609 contracts), Platinum (-1,264 contracts) and with Palladium (-114 contracts) also registering lower bets on the week.
Silver leads major Metals Price Performances
The highest gainer in the Metals markets prices this week was Silver, which rose by 4.03% over the past five days. Copper was second with a modest 1.16% weekly gain, while Gold was next with a 0.99% rise. Rounding out the gainers was Steel with a 0.24% increase.
On the downside, Platinum saw a small decrease by -0.29% and was followed by Palladium, which was the biggest decliner on the week with a -0.56% drop.
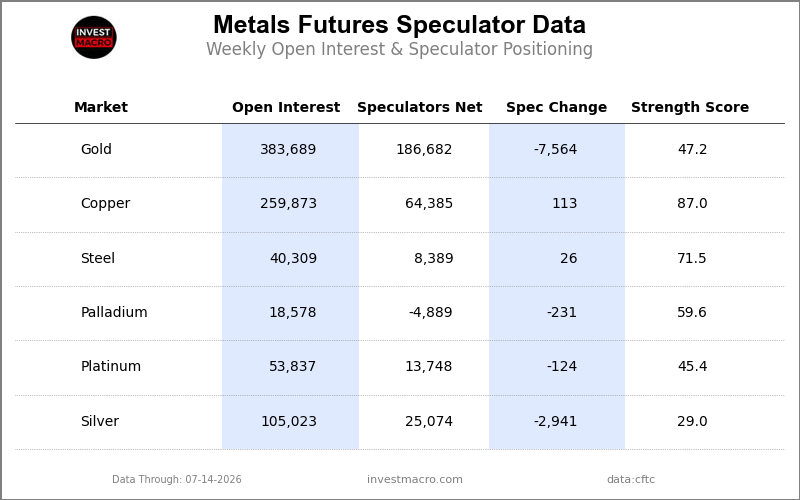
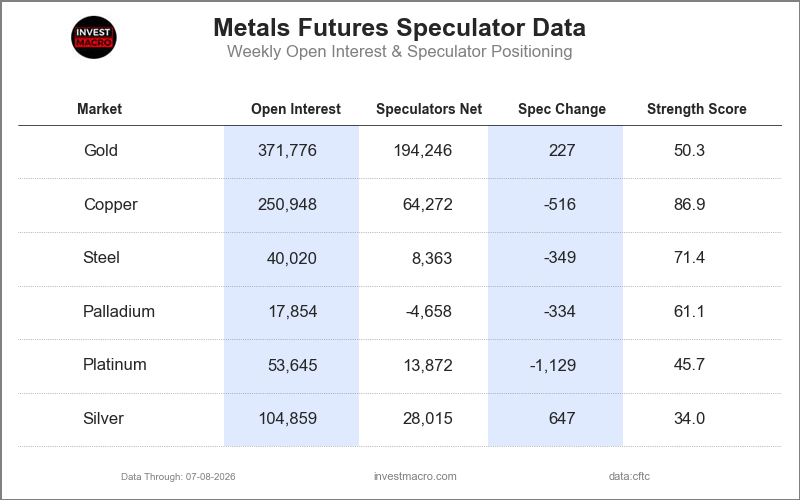
Metals Data:
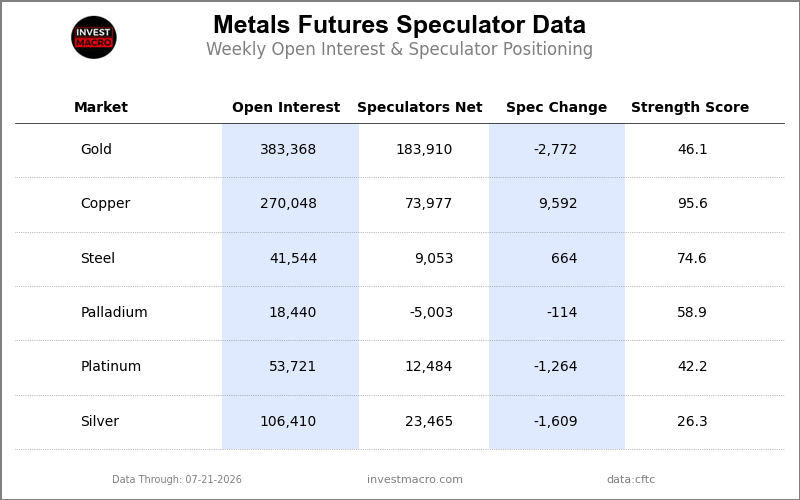
Legend: Weekly Speculators Change | Speculators Current Net Position | Speculators Strength Score compared to last 3-Years (0-100 range)
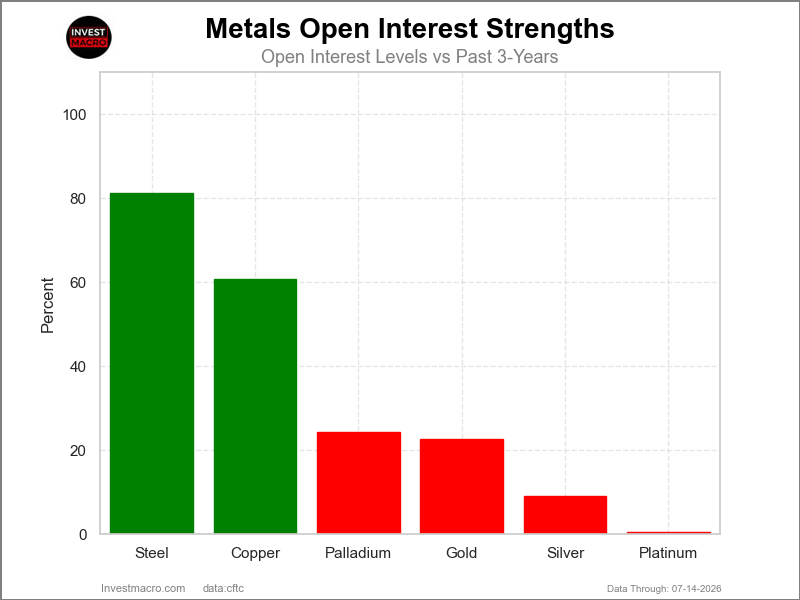
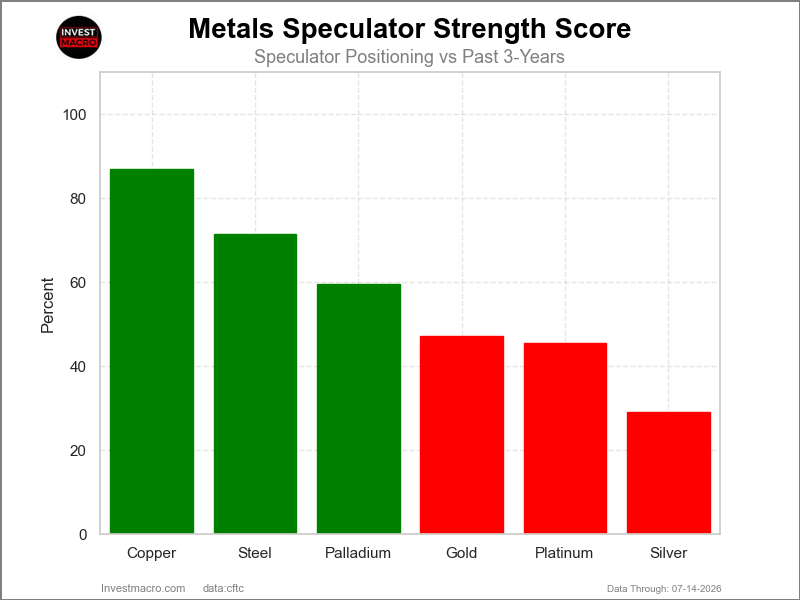
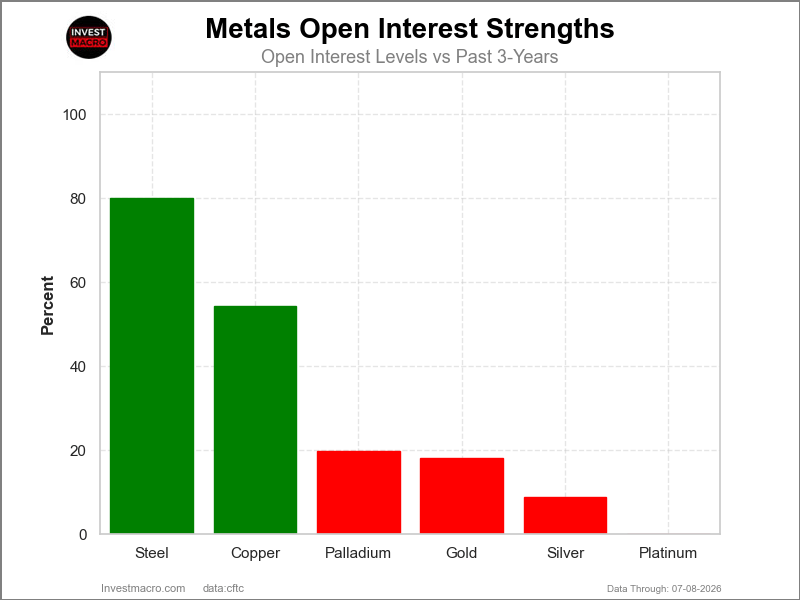
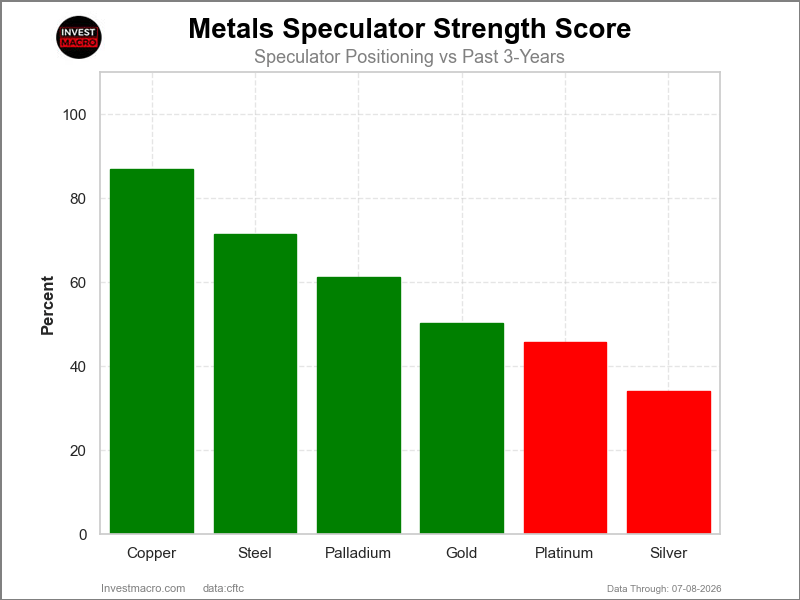
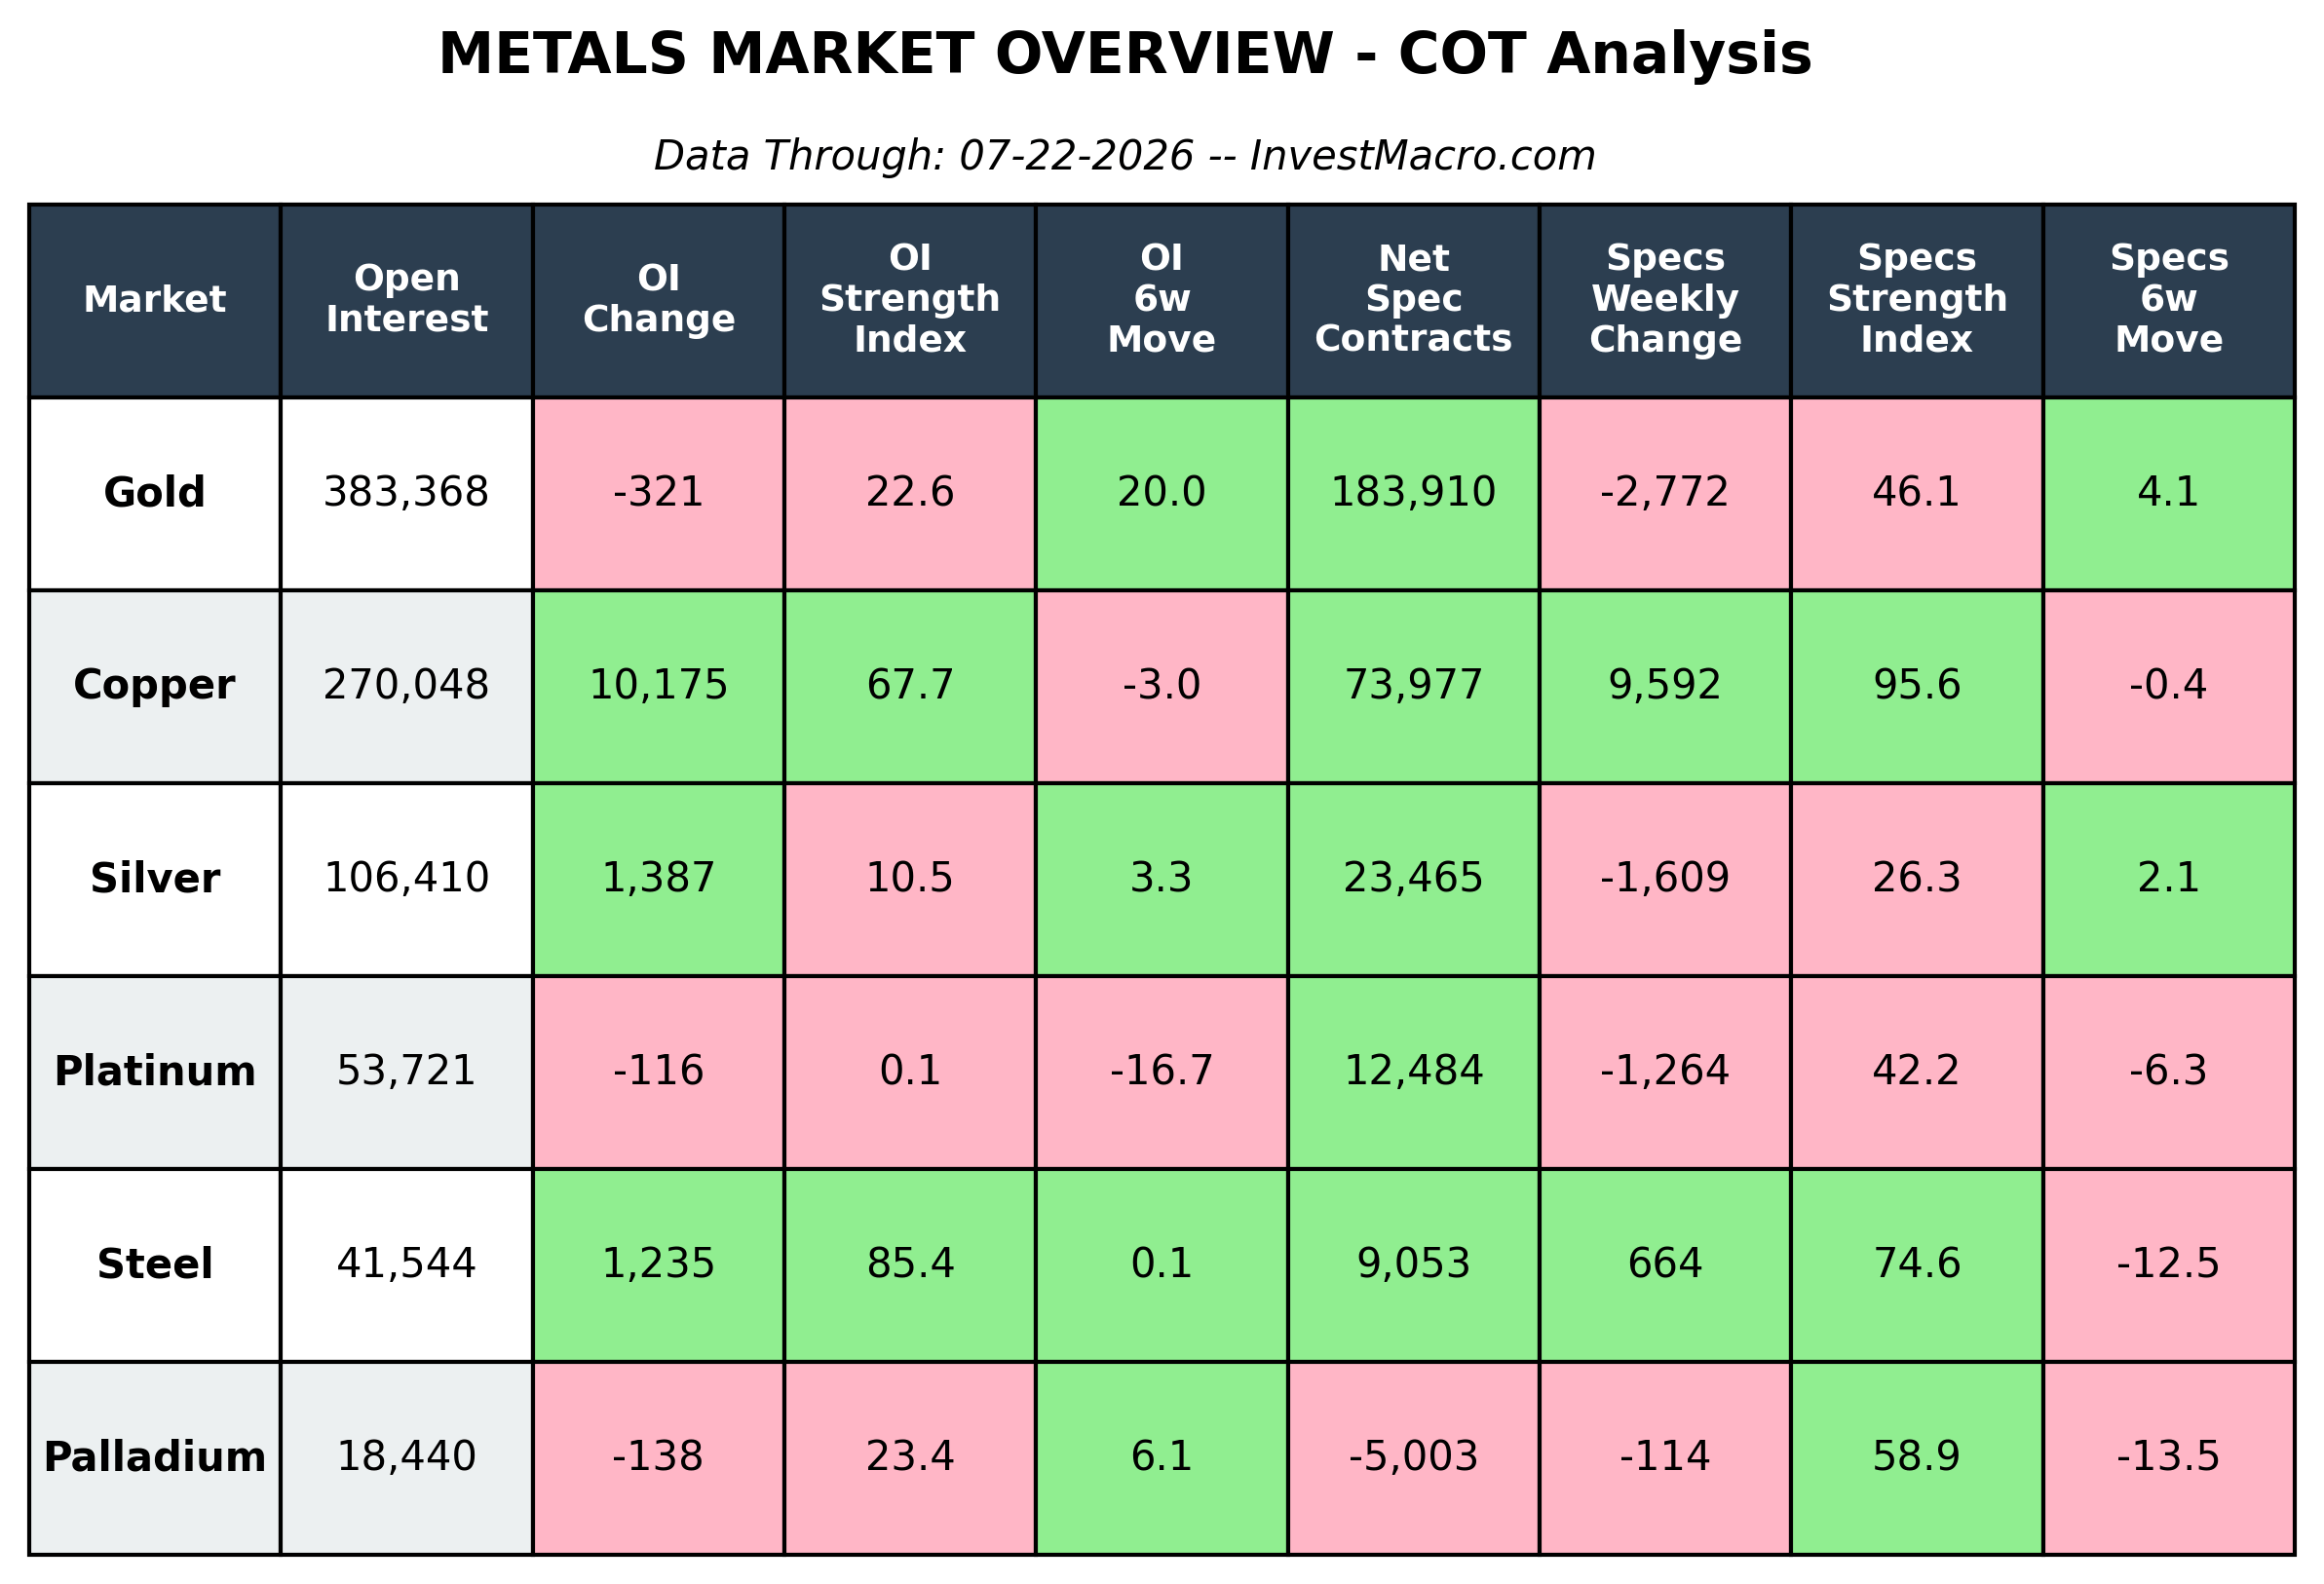
Strength Scores led by Copper & Steel
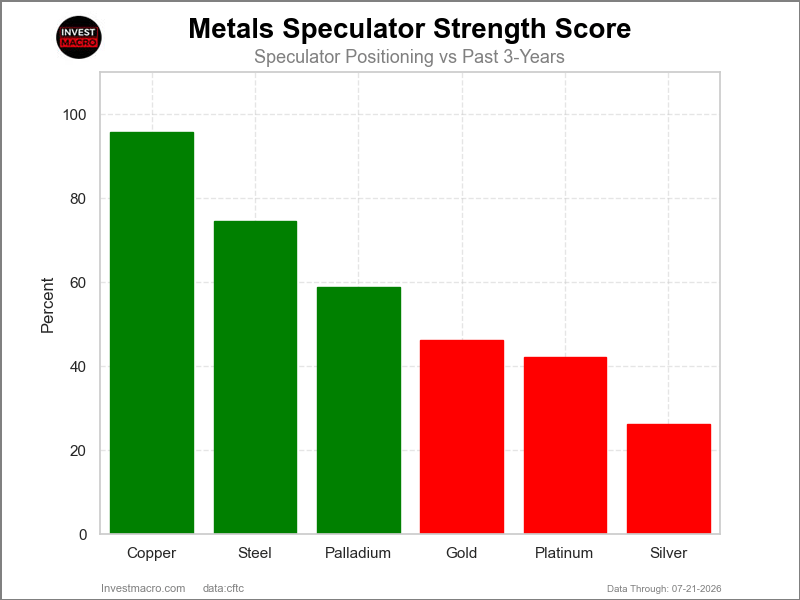
COT Strength Scores (a normalized measure of Speculator positions over a 3-Year range, from 0 to 100 where above 80 is Extreme-Bullish and below 20 is Extreme-Bearish) showed that Copper (96 percent) and Steel (75 percent) lead the metals markets this week. Palladium (59 percent) comes in as the next highest in the weekly strength scores.
On the downside, Silver (26 percent) comes in at the lowest strength level currently with the next lowest strength score being Platinum (42 percent).
Strength Statistics:
Gold (46.1 percent) vs Gold previous week (47.2 percent)
Silver (26.3 percent) vs Silver previous week (29.0 percent)
Copper (95.6 percent) vs Copper previous week (87.0 percent)
Platinum (42.2 percent) vs Platinum previous week (45.4 percent)
Palladium (58.9 percent) vs Palladium previous week (59.6 percent)
Steel (74.6 percent) vs Steel previous week (71.5 percent)
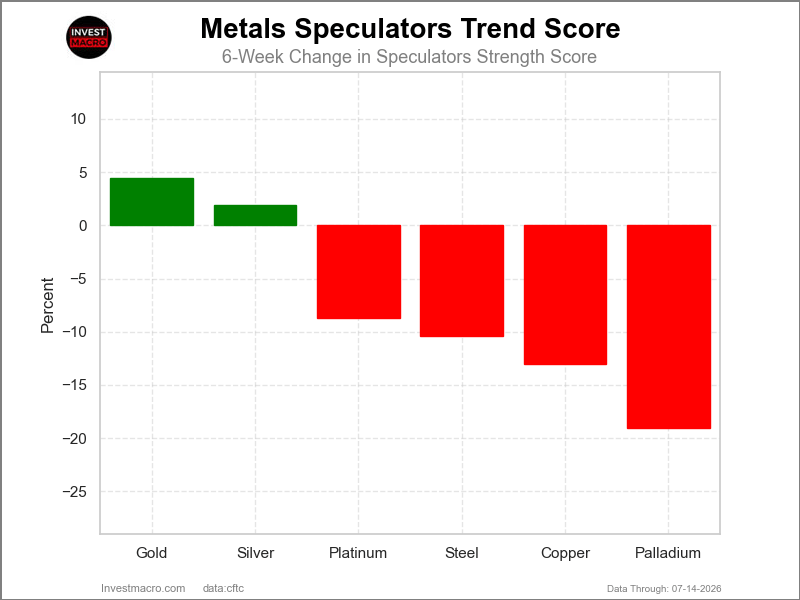
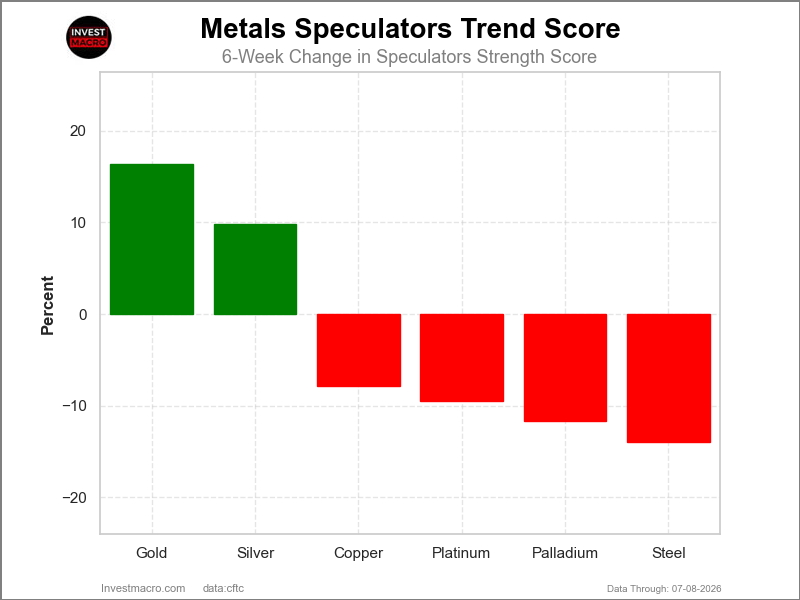
Gold & Silver top the 6-Week Strength Trends
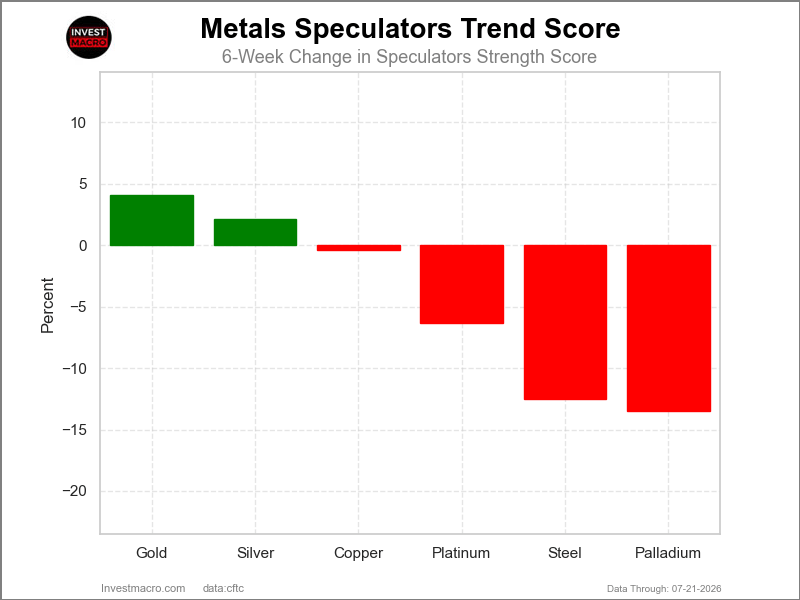
COT Strength Score Trends (or move index, calculates the 6-week changes in strength scores) showed that Gold (4 percent) and Silver (2 percent) lead the past six weeks trends for metals.
Palladium (-13 percent) leads the downside trend scores currently with Steel (-12 percent) as the next market with lower trend scores.
Move Statistics:
Gold (4.1 percent) vs Gold previous week (4.4 percent)
Silver (2.1 percent) vs Silver previous week (1.9 percent)
Copper (-0.4 percent) vs Copper previous week (-13.0 percent)
Platinum (-6.3 percent) vs Platinum previous week (-8.7 percent)
Palladium (-13.5 percent) vs Palladium previous week (-19.0 percent)
Steel (-12.5 percent) vs Steel previous week (-10.4 percent)
Individual Markets:
Gold Comex Futures Futures:
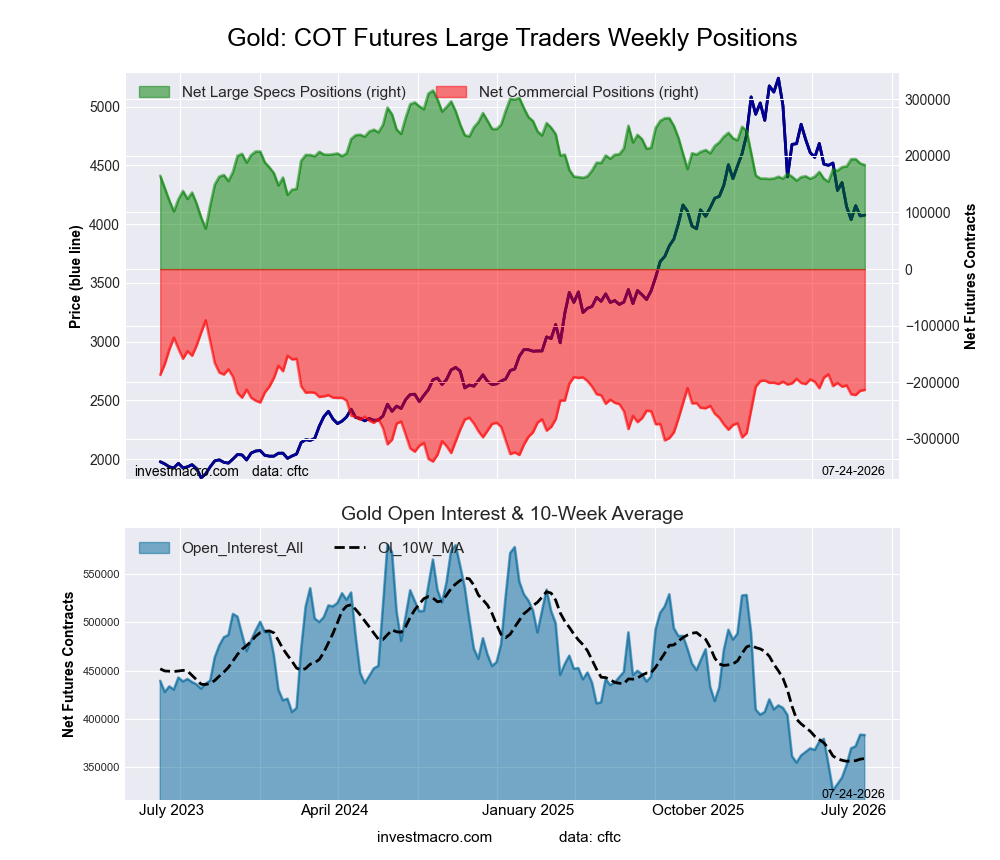 Positioning Notes:
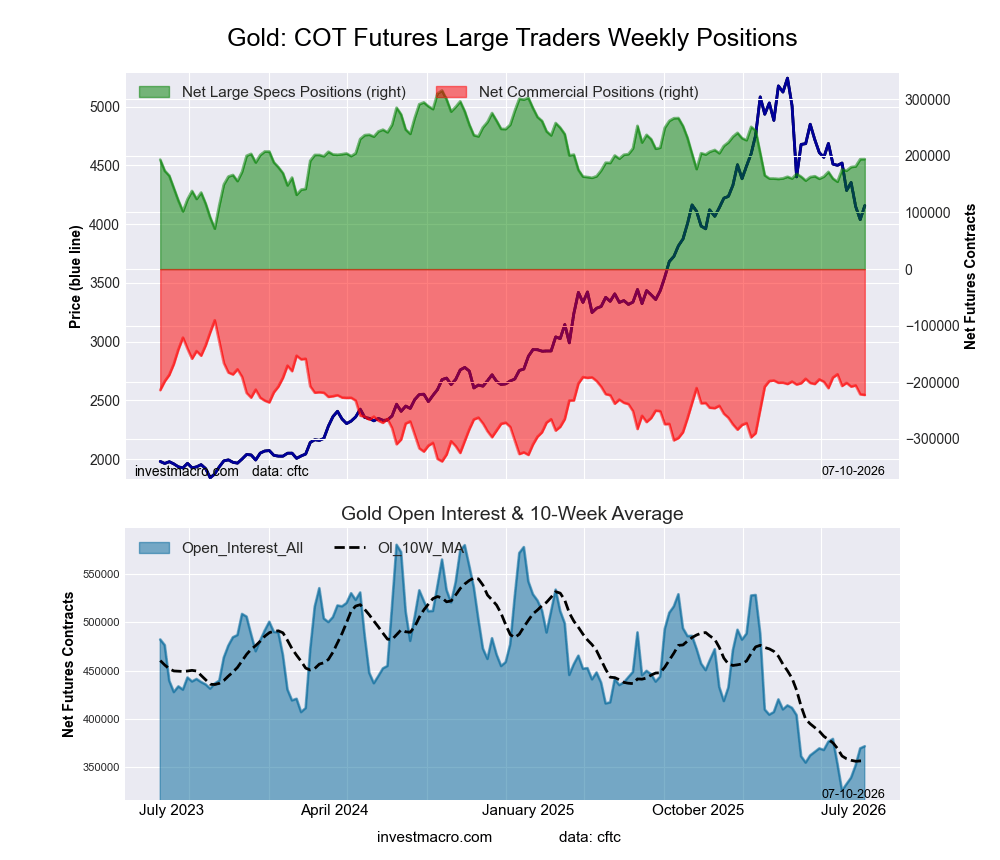
- Gold Comex Futures large speculator standing this week recorded a net position of 183,910 contracts in the data reported through Tuesday.
- Weekly Speculator position fall of -2,772 contracts from the previous week which had a total of 186,682 net contracts.
- This week’s current strength score (range over the past 3 years, measured from 0 to 100) shows the speculators are currently Bearish with a score of 46.1 percent.
- The Commercials are Bullish with a score of 50.7 percent.
- The Small Traders (not shown in chart) are Bullish with a score of 51.6 percent.
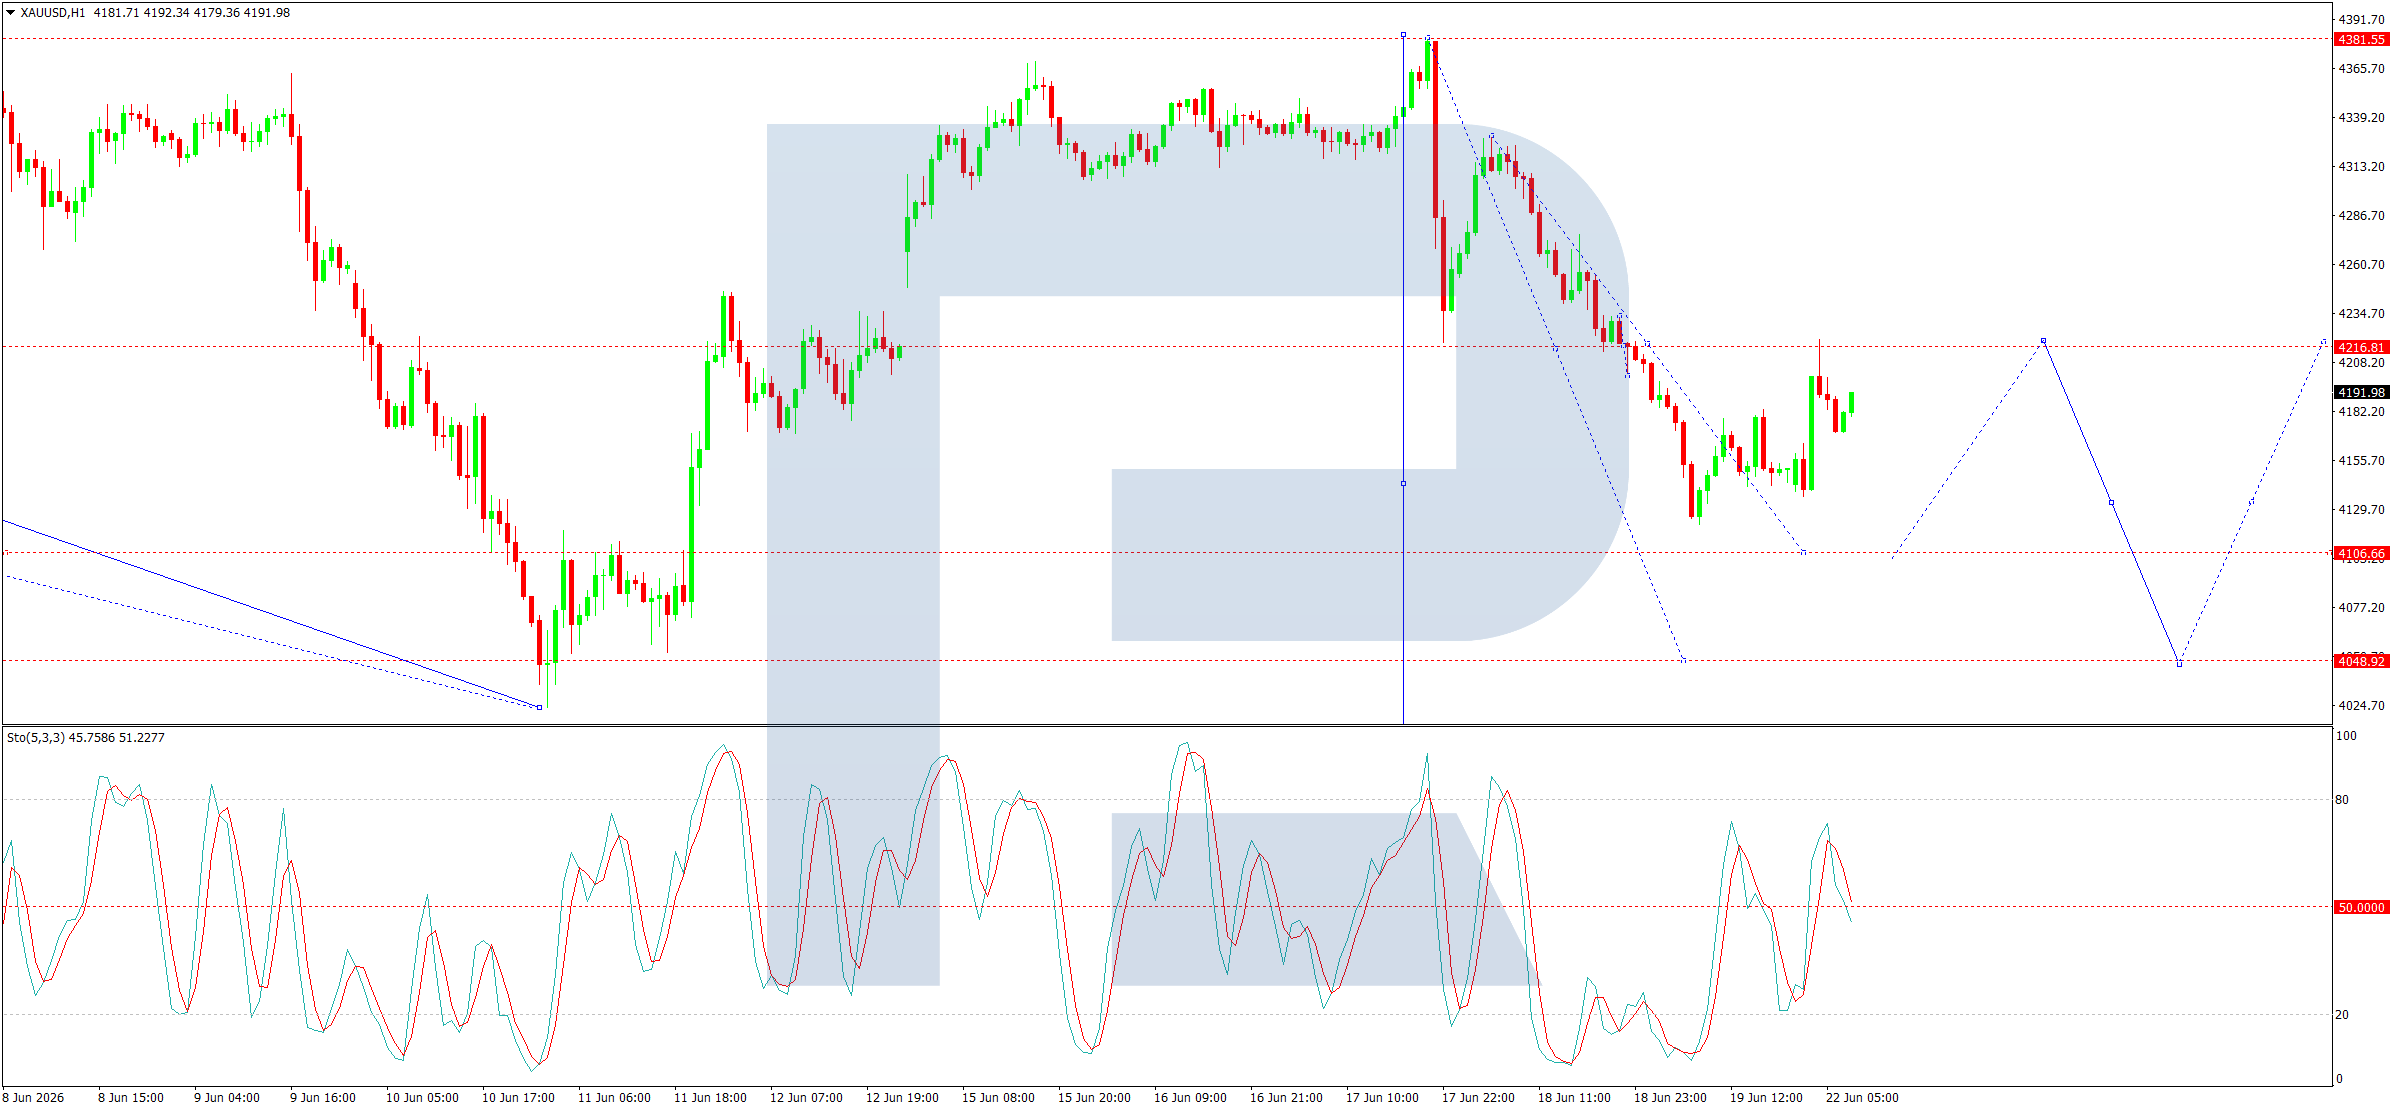
Price Trend-Following Model: Downtrend
Our weekly trend-following model classifies the current market price position as: Downtrend.
| Gold Futures Statistics | SPECULATORS | COMMERCIALS | SMALL TRADERS |
| – Percent of Open Interest Longs: | 58.6 | 21.0 | 12.0 |
| – Percent of Open Interest Shorts: | 10.7 | 76.6 | 4.4 |
| – Net Position: | 183,910 | -213,199 | 29,289 |
| – Gross Longs: | 224,785 | 80,457 | 46,143 |
| – Gross Shorts: | 40,875 | 293,656 | 16,854 |
| – Long to Short Ratio: | 5.5 to 1 | 0.3 to 1 | 2.7 to 1 |
| NET POSITION TREND: | |||
| – Strength Index Score (3 Year Range Pct): | 46.1 | 50.7 | 51.6 |
| – Strength Index Reading (3 Year Range): | Bearish | Bullish | Bullish |
| NET POSITION MOVEMENT INDEX: | |||
| – 6-Week Change in Strength Index: | 4.1 | -4.9 | 6.1 |
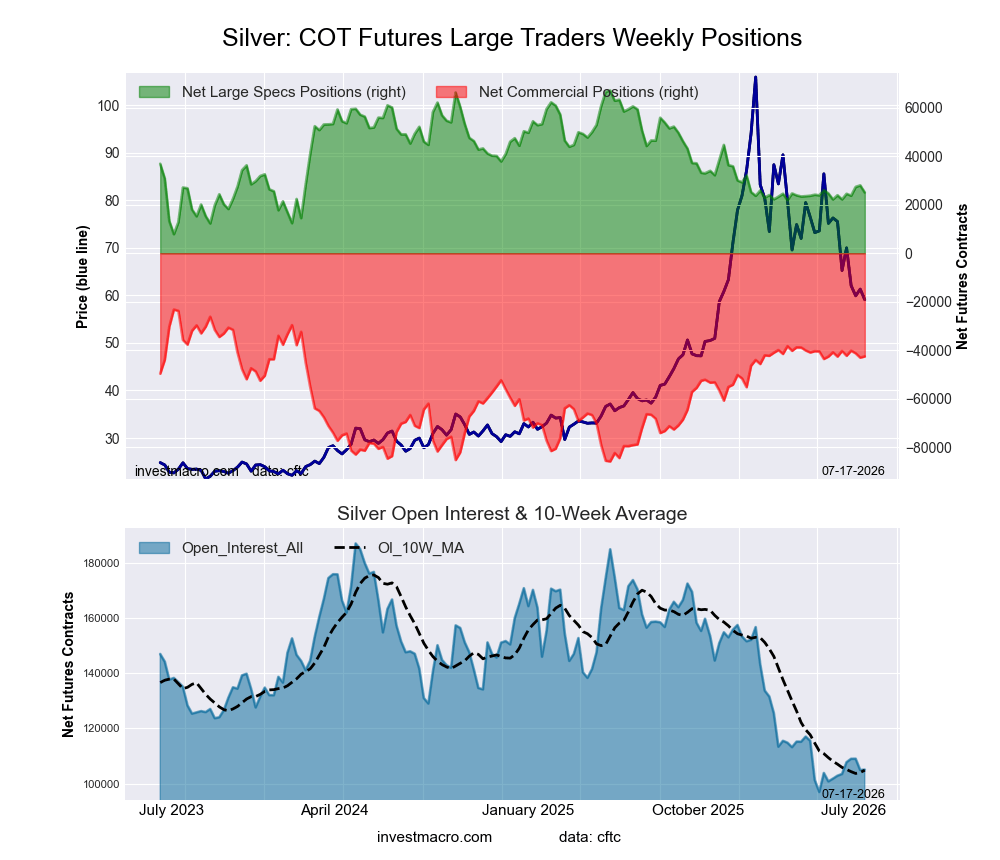
Silver Comex Futures Futures:
 Positioning Notes:
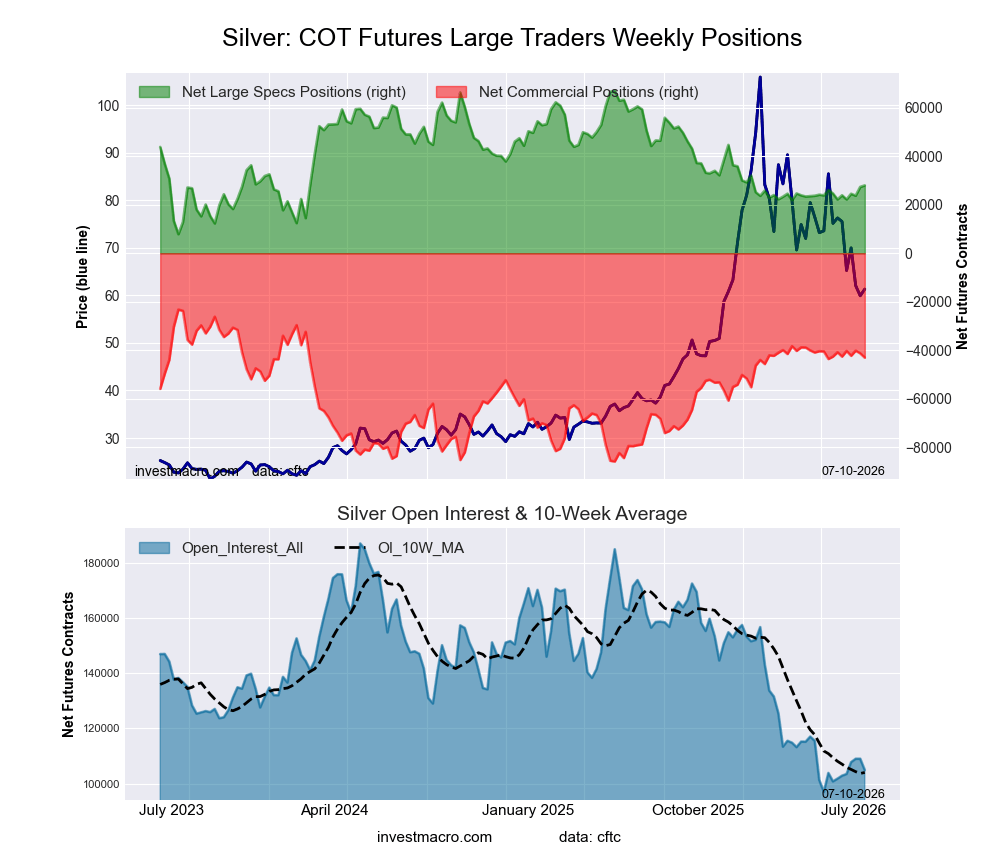
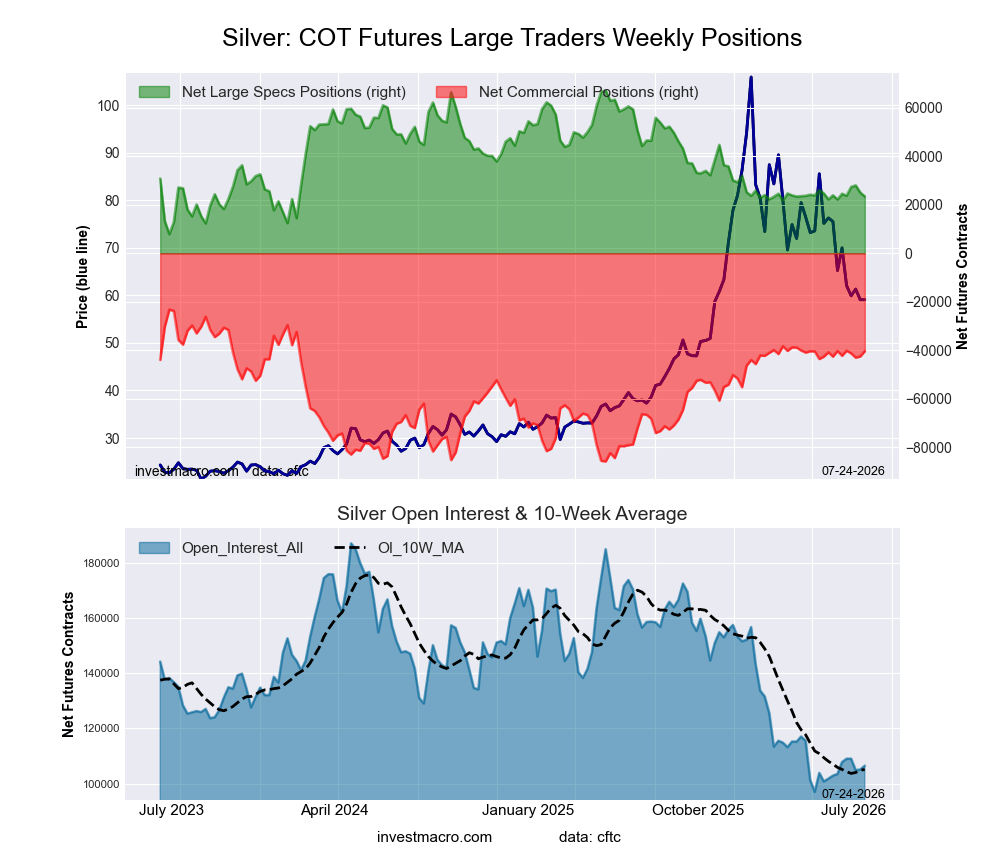
- Silver Comex Futures large speculator standing this week recorded a net position of 23,465 contracts in the data reported through Tuesday.
- Weekly Speculator position decline of -1,609 contracts from the previous week which had a total of 25,074 net contracts.
- This week’s current strength score (range over the past 3 years, measured from 0 to 100) shows the speculators are currently Bearish with a score of 26.3 percent.
- The Commercials are Bullish with a score of 72.6 percent.
- The Small Traders (not shown in chart) are Bearish with a score of 46.2 percent.
Price Trend-Following Model: Strong Downtrend
Our weekly trend-following model classifies the current market price position as: Strong Downtrend.
| Silver Futures Statistics | SPECULATORS | COMMERCIALS | SMALL TRADERS |
| – Percent of Open Interest Longs: | 34.5 | 30.1 | 25.8 |
| – Percent of Open Interest Shorts: | 12.5 | 68.1 | 9.8 |
| – Net Position: | 23,465 | -40,453 | 16,988 |
| – Gross Longs: | 36,741 | 32,050 | 27,461 |
| – Gross Shorts: | 13,276 | 72,503 | 10,473 |
| – Long to Short Ratio: | 2.8 to 1 | 0.4 to 1 | 2.6 to 1 |
| NET POSITION TREND: | |||
| – Strength Index Score (3 Year Range Pct): | 26.3 | 72.6 | 46.2 |
| – Strength Index Reading (3 Year Range): | Bearish | Bullish | Bearish |
| NET POSITION MOVEMENT INDEX: | |||
| – 6-Week Change in Strength Index: | 2.1 | -0.1 | -6.5 |
Copper Grade #1 Futures Futures:
 Positioning Notes:
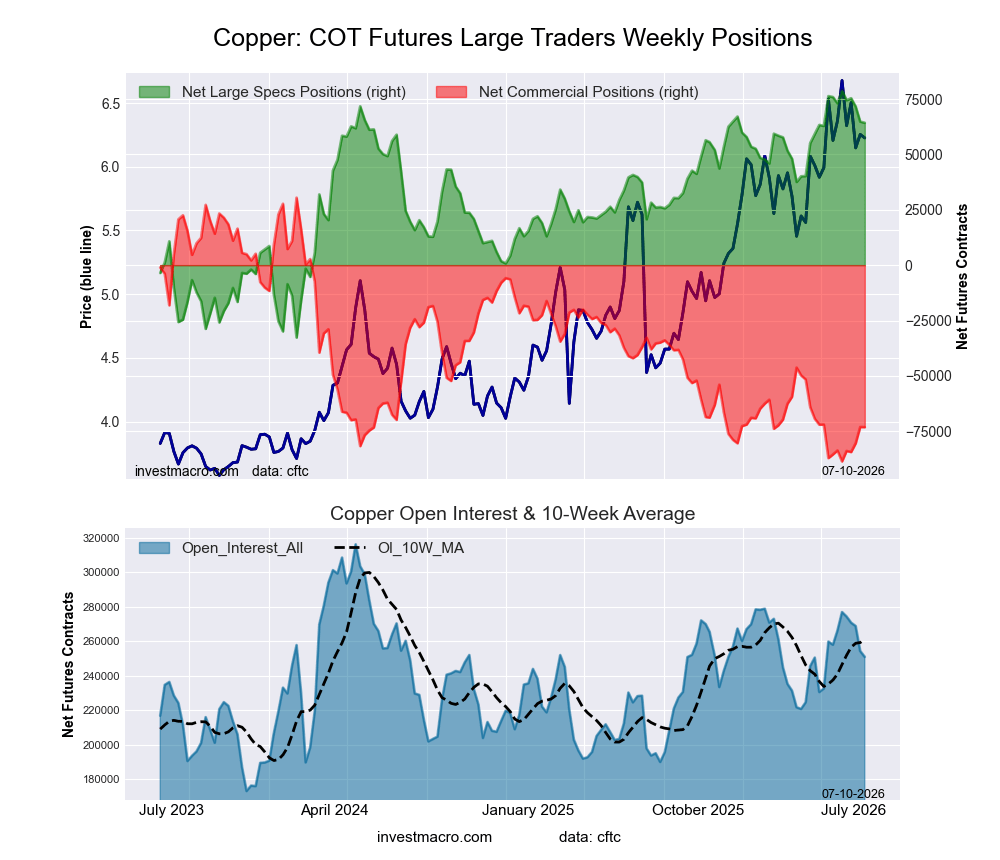
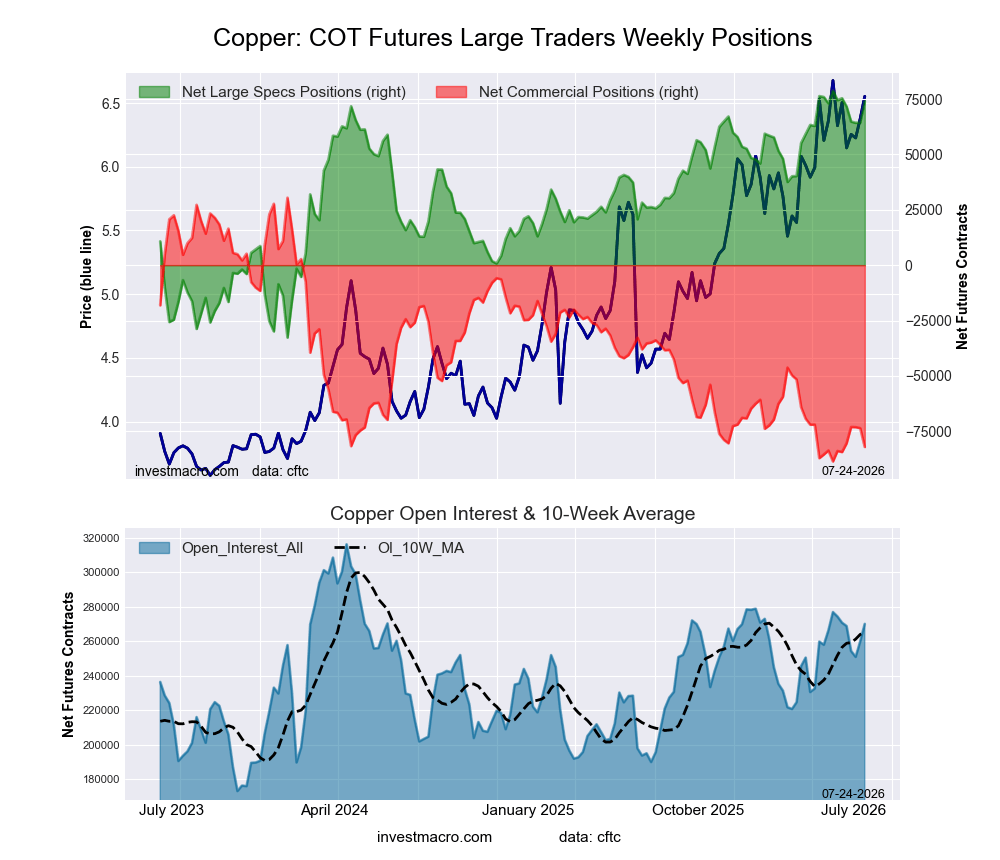
- Copper Grade #1 Futures large speculator standing this week recorded a net position of 73,977 contracts in the data reported through Tuesday.
- Weekly Speculator position increase of 9,592 contracts from the previous week which had a total of 64,385 net contracts.
- This week’s current strength score (range over the past 3 years, measured from 0 to 100) shows the speculators are currently Bullish-Extreme with a score of 95.6 percent.
- The Commercials are Bearish-Extreme with a score of 5.5 percent.
- The Small Traders (not shown in chart) are Bullish with a score of 56.4 percent.
Price Trend-Following Model: Uptrend
Our weekly trend-following model classifies the current market price position as: Uptrend.
| Copper Futures Statistics | SPECULATORS | COMMERCIALS | SMALL TRADERS |
| – Percent of Open Interest Longs: | 40.0 | 31.2 | 7.2 |
| – Percent of Open Interest Shorts: | 12.6 | 61.6 | 4.1 |
| – Net Position: | 73,977 | -82,112 | 8,135 |
| – Gross Longs: | 108,034 | 84,122 | 19,336 |
| – Gross Shorts: | 34,057 | 166,234 | 11,201 |
| – Long to Short Ratio: | 3.2 to 1 | 0.5 to 1 | 1.7 to 1 |
| NET POSITION TREND: | |||
| – Strength Index Score (3 Year Range Pct): | 95.6 | 5.5 | 56.4 |
| – Strength Index Reading (3 Year Range): | Bullish-Extreme | Bearish-Extreme | Bullish |
| NET POSITION MOVEMENT INDEX: | |||
| – 6-Week Change in Strength Index: | -0.4 | 1.5 | -7.0 |
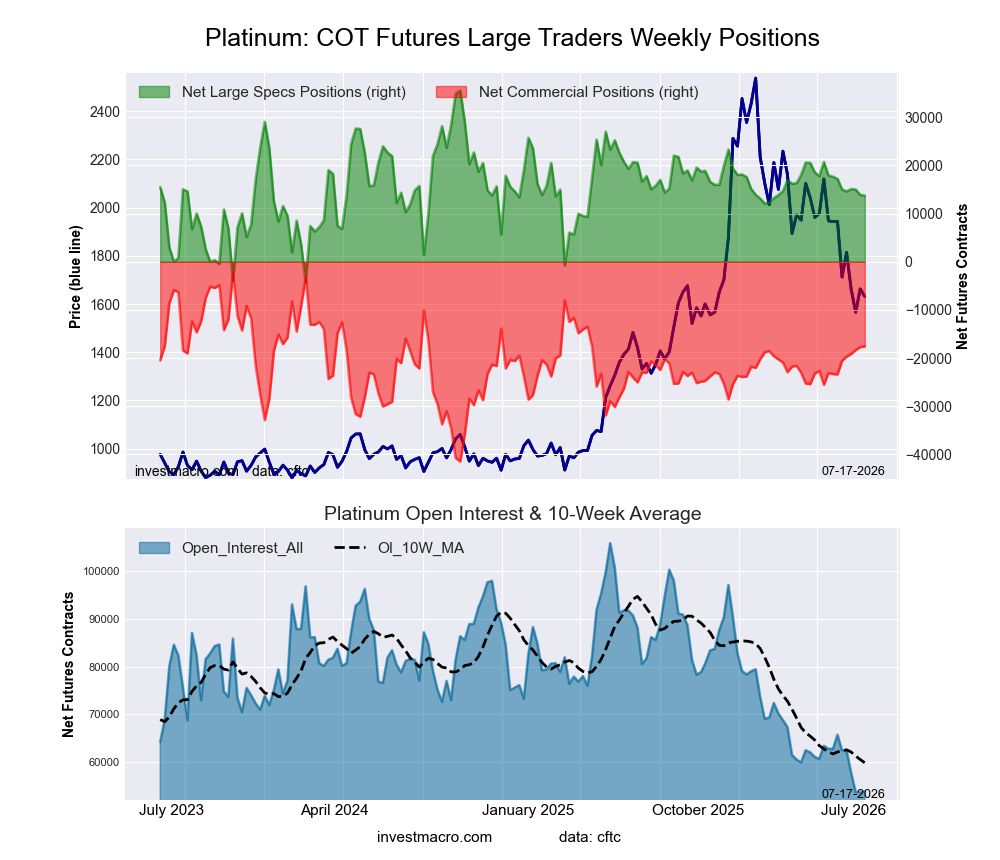
Platinum Futures Futures:
 Positioning Notes:
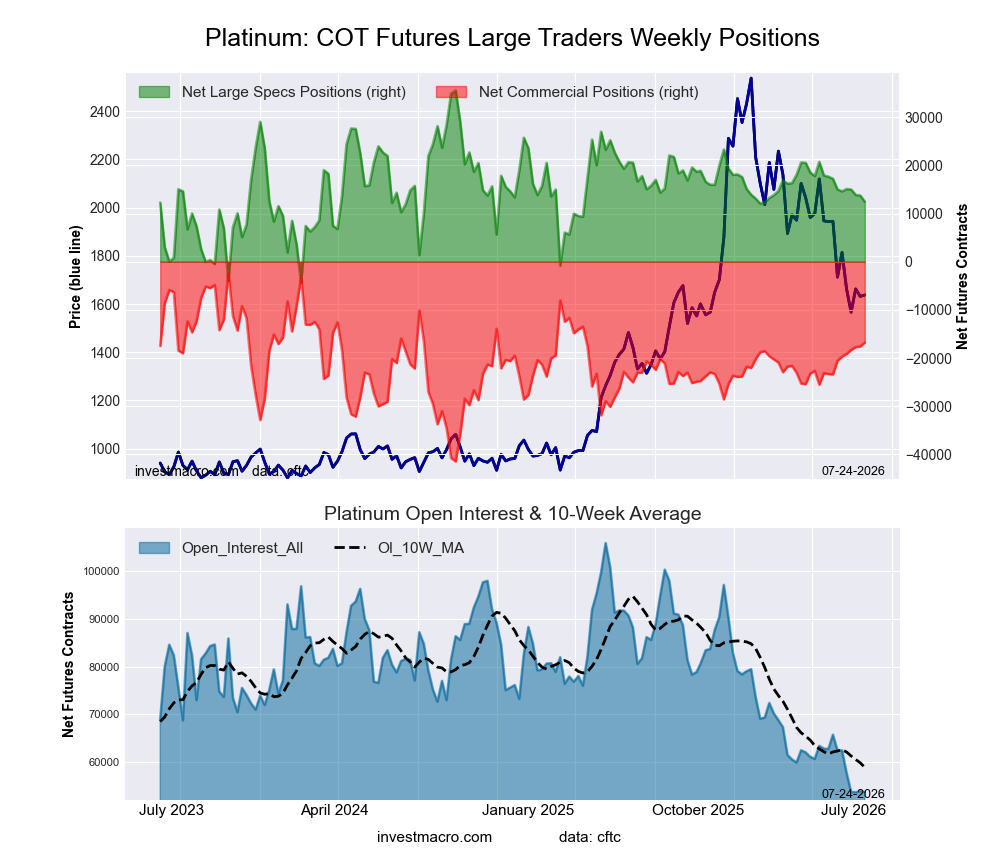
- Platinum Futures large speculator standing this week recorded a net position of 12,484 contracts in the data reported through Tuesday.
- Weekly Speculator position lowering of -1,264 contracts from the previous week which had a total of 13,748 net contracts.
- This week’s current strength score (range over the past 3 years, measured from 0 to 100) shows the speculators are currently Bearish with a score of 42.2 percent.
- The Commercials are Bullish with a score of 63.1 percent.
- The Small Traders (not shown in chart) are Bearish with a score of 48.1 percent.
Price Trend-Following Model: Downtrend
Our weekly trend-following model classifies the current market price position as: Downtrend.
| Platinum Futures Statistics | SPECULATORS | COMMERCIALS | SMALL TRADERS |
| – Percent of Open Interest Longs: | 40.6 | 33.3 | 14.1 |
| – Percent of Open Interest Shorts: | 17.4 | 64.5 | 6.1 |
| – Net Position: | 12,484 | -16,779 | 4,295 |
| – Gross Longs: | 21,807 | 17,892 | 7,594 |
| – Gross Shorts: | 9,323 | 34,671 | 3,299 |
| – Long to Short Ratio: | 2.3 to 1 | 0.5 to 1 | 2.3 to 1 |
| NET POSITION TREND: | |||
| – Strength Index Score (3 Year Range Pct): | 42.2 | 63.1 | 48.1 |
| – Strength Index Reading (3 Year Range): | Bearish | Bullish | Bearish |
| NET POSITION MOVEMENT INDEX: | |||
| – 6-Week Change in Strength Index: | -6.3 | 9.7 | -14.3 |
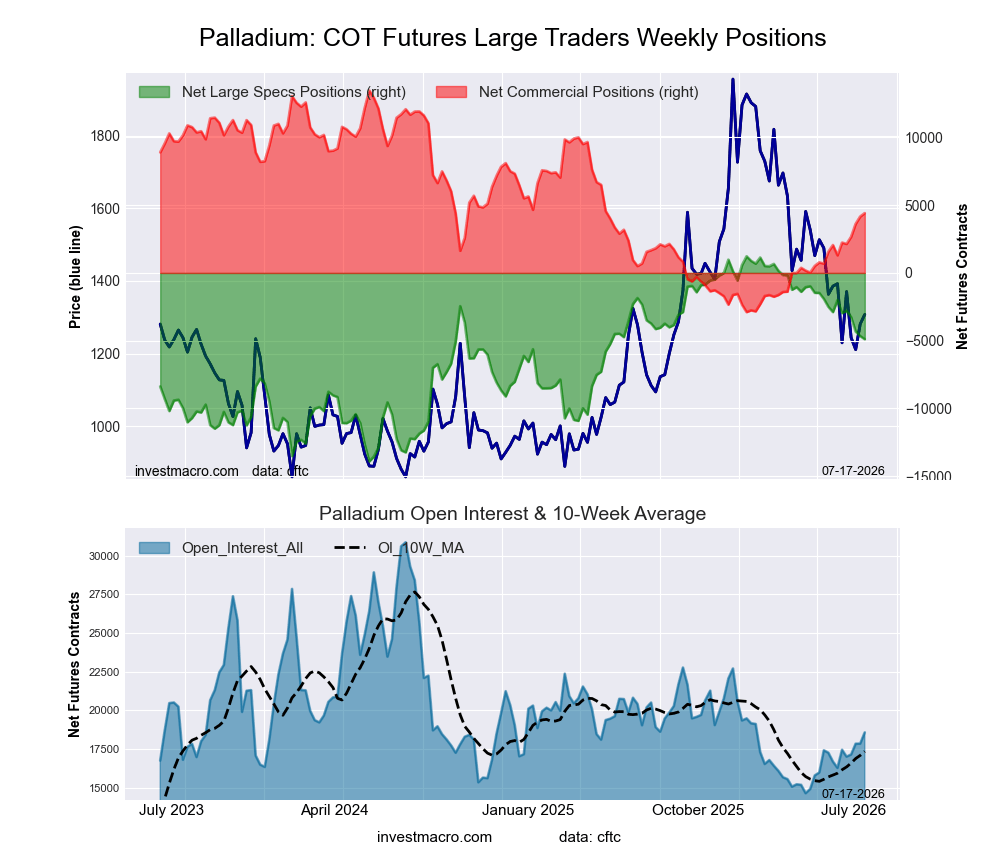
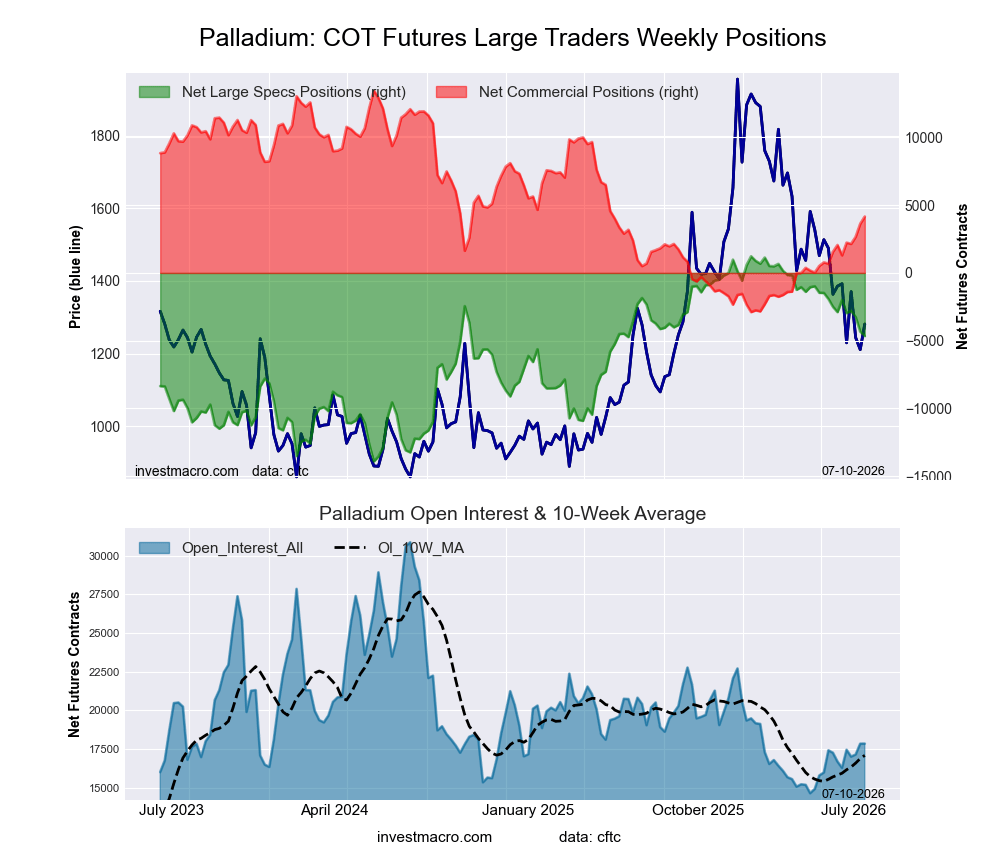
Palladium Futures Futures:
 Positioning Notes:
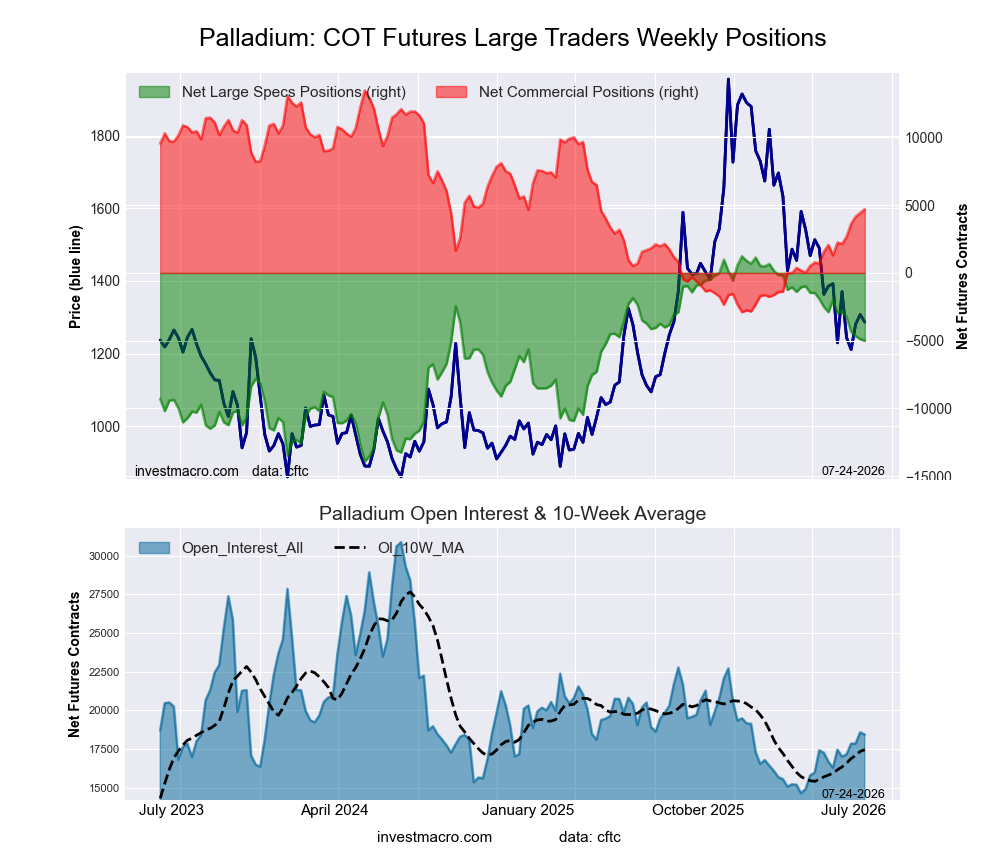
- Palladium Futures large speculator standing this week recorded a net position of -5,003 contracts in the data reported through Tuesday.
- Weekly Speculator position reduction of -114 contracts from the previous week which had a total of -4,889 net contracts.
- This week’s current strength score (range over the past 3 years, measured from 0 to 100) shows the speculators are currently Bullish with a score of 58.9 percent.
- The Commercials are Bearish with a score of 46.4 percent.
- The Small Traders (not shown in chart) are Bearish with a score of 28.9 percent.
Price Trend-Following Model: Downtrend
Our weekly trend-following model classifies the current market price position as: Downtrend.
| Palladium Futures Statistics | SPECULATORS | COMMERCIALS | SMALL TRADERS |
| – Percent of Open Interest Longs: | 36.0 | 47.5 | 11.6 |
| – Percent of Open Interest Shorts: | 63.2 | 22.0 | 10.0 |
| – Net Position: | -5,003 | 4,701 | 302 |
| – Gross Longs: | 6,643 | 8,761 | 2,139 |
| – Gross Shorts: | 11,646 | 4,060 | 1,837 |
| – Long to Short Ratio: | 0.6 to 1 | 2.2 to 1 | 1.2 to 1 |
| NET POSITION TREND: | |||
| – Strength Index Score (3 Year Range Pct): | 58.9 | 46.4 | 28.9 |
| – Strength Index Reading (3 Year Range): | Bullish | Bearish | Bearish |
| NET POSITION MOVEMENT INDEX: | |||
| – 6-Week Change in Strength Index: | -13.5 | 15.1 | -15.0 |
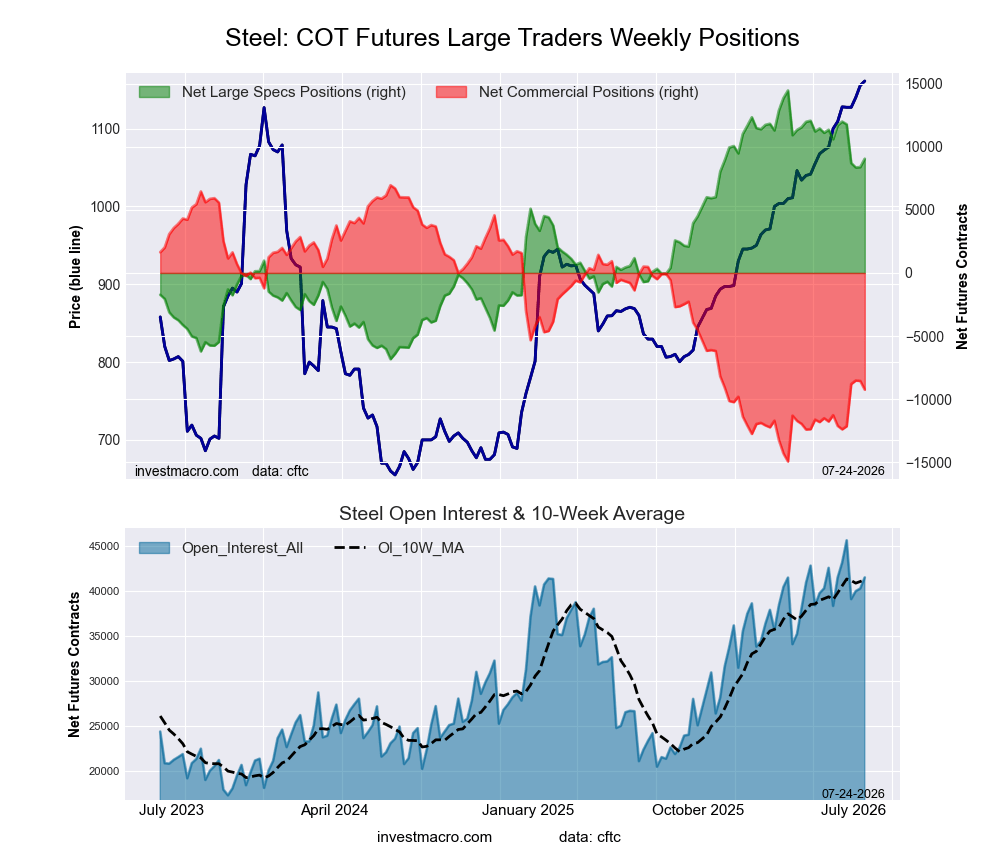
Steel Futures Futures:
 Positioning Notes:
- Steel Futures large speculator standing this week recorded a net position of 9,053 contracts in the data reported through Tuesday.
- Weekly Speculator position increase of 664 contracts from the previous week which had a total of 8,389 net contracts.
- This week’s current strength score (range over the past 3 years, measured from 0 to 100) shows the speculators are currently Bullish with a score of 74.6 percent.
- The Commercials are Bearish with a score of 26.0 percent.
- The Small Traders (not shown in chart) are Bullish with a score of 50.8 percent.
Price Trend-Following Model: Uptrend
Our weekly trend-following model classifies the current market price position as: Uptrend.
| Steel Futures Statistics | SPECULATORS | COMMERCIALS | SMALL TRADERS |
| – Percent of Open Interest Longs: | 28.9 | 64.0 | 0.6 |
| – Percent of Open Interest Shorts: | 7.1 | 86.3 | 0.1 |
| – Net Position: | 9,053 | -9,252 | 199 |
| – Gross Longs: | 12,017 | 26,604 | 252 |
| – Gross Shorts: | 2,964 | 35,856 | 53 |
| – Long to Short Ratio: | 4.1 to 1 | 0.7 to 1 | 4.8 to 1 |
| NET POSITION TREND: | |||
| – Strength Index Score (3 Year Range Pct): | 74.6 | 26.0 | 50.8 |
| – Strength Index Reading (3 Year Range): | Bullish | Bearish | Bullish |
| NET POSITION MOVEMENT INDEX: | |||
| – 6-Week Change in Strength Index: | -12.5 | 13.1 | -22.6 |
Article By InvestMacro – Receive our weekly COT Reports by Email
*COT Report: The COT data, released weekly to the public each Friday, is updated through the most recent Tuesday (data is 3 days old) and shows a quick view of how large speculators or non-commercials (for-profit traders) were positioned in the futures markets.
The CFTC categorizes trader positions according to commercial hedgers (traders who use futures contracts for hedging as part of the business), non-commercials (large traders who speculate to realize trading profits) and nonreportable traders (usually small traders/speculators) as well as their open interest (contracts open in the market at time of reporting).See CFTC criteria here.
All information and opinions on this website and contained in this article are for general informational purposes only and do not constitute investment advice.