Source: Stephen McBride (7/27/26)
Stephen McBride of RiskHedge shares his thoughts on the potential for an AI bubble burst.
Three investors reached out to me this week with an identical query: “Are you concerned?”
In our January edition of Disruption Investor, our primary advisory service, we forecasted that another DeepSeek-like event would rattle Wall Street and cause artificial intelligence (AI) stocks to plummet. This was our key prediction for 2026, and just last week, it materialized.
A Chinese AI laboratory unveiled Kimi K3, a model that equaled the performance of top American models and surpassed them in impartial coding assessments, all at approximately one-third the cost. The most significant aspect? Kimi K3 is an open-source model, eliminating the need for a pricey monthly subscription.
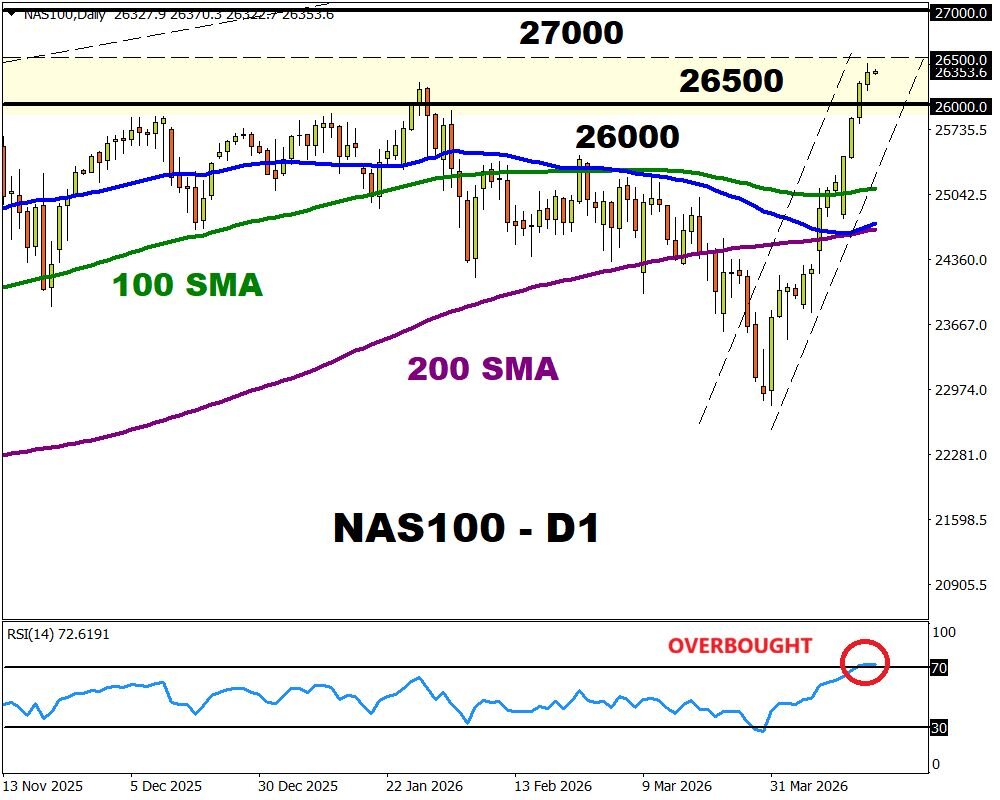
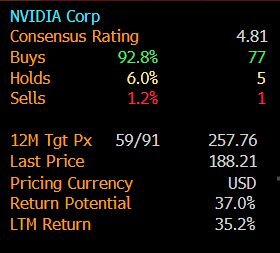
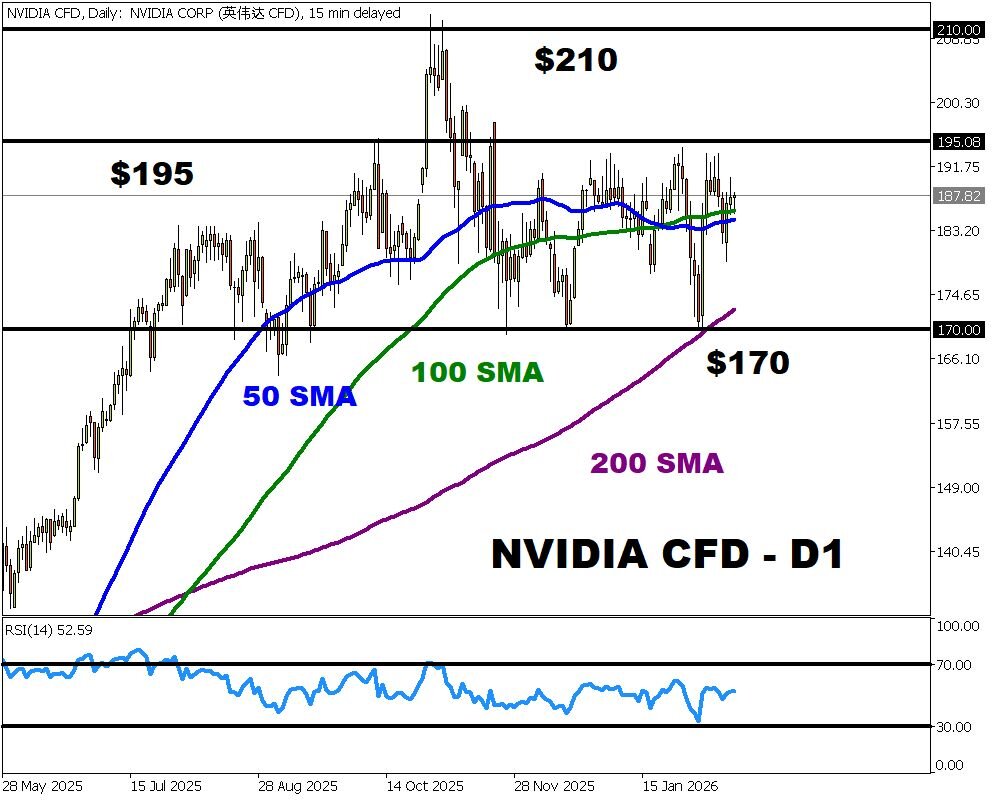
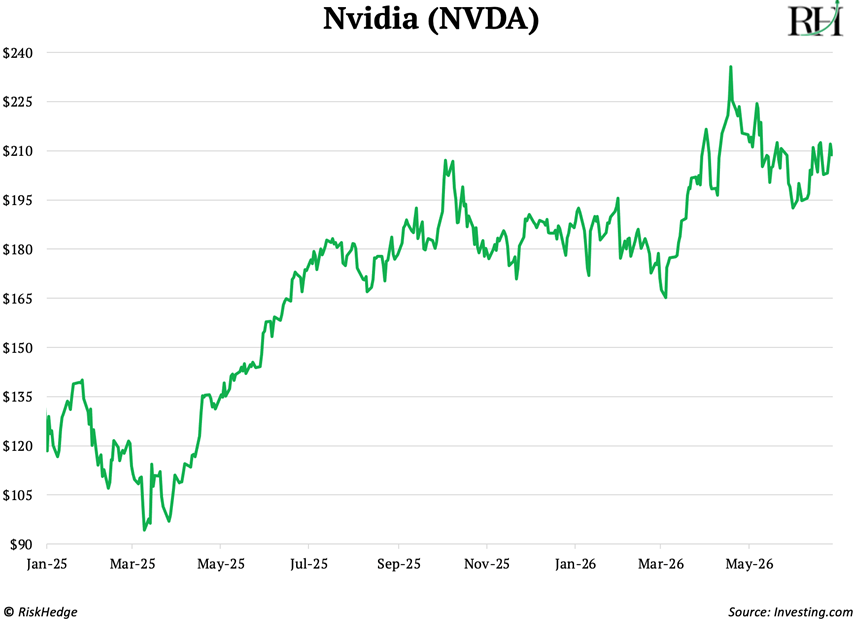
Wall Street reacted swiftly, initiating a sell-off of AI stocks. The well-known Roundhill Memory ETF (DRAM:BATS), which includes memory chip stocks, tumbled over 30% from its peak. CoreWeave (CRWV:NASDAQ), the biggest dedicated AI cloud, saw its value halved. On Friday, Nvidia Corp. (NVDA:NASDAQ) temporarily relinquished its position as the world’s most valuable company to Apple Inc. (AAPL:NASDAQ).
The rationale behind the sell-off is straightforward: if a Chinese laboratory can offer AI for free, no one will pay American labs for it. If AI generates no revenue, the approximately $750 billion that Microsoft Corp. (MSFT:NASDAQ), Alphabet Inc. Class A (GOOGL:NASDAQ), Amazon.com Inc. (AMZN:NASDAQ), and Meta Platforms Inc. (META:NASDAQ) intend to invest in AI infrastructure this year represents the most significant capital waste in history. As a result, investors are offloading chips, data centers, big tech stocks, and anything even tangentially related to AI.
In my opinion, this will prove to be the investors’ costliest blunder in 2026.
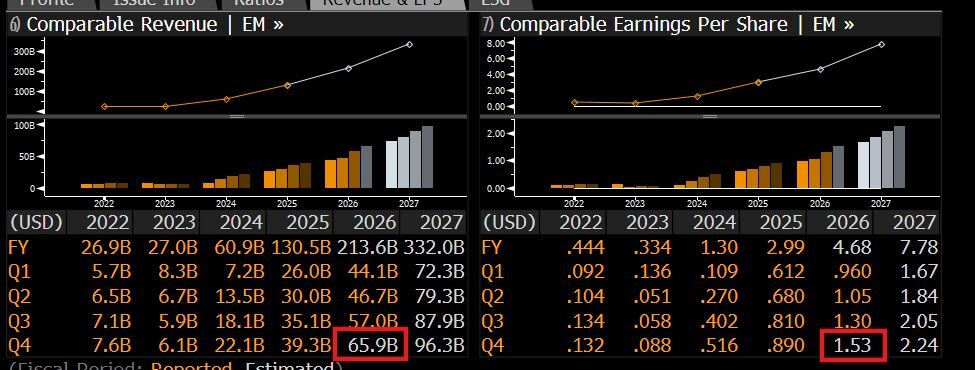
On January 27, 2025, a relatively unknown Chinese laboratory called DeepSeek launched R1, a cutting-edge AI model it claimed to have trained for under $6 million – a pittance compared to the billions American labs were investing. The market deduced that America was drastically overspending on AI. Consequently, Nvidia plunged 17% in a single trading session, shedding $600 billion in market value – the most significant single-day loss for any company in stock market history.
It appeared that the AI spending boom had concluded. Can you predict what transpired next? Nvidia’s revenues more than doubled.
Two years ago, Google processed fewer than 10 trillion tokens per month. Today, that figure stands at 3.2 quadrillion – the equivalent of a dense novel’s worth of AI-generated text for every person on Earth, each month.
Anthropic’s annualized revenue skyrocketed from $1 billion to $47 billion in just 17 months. No company in the history of capitalism has experienced such rapid growth.
Affordable intelligence ultimately propelled AI demand to new heights. If you sold on DeepSeek Monday, you exited the AI trade at the precise moment its fundamentals went vertical.
English economist William Stanley Jevons observed a peculiar phenomenon: as steam engines became significantly more efficient, extracting more work from each lump of coal, coal demand should have decreased. Instead, it surged. Cheaper steam power meant that it suddenly became worthwhile to employ steam power everywhere. The total amount of coal consumed increased rather than decreased.
The same phenomenon occurred with light. LED bulbs reduced lighting costs by approximately 90%, leading us to illuminate everything.
Economists refer to this as the Jevons Paradox. When a useful commodity becomes cheaper, the world discovers a multitude of new applications for it and spends more.
The same applies to AI.
In late 2022, GPT-4-level intelligence cost around $20 per million tokens. Today, that same level of intelligence costs a mere 40 cents! Did AI spending decrease? No.
Uber Technologies Inc.’s (UBER:NYSE) CTO recently admitted that the company exhausted its entire 2026 AI budget in just four months. Each Uber engineer now incurs $500–$2,000 per month in AI expenses. Apple allows engineers to spend $300 per day on tokens. The most AI-intensive companies currently spend $7,500 per employee every month on AI.
I’m personally investing over $200 per month on Claude, and it’s worth every cent.
This is the Jevons Paradox in action. The more affordable AI becomes, the more we utilize it.
Kimi K3 may be open-source, but running it still necessitates costly data centers equipped with Nvidia GPUs and high-bandwidth memory from companies like Micron Technology (MU). It also requires megawatts of electricity to power everything. Starting Monday, Kimi K3’s “recipe” will be freely available for download. However, the “kitchen” needed to run it – 1.5 terabytes of scarce high-bandwidth memory across racks of Nvidia GPUs – is not.
Don’t just take my word for it. Within days of launching K3, the company behind it, Moonshot, stopped accepting new members. Why? It ran out of GPUs. The lab that just “killed” demand for AI can’t secure enough compute resources to support its own free model.
So, no, I’m not concerned about this sell-off.
I’m approaching it the way DeepSeek should have been approached: as an opportunity. A chance to acquire the toll roads of the AI boom at discounted prices – the bottlenecks that get paid regardless of which model tops the leaderboard.
Compute. Power. Memory. Chip-making machines. And all the other vital layers of AI infrastructure we’re investing in through Disruption Investor and Disruption_X.
I recommend you do the same. If you liked this, please consider joining my free investing letter, The Jolt, here.
Important Disclosures:
- As of the date of this article, officers, contractors, shareholders, and/or employees of Streetwise Reports LLC (including members of their household) own securities of Alphabet Inc. Class A, Nvidia, Amazon.com Inc., and Apple Inc.
- Stephen McBride: I, or members of my immediate household or family, own securities of: None. My company has a financial relationship with: None. My company has purchased stocks mentioned in this article for my management clients: None. I determined which companies would be included in this article based on my research and understanding of the sector.
- Statements and opinions expressed are the opinions of the author and not of Streetwise Reports, Street Smart, or their officers. The author is wholly responsible for the accuracy of the statements. Streetwise Reports was not paid by the author to publish or syndicate this article. Streetwise Reports requires contributing authors to disclose any shareholdings in, or economic relationships with, companies that they write about. Any disclosures from the author can be found below. Streetwise Reports relies upon the authors to accurately provide this information and Streetwise Reports has no means of verifying its accuracy.
- This article does not constitute investment advice and is not a solicitation for any investment. Streetwise Reports does not render general or specific investment advice and the information on Streetwise Reports should not be considered a recommendation to buy or sell any security. Each reader is encouraged to consult with his or her personal financial adviser and perform their own comprehensive investment research. By opening this page, each reader accepts and agrees to Streetwise Reports’ terms of use and full legal disclaimer. Streetwise Reports does not endorse or recommend the business, products, services or securities of any company.
For additional disclosures, please click here.