A secretive legal system lets fossil fuel investors sue countries over policies to keep oil and gas in the ground – podcast

By Gemma Ware, The Conversation and Daniel Merino, The Conversation 

A new barrier to climate action is opening up in an obscure and secretive part of international trade law, which fossil fuel investors are using to sue countries if policy decisions go against them.

In this episode of The Conversation Weekly podcast, we speak to experts about the investor-state dispute settlement (ISDS) mechanism and how it works. Many are worried that these clauses in international trade deals could jeopardise global efforts to save the climate – costing countries billions of dollars in the process.

ISDS clauses were first introduced into international trade agreements in the post-colonial period. Most of these treaties were between a developed and a developing country. “It was really intended in the first instance to protect the interests of multinational companies from the global north when they were operating in these newly decolonised parts of the world,” explains Kyla Tienhaara, an expert in ISDS and environmental governance at Queen’s University in Ontario, Canada.

Yet Tienhaara says the use of ISDS has “morphed beyond all recognition” of the treaties’ original intentions, due to what she calls “creative lawyering” and the fact the system is stacked in favour of investors and against governments.

A looming concern is the chilling effect these clauses could have on countries’ decisions to phase out fossil fuels or take other action to protect the environment if investors decide to sue for compensation. In April, a summary report by the UN’s Intergovernmental Panel on Climate Change singled out ISDS clauses saying that they may “limit countries’ ability to adopt trade-related climate policies” and stick to their commitments under the 2015 Paris agreement.

In a recent study, Tienhaara and her colleagues estimated that countries could face up to US$340 billion in financial and legal risk from cancelling fossil fuel projects covered by ISDS clauses.

Some countries are more vulnerable than others because of the nature of the contracts they’ve entered into. Mozambique, with its large gas and coal reserves, is particularly so, explains Lea Di Salvatore, a PhD candidate at Nottingham University in the UK.

She analysed 29 of the country’s mega-projects for gas, coal and hydrocarbons and found that the vast majority are covered by ISDS clauses. This means that “the company can directly go and initiate an arbitration against Mozambique”, she says, if it feels a government policy has negatively affected its investment.

We hear what it’s like inside one of these arbitration rooms from Emilia Onyema, a professor of international commercial law at SOAS, University of London in the UK. “It’s a private process,” she explains. “The parties determine who the arbitrator is. They appoint the arbitrator. They pay the arbitrator. So they have more powers over the process than they would have in litigation.”

And we tell the story of one ISDS case launched against Italy by the British oil company, Rockhopper Exploration. In 2016, Italy banned oil drilling 12 nautical miles off its coast, which blocked Rockhopper’s exploration of the offshore Ombrina Mare field in the Adriatic Sea. Maria-Rita D’Orsogna, a US-based mathematician and leading campaigner against oil exploration in Abruzzo, explains what was at stake and what happened next.

Listen to the whole episode on The Conversation Weekly to find out about the fight back against ISDS, including moves to reform a big international trade treaty covering the fossil fuel industry and what countries are doing to limit their risk from ISDS climate arbitration.

This episode was produced by Gemma Ware and Mend Mariwany, with sound design by Eloise Stevens. The executive producer was Gemma Ware. Our theme music is by Neeta Sarl.

You can find us on Twitter @TC_Audio, on Instagram at theconversationdotcom or via email. You can also sign up to The Conversation’s free daily email here. A transcript of this episode will be available soon.

You can listen to “The Conversation Weekly” via any of the apps listed above, download it directly via our RSS feed, or find out how else to listen here.The Conversation

About the Author:

Gemma Ware, Editor and Co-Host, The Conversation Weekly Podcast, The Conversation and Daniel Merino, Assistant Science Editor & Co-Host of The Conversation Weekly Podcast, The Conversation

This article is republished from The Conversation under a Creative Commons license. Read the original article.


 

The panic narrative is returning to the stock markets. The focus today is on a non-farm report

By JustForex

The US 10-year bond yields rose nearly 10 basis points to 3.85% after Minneapolis Fed President Neel Kashkari said yesterday that the central bank is “very far” from suspending its tightening campaign. Kashkari’s comments followed a series of hawkish remarks from other officials. Federal Reserve Bank of Chicago President Charles Evans said Thursday that the US Central Bank’s discount rate is likely to reach 4.5-4.75% by the spring of 2023 as the Fed increases the cost of borrowing to reduce too much inflation. A day earlier, San Francisco Federal Reserve President Mary Daly said that investors are wrong to anticipate monetary policy easing in 2023. Such hawkish rhetoric brought negativity back to the financial markets, which triggered some sell-off in stocks.

At the close of the stock market yesterday, the Dow Jones Index (US30) decreased by 1.15%, and the S&P 500 Index (US500) fell by 1.30%. Tech Index NASDAQ (US100) closed the day down by 0.35%. At the Fed meeting in November, money markets are pricing in a more than 85% chance of a fourth straight 75 basis point rate hike.

Today, the main focus for investors will be on the US labor market data. If the report turns negative, it could trigger a drop in the dollar index and a rise in stock indices on expectations that the US Federal Reserve will be less aggressive in tightening monetary policy further. But if the non-farm payrolls report is positive and shows the strength of the labor market, the opposite reaction could follow a sell-off in the stock market plus an increase in the dollar index and treasury yields. Weekly labor market data showed that the number of Americans filing new jobless claims rose more than expected last week, but the labor market remains strong even as demand declines amid higher interest rates.

Stock markets in Europe were mostly down yesterday. German DAX (DE30) decreased by 0.37%, French CAC 40 (FR40) fell by 0.82%, Spanish IBEX 35 (ES35) lost 0.92%, British FTSE 100 (UK100) closed down by 0.78%.

The report on the ECB’s September 7-8 monetary policy meeting released yesterday showed that an absolute majority approved a 75 basis point rate hike of the Governing Council. The report also indicated that in the medium term, a 50 basis point hike would be part of a sustainable path toward more neutral rate levels, and such a dynamic would be sufficient to alleviate inflationary pressures and not “drop” the economy deep into recession. But all inflation forecasts for 2023 and 2024 have been revised upward.

In August 2022, seasonally adjusted retail sales were down by 0.3% in the Eurozone. Retail sales also declined by 0.4% in July. This is negative data, which indirectly points to high inflationary pressures.

Oil prices rose about 1% on Thursday, holding at a three-week high after OPEC+ agreed to cut global supply by 2 million BPD, the biggest cut since 2020. Saudi Arabia’s energy minister said the real supply cut would be 1 million to 1.1 million BPD. Experts believe that such a move by OPEC+ will not only boost oil prices but also cause a new round of unwinding inflation, which central banks around the world are actively fighting.

Asian markets traded flat yesterday. Japan’s Nikkei 225 (JP225) gained 0.70%, Hong Kong’s Hang Seng (HK50) decreased by 0.42%, and Australia’s S&P/ASX 200 (AU200) ended the day up by 0.03%.

A report released Thursday by the Bank of Japan (BOJ) indicates that most regional economies in Japan are seeing a moderate rebound, with some firms considering wage increases, stressing the hope that household incomes will rise enough to offset rising costs of living.

OPEC+ will no longer meet monthly. Meetings will now be held every two months.

S&P 500 (F) (US500) 3,744.40 −38.88 (−0.20%)

Dow Jones (US30) 29,926.47 −347.40 (−1.15%)

DAX (DE40) 12,470.78  −46.40 (−1.21%)

FTSE 100 (UK100) 6,997.27 −55.35 (−0.78)

USD Index 112.22 +1.14 (+1.02%)

Important events for today:
  • – US FOMC Member Waller Speaks (m/m) at 00:00 (GMT+3);
  • – US FOMC Member Mester Speaks (m/m) at 01:30 (GMT+3);
  • – German Industrial Production (m/m) at 09:00 (GMT+3);
  • – US Nonfarm Payrolls (m/m) at 15:30 (GMT+3);
  • – US Unemployment Rate (m/m) at 15:30 (GMT+3);
  • – Canada Unemployment Rate (m/m) at 15:30 (GMT+3);
  • – US FOMC Member Williams Speaks (m/m) at 17:00 (GMT+3).

By JustForex


This article reflects a personal opinion and should not be interpreted as an investment advice, and/or offer, and/or a persistent request for carrying out financial transactions, and/or a guarantee, and/or a forecast of future events.

Week Ahead: Gold’s presence above $1700 may depend on US inflation data

By ForexTime

Markets have of late dared to revive bets over a “dovish pivot” by the Fed, which has helped gold prices recover back above $1700 this week.

However, whether such a recovery can be sustained over the immediate term may all boil down to the upcoming US inflation data release (and also the US jobs report due later today – Friday, October 7th).

For the week ahead, here are the key scheduled economic data releases and events that could move markets:

Monday, October 10

  • USD: Speeches by Fed Vice Chair Lael Brainard and Chicago Fed President Charles Evans
  • EUR: Speeches by ECB Chief Economist Philip Lane and Banco de Portugal Governor Mario Centeno

Tuesday, October 11

  • JPY: Japan August trade balance and current account
  • AUD: Australia September household spending and business confidence, October consumer confidence
  • IMF publishes World Economic Outlook
  • EUR: ECB Chief Economist Philip Lane speech
  • GBP: BOE Governor Andrew Bailey speech, UK August 3-month unemployment rate, September jobless claims
  • USD: Cleveland Fed President Loretta Mester speech
  • Meta Platform’s virtual conference

Wednesday, October 12

  • EUR: ECB President Christine Lagarde speech, Eurozone August industrial production
  • GBP: UK August monthly GDP, industrial production, trade balance
  • GBP: Speeches by BOE’s Jonathan Haskel, Catherine Mann, and Huw Pill
  • Brent: OPEC publishes Monthly Oil Market Report
  • USD: US September PPI, FOMC minutes, speeches by Fed Governor Michelle Bowman, Minneapolis Fed President Neel Kashkari

Thursday, October 13

  • JPY: Japan September PPI
  • AUD: Australia October consumer inflation expectations
  • EUR: Germany September CPI (final)
  • Brent: IEA publishes Oil Market Report
  • US crude: EIA weekly oil inventory report
  • USD: US September CPI, US weekly initial jobless claims

Friday, October 14

  • NZD: New Zealand September manufacturing PMI
  • CNH: China September CPI, PPI, external trade
  • GBP: BOE due to end its emergency bond buying
  • USD: US September retail sales, October consumer sentiment
  • CAD: Canada August manufacturing sales, September existing home sales
  • S&P 500: US earnings season begins with Wall Street banks (JPMorgan, Wells Fargo, Citigroup, Morgan Stanley)


At the time of writing, although gold has managed to clamber back above the psychologically-important $1700 mark, prices have been resisted at the 50-day simple moving average (SMA) and have since eased slightly.


And the next US inflation data, as measured by the consumer price index (CPI), could dictate gold’s next big move.

Markets are currently expecting the September headline US CPI to have risen by 8.1% compared to the same month last year (September 2021).

If so, that would mark a third consecutive month whereby the headline CPI figure has eased lower since June’s 9.1% – the highest CPI year-on-year print in over 40 years!

A lower-than-expected headline CPI print this coming Thursday may embolden the “dovish pivot” narrative (which is to say that markets expect the Fed to have less impetus to keep US interest rates higher for longer on signs that US inflation has peaked).


If so, that lower-than-8.1% CPI figure may help push gold even higher:

  • If the 50-day SMA isn’t already breached in the immediate aftermath of today’s US jobs report, then that would be another key area of interest for bullion bulls.
  • Markets are rather pessimistic about spot gold’s chances of hitting the psychological $1800 mark, allocating a mere 5.6% chance of such an event happening over the next one week.
  • However, a shockingly-low CPI print may just do the trick for gold bulls (those hoping gold prices can keep marching higher).


A higher-than-8.1% CPI print on Thursday however may dash gold’s recent recovery:

  • Gold may well falter back below $1700 (if it hasn’t already done so following today’s NFP print). However, markets are relatively cautious about such prospects (gold falling below $1700 over the next week), with such odds now standing at just 38%, given that the US jobs report remains a massive unknown.
  • Immediate support may arrive around the $1680 mark (July low, also where spot gold’s 21-day SMA currently resides).
  • Stronger support may arrive around the mid-$1600 region, as was the case around mid-September.

Forex-Time-LogoArticle by ForexTime

ForexTime Ltd (FXTM) is an award winning international online forex broker regulated by CySEC 185/12 www.forextime.com

XLU Utilities ETF decreased by -2.85 percent – October 06 2022

By InvestMacro.com | #stocks #XLU #utilities

Utilities Select Sector SPDR Fund End of Day Update: October 06 2022

The Utilities Select Sector SPDR Fund (XLU) ETF finished the day with a fall of -2.85 percent and closed the day not too far off the lows of the day near the 65.41 price level, according to unofficial data at the New York close.

The XLU, an ETF that tracks the SP500 Utilities Select Sector Index, opened the day trading at 67.04 with the high of the day being 67.15 and the low of the day at 65.32.

XLU has recently fallen below the 200-day moving average and has seen a deep descend after hitting a recent high over $78.00 in the middle of September.

XLU Utilities ETF decreased by -2.85 percent

The XLU RSI level is Bearish

The Relative Strength Index, an indicator that can indicate overbought (above 70) and oversold levels (below 30), shows that the current RSI score is at 31.0 for a Bearish reading on the daily time-frame.

XLU has fallen by -9.90 percent over the past 10 days while seeing a decrease by -14.41 over the past 30 days

XLU Price Trends

The XLU has fallen by -9.90 percent over the past 10 days while seeing a decrease by -14.41 over the past 30 days. The 90-day change is -12.52 while the 180-day return and the 365-day return are -3.64 and 3.40, respectively.

By investmacro.com

AGNC Stock today fell by -2.18 percent, RSI Oversold – October 06 2022

By InvestMacro.com | #stocks #AGNC #REIT #mortgage

AGNC Investment Corp. End of Day Update: October 06 2022

The AGNC Investment Corp. (AGNC) stock finished the day with a slide of -2.18 percent, closing the day around the 8.315 price level, according to unofficial data at the New York close.

AGNC, a Real Estate Investment Trust (REIT) that specializes in mortgage-backed securities, opened the day trading at 8.49 with the high of the day being 8.555 and the low of the day at 8.1.

AGNC, like most REITs, has been on a downtrend due to higher interest rates and trades well below its 20-day and 200-day moving averages. Today’s drop marked the lowest trading level since the pandemic low in March of 2020.

The AGNC RSI level is Bearish-Oversold

The Relative Strength Index, an indicator that can indicate overbought (above 70) and oversold levels (below 30), shows that the current RSI score is at 23.2 for a Bearish-Oversold reading on the daily time-frame.

AGNC Price Trends

The AGNC is now down by -22.79 percent over the past 10 days while seeing a fall by -32.28 over the past 30 days. The 90-day change is -29.82 while the 180-day return and the 365-day return are -40.35 and -46.38, respectively.


By investmacro.com

Expert Says, ‘Watch US 10-Year Treasury Yield as Your Night Sextant’

Provided by streetwisereports.com

Michael Ballanger Expert Michael Ballanger takes a moment to review current updates in the stock market, including the position of gold, the current Fed mandate, the outlook of Getchell Gold Corp., and the Nord Stream Gas Pipelines.I open this week’s missive with a repeat of my Wednesday evening Email Alert:

“Despite yesterday’s pop, I expect that collateral and margin calls are going to keep stocks under pressure right through month-end, but there is little doubt that yesterday’s outside reversal day (defined by a real technical analyst David Chapman as “a two-day pattern is observed in which a security’s high and low prices for the day exceed the high and low of the previous day’s trading session.”) was a major bullish event.

We had a positive outside day for gold and stocks and a negative outside day for the UST 10-year yield, and while these cannot be discounted, the headline shown above may be a portent of an impending shift in Fed policy. The reason for this lies in my “pigs in the barnyard” analogy regarding money managers and the banks from whom they obtain leverage.

With yields so compressed over the past decade, many pension funds have been forced to implement large dollops of leverage in order to squeeze out a minimum 8% return to pensioners. In the case of the British gilts (10-year sovereign bonds), they sported a negative yield late last year and are now over 4%. The destruction to bond portfolios overweighted in these gilts must be enormous, but when you stack leverage on top of the losses, it is no wonder that the Bank of England had to step up and take on billions of pounds worth of paper lest the entire U.K. banking system become vaporized.

Now, returning to the “pigs in the barnyard,” when you gaze upon a herd of pigs in a barnyard, there will be pink pigs and mottled grey and brown pigs and black and white pigs and, of course, brown pigs, but when the farmer’s wife clangs the triangle with her ladle, all those pigs sidle up to the trough together.

In the same manner, the banks, hedge funds, and pension funds all feed at the same trough, so when I read that the BOE had to step in and buy gilts when their stated intent is to sell gilts as part of the globally-led (read: “Fed-Ordered”) quantitative tightening (“QT”) operation designed to curb inflation, you can bet that there are also American and Canadian and a boatload of European and Asian entities leveraged to the nines in government debt whose face value has been crushed in 2022.

So as refreshing as the rally on Wednesday was, we have three more full trading sessions before the month comes to a close. If the lows hold by Friday at 4:00 p.m. EST, then there is a strong probability of a tradable rally in risk-on assets, which includes precious metals and commodities.

However, if calls for additional collateral accelerate and this liquidity-starved financial environment persists, there remains a significant risk that one of the other highly-leveraged pension or hedge funds tip the boat over again.

The Fed’s dual mandate includes maximum full employment and price stability with the current focus on the latter, but there is only one condition that countermands the dual mandate, and that condition is “financial system stability,” and what happened with those British gilts is that very condition.

Margin calls are the ultimate form of financial contagion, so to say that we are at a critical inflection point is an understatement.

Watch the Fed like a hawk for signs of dovish rhetoric or an overt acknowledgment of stresses finally arriving on Wall Street. The “pivot” only occurs if the Fed’s owners, the big U.S. banks that have been feeding at the same leverage trough as their British counterparts, start getting collateral calls.

Then, and only then, will it be safe to go in the water again. . .”

Coast Not Clear

I sent out that missive at 9:22 a.m. (pre-opening Thursday) to make the emphatic point that “the coast” was not exactly “clear.” Eight minutes later, stocks opened down and proceeded to completely erase the near-600-point advance in the Dow and, at one point, were at new lows for the year.

“Fade every rally until the Fed goes officially neutral-positive. . .” I tweeted out a few weeks back, and Thursday’s crushing reversal confirmed that advice, all a function of the most significant four-letter-word in the history of modern markets: Debt.

Truly the only collateral is gold.

I launched my advisory service in January of 2020 with the GGMA 2020 Forecast Issue and proceeded to offer the premise that the ultimate arbiter of all pricing structures would eventually be determined by the value of the collateral held by those that control the currency.

Since the treasury departments of most sovereign nations control the collateral and since the central banks are the entities that extend credit to the treasuries, then the collateral that coerces people to believe in the “Full Faith and Credit” of government must be related to a higher mark.

That collateral, and truly the only collateral, is gold.

Gold, Gold, Gold

In that piece written by and large in the fourth quarter of 2019, I provided a chart illustrating how much-maligned nations like Italy and Russia were actually more solvent than the United States.

Dividing the national debt by the value of their stated central bank or treasury holdings, Russia (thanks largely to the art of default in 1998) had the lowest national-debt-to-gold ratio of any country on the planet, while resource-rich Canada had the highest — as in infinity — because there was then and exists today zero gold at the Bank of Canada nor anywhere close to the Royal Canadian Mint.

Gold enthusiasts have been eating the exhaust fumes of the mainstream media since 2011, and I suspect that with the events in the U.K. this week, a huge regime change is about to arrive.

As a commodity-rich country anchored by the Rule Of Law, I find that an astounding act of national embarrassment. It is funny how generational hardship affects behavior but also comprises the bulk of the wisdom passed down from grandfather to father to son, which amplifies one’s attention to the causes of said hardship.

My mother was taught by her mother never to throw away day-old bread because it had great healing powers in the mold. My father was told by his grandmother to “avoid debt at all costs” because of the farm they lost to foreclosure in Saskatchewan in the 1930s, which prompted my father to avoid taking on debt when a piece of land located at the mouth of the Credit River on Lake Ontario became available for US$2,500.

It is easy to chastise those that opted for conservation over speculation, but it all falls under the category of “right time, right place,” and there is no better time than the present to truly appreciate this truism.

Ask the cryptojunkies to take out ads beseeching us to “sell your gold and buy crypto!” back in 2021.

Gold enthusiasts have been eating the exhaust fumes of the mainstream media since 2011, and I suspect that with the events in the U.K. this week, a huge regime change is about to arrive.

The Fed Mandate

The chart shown above is a perfectly-timed illustration of what happens when bubbles crack wide open and spill the hopes and dreams of a generation onto an odious and steaming sidewalk.

Sexagenarians like me know how the twin demons of government profligacy and mainstream media deception combine to mold investor optimism to a predetermined advantage, all while unelected and very powerful quasi-government officials milk the system largely insulated from either the forces of moral suasion or penal scrutiny.

Is it any coincidence that the stock market was rolling along “just fine” until Fed governors Kaplan, Rosengren, and Clarida were all caught front-running Fed decisions?

Shortly thereafter, the Fed mandate shifted, and once the Wall Street traders finally received and actually read the memo, they finally sold their positions, got shot, and then pulled every bid imaginable until the bear market finally arrived.

Now, we are in a full-blown bear market in every single asset class in existence which is what occurs when the management of currency moves from the ridiculous to the sublime.

Here is a brief pecking order of how households manage their monthly income. Dad and Mom pool their paycheques into a joint account. Nothing gets withdrawn until rent (or mortgage), groceries, utilities, loans (auto, credit cards, etc.) Dad then has to ask Mom if he can grab a few quid to hit the track with “the boys.”

Knowing full well that she will have a resentful and ungrateful hubby if she refuses, she gives him a few quid and then cancels her hair appointment because her three sons need shoes, and there is a dental appointment for one of them that surely is not covered by anything other than the piggy-bank up behind the fridge.

Shortly thereafter, the Fed mandate shifted, and once the Wall Street traders finally received and actually read the memo, they finally sold their positions, got shot, and then pulled every bid imaginable until the bear market finally arrived.

These are the challenges of the average working family.

Now, contrast that with the political class that preaches climate change and “Tax the Rich” while they sip champagne in the front section of the aircraft taking them to Davos for a “Climate Change Conference” as the chartered jet spews out more carbon crossing the Atlantic than a coal-carrying steamer in the 1920s.

They will then be police-escorted (at taxpayer expense) to a five-star hotel, where they will sip more champagne and scarf down Beluga Caviar (of Russian origin) while debating how to free the Ukrainians from Putin’s aggression.

This entire farce confronting the world we face today is a function of public apathy and voter ambivalence to issues that once appeared trivial but which have now metamorphosed in combination and coincident with staccato-like repetition into a leviathan-sized problem.

And it all arrives around the fact that while Mom and Dad cannot ask their banker to increase their credit lines to pay for my little brother’s tuition, the politicians can legislate without recourse any amount they so choose with no entity empowered to say “HALT!” and order House Arrest.

Whether the politicians are Liberal or Conservative, Whig or Labour, or Republican or Democrat, they are all in the same barnyard, and when the farmer’s wife clangs that huge iron triangle just above the trough, they all come running, regardless of color, tone, race, creed, or party and they feed with the gusto of Mr. Creosote in that famous Python sketch where he “has a mint” and then explodes.

Politicians are the minions of the elite, but that is a discussion for another day.

As disgusting as the above picture appears, there is no better graphic available to adequately describe today’s political narrative. The politician of the year 2022 enters into a career not because he (or she) feels a need to change the world but more as a need to feel important.

As a student of history, I always run the risk of believing in the neutrality of the author, but biographies of the great (and not-so-great) statesmen like Churchill, Bismarck, Lincoln, and Gandhi would reveal a common thread of invincibility against media scrutiny.

They gave the middle finger to the journalist, irrespective of stature and notoriety, and went on their merry ways. There are far too many Mr. Creosote’s in today’s congressional and parliamentary gatherings; once they at once both discredited and removed, the government will improve.

Getchell Gold Last Man Standing

Markets will undoubtedly head into October with the greatest of fear and reverence. I know from conversations with my wonderful subscribers that they are terrified that our “last man standing,”

Getchell Gold Corp. (GTCH:CSE; GGLDF:OTCQB), stunned but not staggered, will finally get victimized by this most ruthless of canine predators. My response has always been the same; if the company does nothing else but deliver their revised resource estimate, then we can park our money into Getchell with the full expectation that it will eventually be rerated at “par.”

In this case, “par” is a euphemism for “fair value,” which is between 7.5-and-15-times current pricing. Forget the arrival of “the new paradigm” or the “ultimate demise of the bullion bank naked shorters”; gold mining stocks are bound for a regression to the mean of historical valuation.

When that happens, all boats shall rise.

My observation on the state of markets is this: we are at a point of extreme pessimism and headline bearishness, both historically the starter pistol “CRACK!” of a new bull market advance. The problem is that we do not yet have anything close to a confirmation by Fed policy that they give a hoot about anything but lagging deflationary indicators, so until they acknowledge the protests from the Bank of England or the screams from the U.S. pension fund clients underwater at Goldman or JPM or BofA, it will be “Preservation of Capital” at all costs.

Nord Stream Gas Pipelines

My final comment on the week revolves around the far more significant geopolitical headline that involves the sabotage of Nord Stream gas pipelines, the conduits for Russian gas transmission into Germany.

Like always, the mainstream media are so far behind the curve on this event that it begs the question: “Who actually reports the news?”

With winter approaching, the energy crisis in Europe has just ratcheted up several notches because now the Russians have ZERO leverage over the European decision-makers. As long as Vlad the Impaler carried the threat of shutting down gas flows to Europe, he had leverage in his battle for control of Ukraine but, more importantly, in his battle to wrest control of Europe from the NATO forces.

That leverage has now evaporated, and Putin knows it. The reason this is a much larger story than U.K. pension funds imploding is that it has launched the globe directly back to the Cold War of the 1960s, but since the Russians are already entangled in their Hot War in Ukraine, the loss of leverage as winter approaches has forced a desperate Europe back into the arms of NATO — meaning — the U.S.

Look for gold prices to be a dark night lighthouse, and as we sail into the outer perimeters of a possible new precious metals bull, the safe arrival will be annotated with calm seas but clear night skies full of watchful stars and suspicious moon. Watch the U.S. 10-year treasury yield as your night sextant.

So, logic dictates that on a scale of one to ten, with one being “maximum benefit of a Russian gas shutdown” and ten being “minimum (or no) benefit of a Russian gas shutdown,” Russia and all of Europe would be a “one” as Russia gets no gas revenue from Europe and Europe freezes this winter while those loyal to NATO and the U.S. would get a “ten” as Europe reaches out in desperation for assistance (“rescue”) from the West.

This was a game-changer, and the danger is that Putin, being a chess grandmaster, knows that a retaliatory move is absolutely required in order to even the playing field and to maintain favor in the court of public opinion, in the Duma, and the Russian Federal Assembly.

With the campaign in Ukraine going badly awry and certainly not the turnkey operation that was originally formatted in their war game modeling, Putin’s vice-grip on power is certainly not strengthening. We all know that there is nothing more dangerous than a wounded, cornered animal, and as a child who grew up with air raid sirens and “Duck-and-cover” drills in the 1960s, I am far more sensitive to the prospect of a nuclear option currently at the disposal of Vlad the Impaler.

Somewhere out there is a retaliatory move being planned, and while markets creaked and shuddered at the specter of a massive pension fund default earlier this week, it will most certainly break in half at a sinking of a large LNG freighter carrying a U.S. flag or something (god forbid) even direr.

Look for gold prices to be a dark night lighthouse, and as we sail into the outer perimeters of a possible new precious metals bull, the safe arrival will be annotated with calm seas but clear night skies full of watchful stars and suspicious moon.

Watch the U.S. 10-year treasury yield as your night sextant. It looks like it has been “taken” lower this week — always the first clue for a cynical man trying to make sense of the world growing increasingly mad by the day, hour, and minute.

Michael Ballanger Disclaimer:

This letter makes no guarantee or warranty on the accuracy or completeness of the data provided. Nothing contained herein is intended or shall be deemed to be investment advice, implied or otherwise. This letter represents my views and replicates trades that I am making but nothing more than that. Always consult your registered advisor to assist you with your investments. I accept no liability for any loss arising from the use of the data contained on this letter. Options and junior mining stocks contain a high level of risk that may result in the loss of part or all invested capital and therefore are suitable for experienced and professional investors and traders only. One should be familiar with the risks involved in junior mining and options trading and we recommend consulting a financial adviser if you feel you do not understand the risks involved.

Disclosures:

1) Michael J. Ballanger: I, or members of my immediate household or family, own securities of the following companies mentioned in this article: Getchell Gold Corp. I personally am, or members of my immediate household or family are, paid by the following companies mentioned in this article: None. My company, Bonaventure Explorations Ltd., has a consulting relationship with Getchell Gold Corp.

2) The following companies mentioned in this article are billboard sponsors of Streetwise Reports: None. Click here for important disclosures about sponsor fees.

3) Statements and opinions expressed are the opinions of the author and not of Streetwise Reports or its officers. The author is wholly responsible for the validity of the statements. The author was not paid by Streetwise Reports for this article. Streetwise Reports was not paid by the author to publish or syndicate this article. Streetwise Reports requires contributing authors to disclose any shareholdings in, or economic relationships with, companies that they write about. Streetwise Reports relies upon the authors to accurately provide this information and Streetwise Reports has no means of verifying its accuracy.

4) This article does not constitute investment advice. Each reader is encouraged to consult with his or her individual financial professional and any action a reader takes as a result of information presented here is his or her own responsibility. By opening this page, each reader accepts and agrees to Streetwise Reports’ terms of use and full legal disclaimer. This article is not a solicitation for investment. Streetwise Reports does not render general or specific investment advice and the information on Streetwise Reports should not be considered a recommendation to buy or sell any security. Streetwise Reports does not endorse or recommend the business, products, services or securities of any company mentioned on Streetwise Reports.

5) From time to time, Streetwise Reports LLC and its directors, officers, employees or members of their families, as well as persons interviewed for articles and interviews on the site, may have a long or short position in securities mentioned. Directors, officers, employees or members of their immediate families are prohibited from making purchases and/or sales of those securities in the open market or otherwise from the time of the decision to publish an article until three business days after the publication of the article. The foregoing prohibition does not apply to articles that in substance only restate previously published company releases.

As of the date of this article, officers and/or employees of Streetwise Reports LLC (including members of their household) own securities of Getchell Gold Corp., a company mentioned in this article.


NIO Stock fell today by -7.00 percent – October 06 2022

By InvestMacro.com | #stocks #NIO #technologystocks

NIO Inc. End of Day Update: October 06 2022

The NIO Inc. (NIO) stock finished the day with a fall of -7.00 percent and closed the day around the 14.918 price level, according to unofficial data at the New York close.

NIO, a Chinese electric car company based out of Shanghai, opened the day trading at 16.0 with the high of the day being 16.24 and the low of the day at 14.78. The stock is trading below both its 200-day moving average and its 20-day moving average currently.

NIO Stock fell today by -7.00 percent - October 06 2022

The NIO RSI level is Bearish

The Relative Strength Index, an indicator that can indicate overbought (above 70) and oversold levels (below 30), shows that the current RSI score is at 33.6 for a Bearish reading on the daily time-frame.

The NIO RSI level is Bearish

NIO Price Trends

NIO is now down by -18.70 percent over the past 10 days while seeing a decline of -20.94 over the past 30 days. The 90-day change is -9.97 while the 180-day return and the 365-day return are -47.89 and -63.80, respectively.

By InvestMacro.com

THIS is Why the Real Estate Tide is Turning

Here’s your next step to get a handle on the global property market.

By Elliott Wave International

Treat houses as a consumption item — or simply as a place to live, and history shows that real prices will fluctuate only modestly over the decades.

Treat houses as an investment, and the value of houses takes on the characteristics of the stock market.

This is from the January 2012 Elliott Wave Theorist, a monthly publication which covers financial markets and major cultural trends — in the wake of the prior housing bust:

Real home prices [in a U.S. index] stayed within a range of 66-123 [from 1890] until 1997. Then they went straight up for 9 years. Inflation doesn’t account for the rise in real prices, because inflation has been factored out. And loans were available for decades without causing real prices to soar. Why did it finally happen? … Real estate began to take on the aura of being an investment.

As we know, after going up for 9 straight years, the housing market then crashed — just like the stock market is apt to do at times.

That same psychology of “a house as an investment” sent prices soaring again in the most recent housing bubble.

However, trouble has already started to brew. Here’s a Sept. 2 CNBC headline:

1 in 5 home sellers are now dropping their asking price as the housing market cools

This brings us to Elliott Wave International’s latest analysis — which is provided in the just-published special report “Home Prices: How Much Trouble Are YOU In?”

Here’s just one of the several charts you’ll find in the special report, along with the commentary:

Many of the cities that led the real estate market on the way up are now doing so on the way down. Home sellers in former boomtowns have been quickest to lower asking prices. …

Nationally, Redfin reports that the percentage of sellers lowering their prices is the largest since it started tracking the data in 2012. … The tide is turning.

Likewise, builders themselves have been reducing prices. A Sept. 24 Yahoo Finance article noted:

Almost 1 in 4 home builders reported reducing their price this month, up from 19% in August … Home builder confidence fell three points to its lowest level since May 2014.

You’ll find more evidence in the special report that the “tide is turning” for the U.S. housing market, including examinations of housing starts and what’s going on with a firm that’s been a big player in the housing flipping business.

And getting back to asking prices, you may be interested in knowing that on August 15, Bloomberg reported that asking prices in the United Kingdom fell at their fastest pace in two-and-a-half years.

Speaking of which, the coverage in the special report extends beyond the U.S. as Elliott Wave International looks at European, Asian-Pacific and Australian property markets.

Here’s the good news: You can access the special report “Home Prices: How Much Trouble Are YOU In?” for free for a limited time.

Just follow this link: “Home Prices: How Much Trouble Are YOU In?”

This article was syndicated by Elliott Wave International and was originally published under the headline THIS is Why the Real Estate Tide is Turning. EWI is the world’s largest market forecasting firm. Its staff of full-time analysts led by Chartered Market Technician Robert Prechter provides 24-hour-a-day market analysis to institutional and private investors around the world.

Forex Technical Analysis & Forecast 06.10.2022

Article By RoboForex.com

EURUSD, “Euro vs US Dollar”

After completing the descending wave at 0.9834 along with the correction up to 0.9922, EURUSD is expected to fall to break 0.9800 and then continue trading downwards with the short-term target at 0.9744.

EURUSD
Risk Warning: the result of previous trading operations do not guarantee the same results in the future

GBPUSD, “Great Britain Pound vs US Dollar”

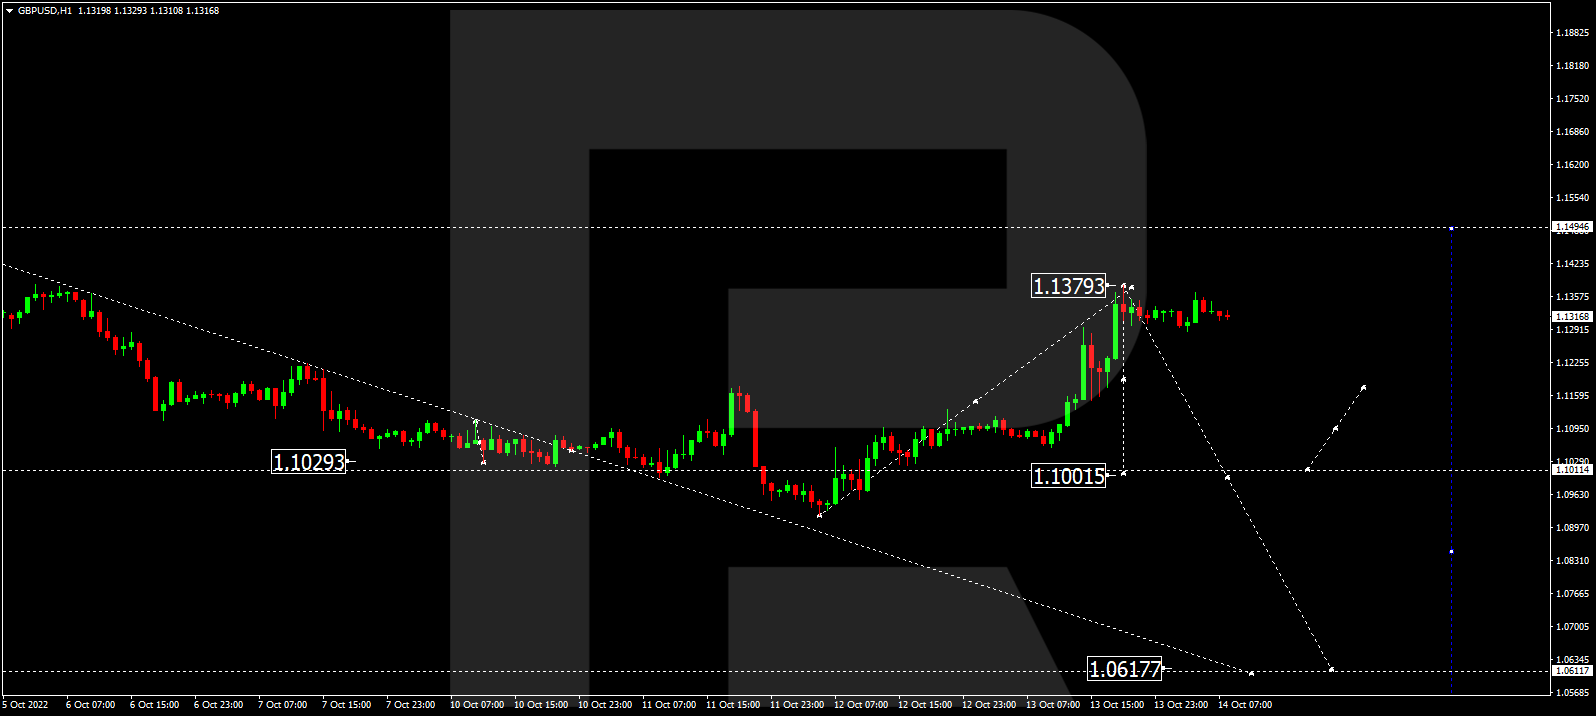
GBPUSD has finished the descending structure at 1.1226 along with the correction up to 1.1355. Today, the pair may resume trading downwards to break 1.1220 and then continue falling with the short-term 1.1000.

GBPUSD
Risk Warning: the result of previous trading operations do not guarantee the same results in the future

USDJPY, “US Dollar vs Japanese Yen”

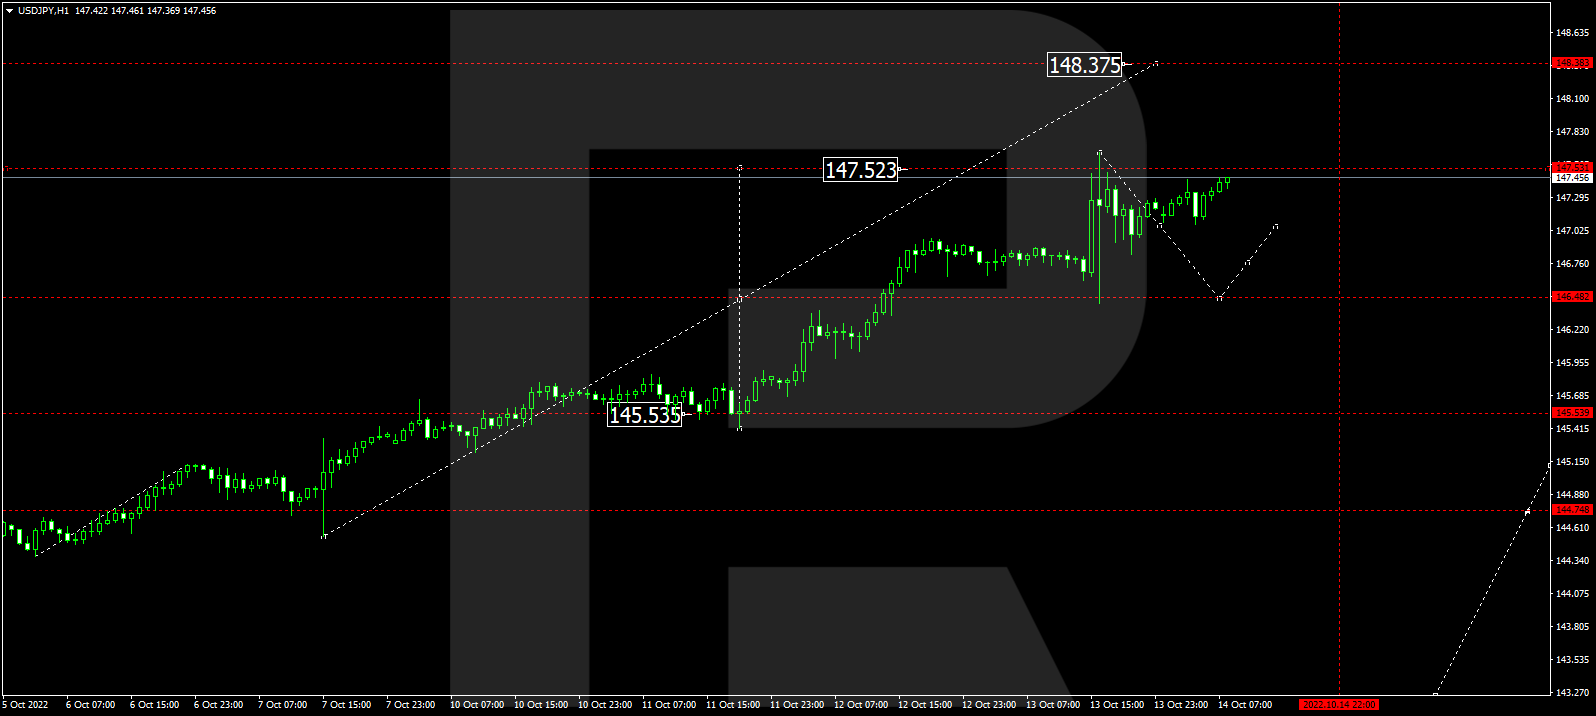
Having completed the ascending wave at 144.80, USDJPY is expected to resume falling to break 144.06 and then continue trading downwards with the target at 143.50.

USDJPY
Risk Warning: the result of previous trading operations do not guarantee the same results in the future

USDCHF, “US Dollar vs Swiss Franc”

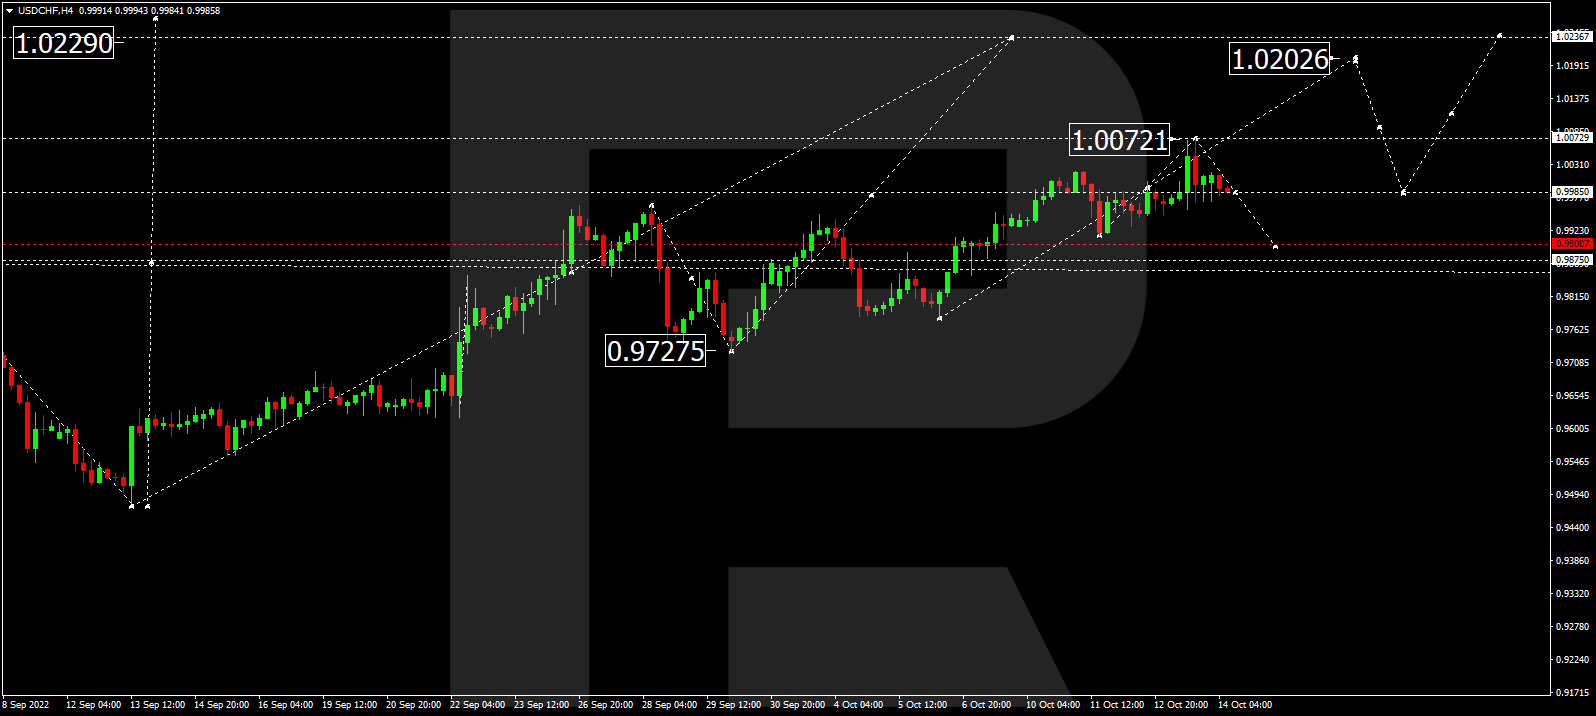
USDCHF is consolidating above 0.9797. Possibly, the pair may form one more ascending wave to reach 0.9999 and then start a new decline with the target at 0.9700.

USDCHF
Risk Warning: the result of previous trading operations do not guarantee the same results in the future

AUDUSD, “Australian Dollar vs US Dollar”

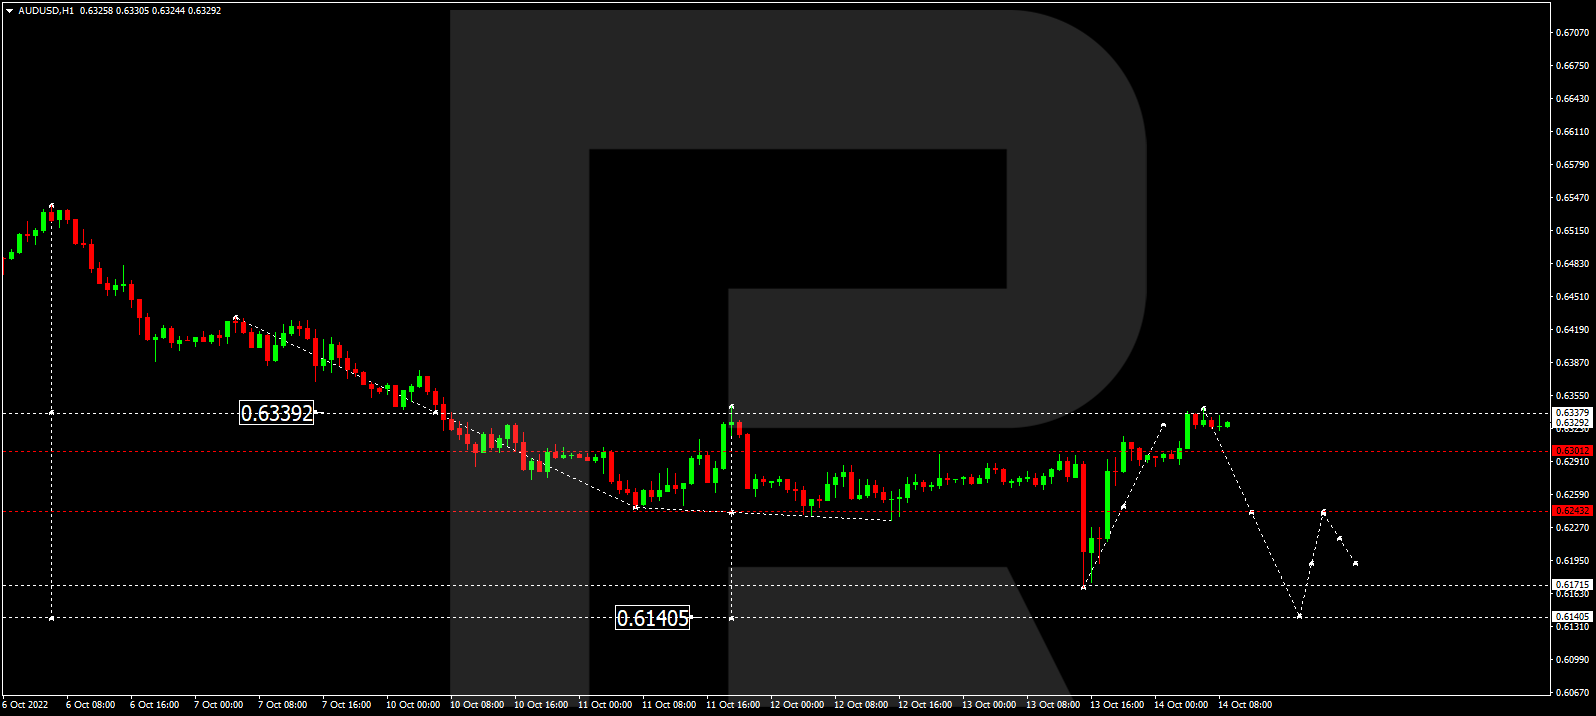
AUDUSD is still consolidating around 0.6500. Possibly, today the pair may grow to reach 0.6600 and then resume trading downwards with the target at 0.6400.

AUDUSD
Risk Warning: the result of previous trading operations do not guarantee the same results in the future

BRENT

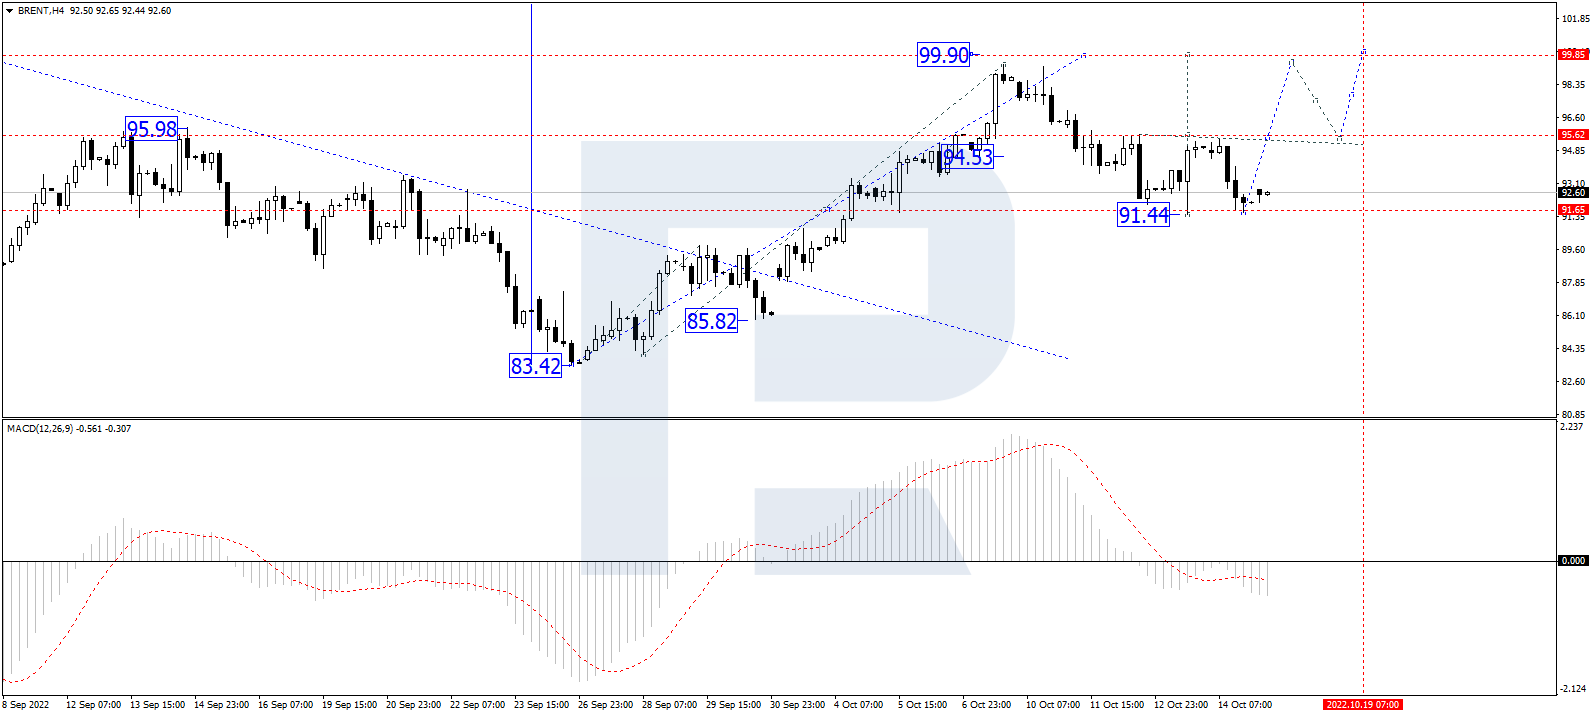
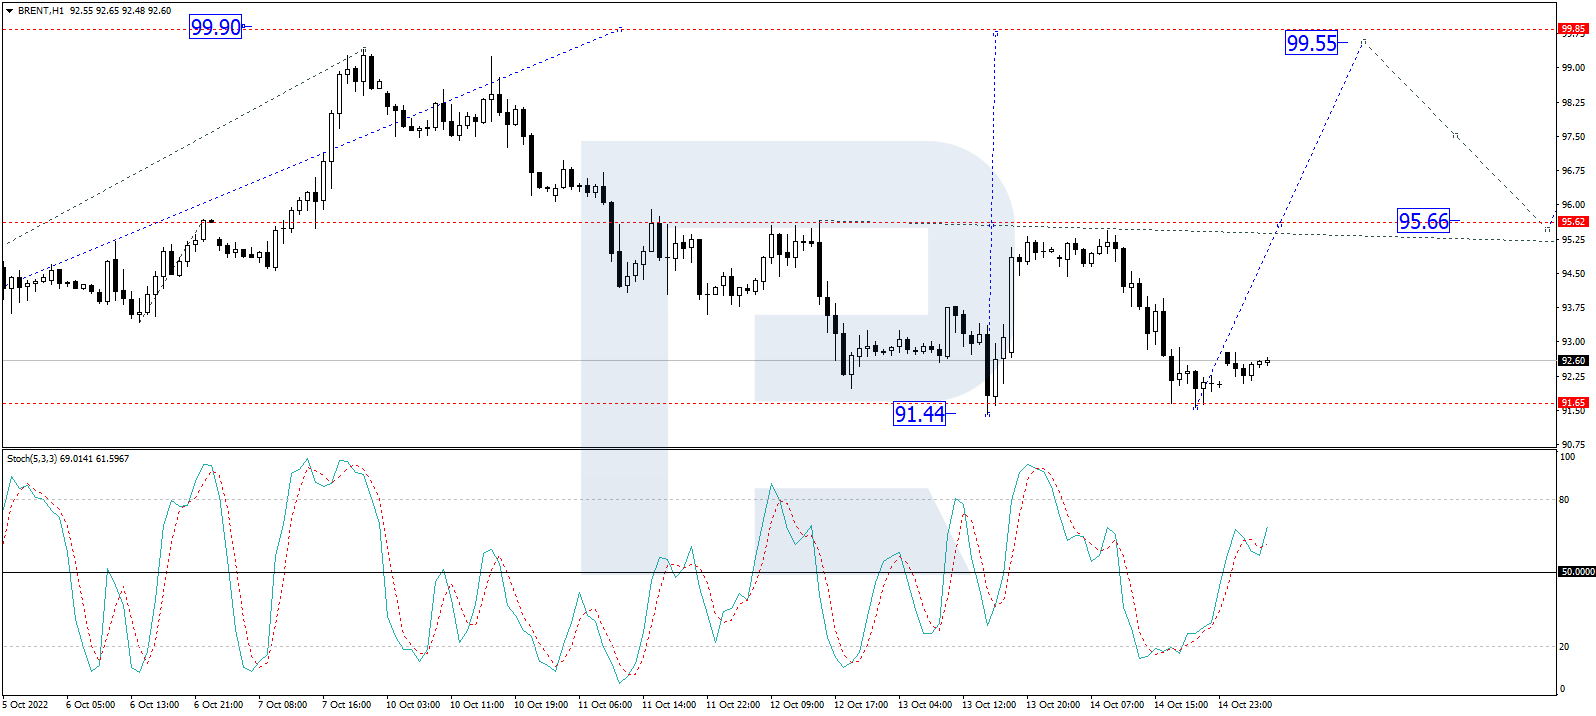
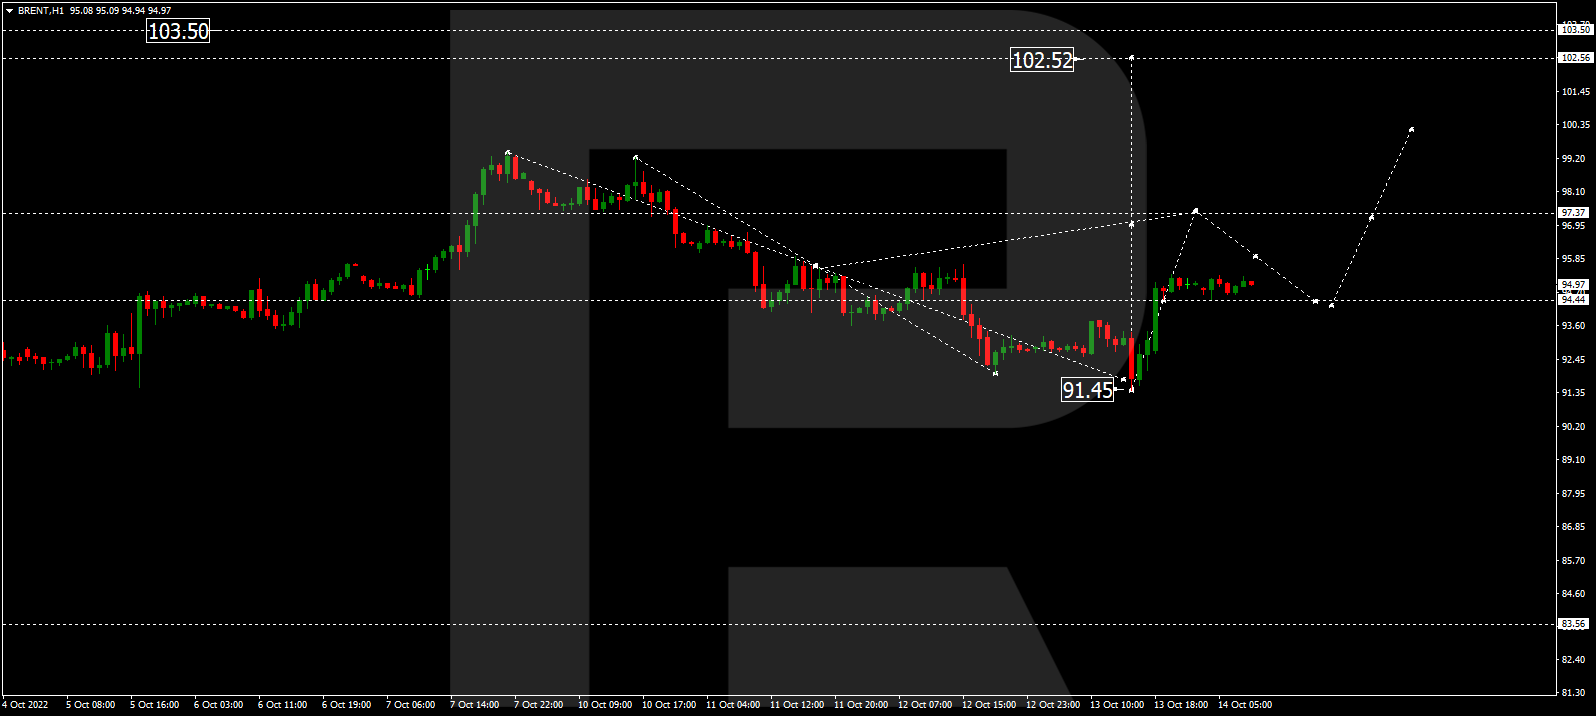
After finishing the ascending wave at 94.76, Brent is forming a new consolidation there. Possibly, the asset may break the range to the upside and resume growing towards 95.00, or even extend this structure to reach the short-term target at 97.30.

BRENT
Risk Warning: the result of previous trading operations do not guarantee the same results in the future

XAUUSD, “Gold vs US Dollar”

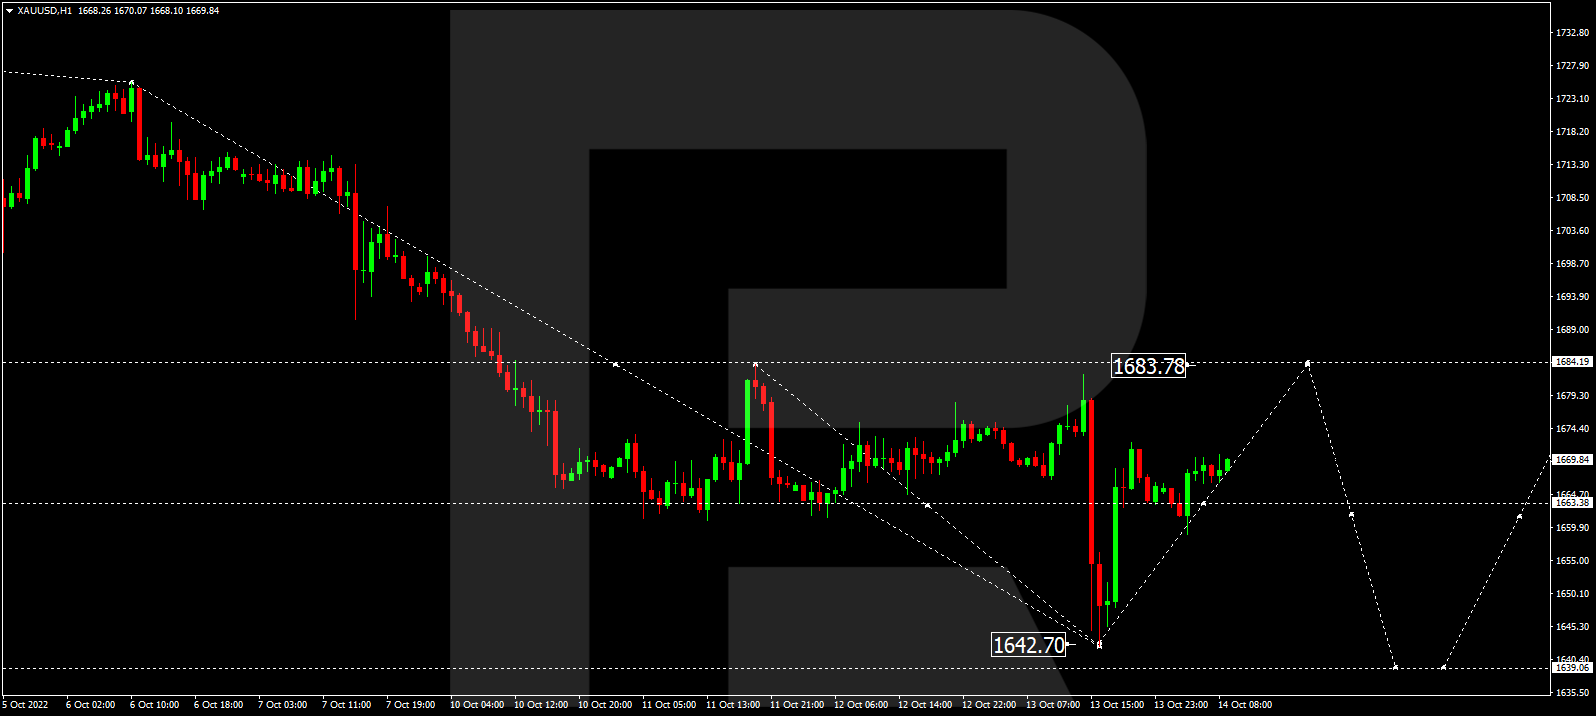
After completing the descending wave at 1700.44 along with the correction up to 1722.22, Gold is expected to form a new descending structure to break 1694.22 and then continue trading downwards with the target at 1660.00.

GOLD
Risk Warning: the result of previous trading operations do not guarantee the same results in the future

S&P 500

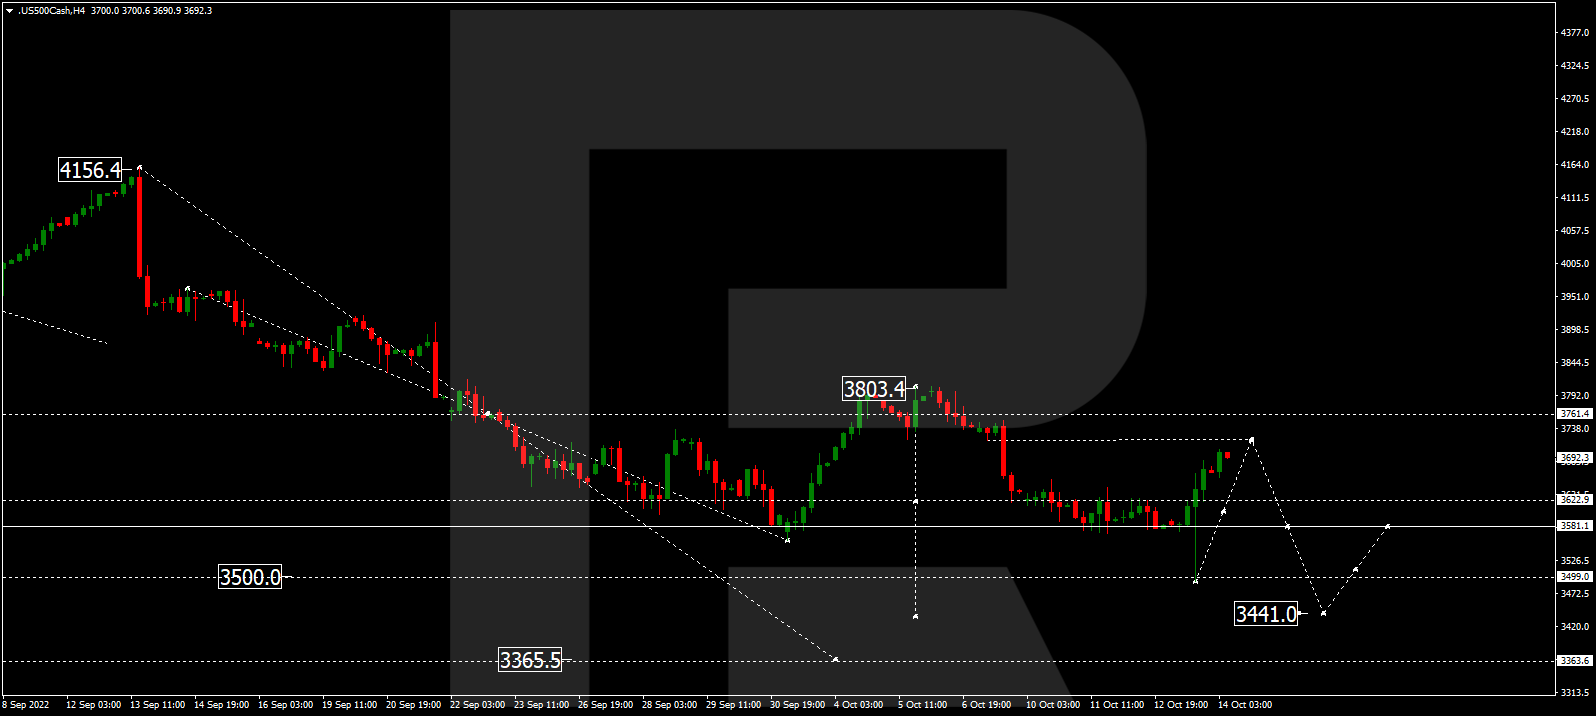
Having finished the ascending wave at 3800.0, the S&P index is expected to start a new decline to break 3666.6 and then continue falling with the short-term target at 3500.0.

S&P 500

Article By RoboForex.com

Attention!
Forecasts presented in this section only reflect the author’s private opinion and should not be considered as guidance for trading. RoboForex LP bears no responsibility for trading results based on trading recommendations described in these analytical reviews.

The Australian Dollar moved “into the black”. Overview for 06.10.2022

Article By RoboForex.com

The Australian Dollar reached stability against the USD on Thursday. The current quote for the instrument is 0.6534.

The Aussie had difficult times handling the RBA’s decision to raise the benchmark interest rate below market expectations. The next thing that put pressure on the Australian currency was a local recovery of the “greenback”. However, these reasons are no longer actual.

The statistics published today showed that the Australian Trade Balance dropped to AUD$8.32 billion in June against the expected reading of AUD$10.0 billion. The components of the report show that the Export gained 2.6% after losing 9.9% the month before, while the Import went from 5.2% to 4.5%.

Globally, Australia could have enhanced its standing on the world economic stage by increasing the production of coal and other energy resources. Australia already did this in the past, but about ten years ago the country started to restructure and diversify its economy. As a result, coal mining was no longer the key income source for the budget.

Nowadays, demand for alternative sources of energy is increasing. Possibly, Australia might expand its share in this market. However, if it happens, the AUD might get more volatile due to the fluctuations in energy prices.

Article By RoboForex.com

Attention!
Forecasts presented in this section only reflect the author’s private opinion and should not be considered as guidance for trading. RoboForex LP bears no responsibility for trading results based on trading recommendations described in these analytical reviews.