By InvestMacro
Here are the latest charts and statistics for the Commitment of Traders (COT) data published by the Commodities Futures Trading Commission (CFTC).
The latest COT data is updated through Tuesday October 11th and shows a quick view of how large traders (for-profit speculators and commercial entities) were positioned in the futures markets.
Weekly Speculator Changes shows Gold, Platinum & Copper have higher bets
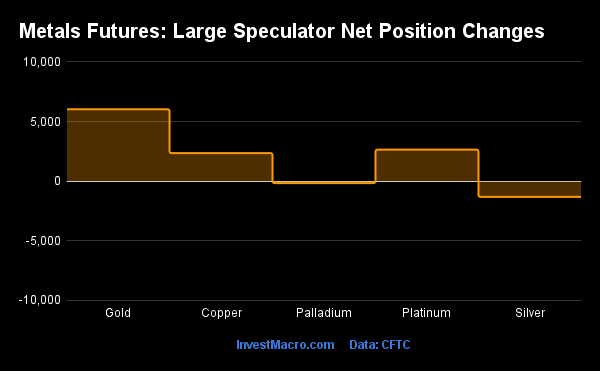
The COT precious metals speculator bets were higher this week as three out of the five metals markets we cover had higher positioning this week while two markets had lower contracts.
Free Reports:
 Download Our Metatrader 4 Indicators – Put Our Free MetaTrader 4 Custom Indicators on your charts when you join our Weekly Newsletter
 Get our Weekly Commitment of Traders Reports - See where the biggest traders (Hedge Funds and Commercial Hedgers) are positioned in the futures markets on a weekly basis.
Leading the gains for the precious metals markets was Gold (6,035 contracts) with Platinum (2,647 contracts) and Copper (2,352 contracts) also showing a positive week.
The metals markets leading the declines in speculator bets this week were Silver (-1,319 contracts) with Palladium (-158 contracts) also registering lower bets on the week.
Highlighting the metals COT markets this week is the Gold positioning that has rebounded slightly from the steep declines over the past couple of months. Gold speculator bets rose for a second straight week this week after seeing a decline in the previous seven straight weeks (a total drop of -90,770 speculator contracts over that period). The Gold position, on September 27th, had fallen to the lowest level in the past 179-weeks before rebounding over the past two weeks. Last week’s rise in speculator bets by over +36,000 contracts was the largest one-week increase since February 18th of 2020 and today’s speculator positioning is now back close to the +100,000 contract level. Gold prices, meanwhile, are currently trading just below the $1,650 support level after falling over 3 percent this week. The price decline is potentially setting up a new test of the 2-year lows under $1,620 that took place in late September.
| Oct-11-2022 | OI | OI-Index | Spec-Net | Spec-Index | Com-Net | COM-Index | Smalls-Net | Smalls-Index |
|---|---|---|---|---|---|---|---|---|
| WTI Crude | 1,499,498 | 3 | 259,220 | 13 | -283,626 | 88 | 24,406 | 41 |
| Gold | 431,395 | 0 | 94,420 | 14 | -103,728 | 87 | 9,308 | 3 |
| Silver | 125,623 | 0 | 7,389 | 22 | -15,603 | 80 | 8,214 | 10 |
| Copper | 167,449 | 8 | -15,899 | 24 | 16,903 | 80 | -1,004 | 19 |
| Palladium | 6,890 | 5 | -754 | 19 | 810 | 79 | -56 | 41 |
| Platinum | 52,435 | 9 | 5,928 | 17 | -8,690 | 85 | 2,762 | 5 |
| Natural Gas | 974,468 | 5 | -162,103 | 30 | 130,099 | 72 | 32,004 | 56 |
| Brent | 163,113 | 11 | -41,888 | 41 | 38,882 | 58 | 3,006 | 50 |
| Heating Oil | 275,262 | 25 | 19,423 | 71 | -38,448 | 30 | 19,025 | 64 |
| Soybeans | 694,960 | 26 | 55,769 | 30 | -30,614 | 77 | -25,155 | 29 |
| Corn | 1,408,939 | 20 | 325,121 | 72 | -258,225 | 35 | -66,896 | 5 |
| Coffee | 188,198 | 3 | 40,534 | 73 | -43,359 | 30 | 2,825 | 29 |
| Sugar | 687,209 | 0 | 101,115 | 57 | -135,145 | 43 | 34,030 | 50 |
| Wheat | 307,901 | 9 | -1,990 | 16 | 8,705 | 72 | -6,715 | 76 |
Silver and Copper top the Strength Scores
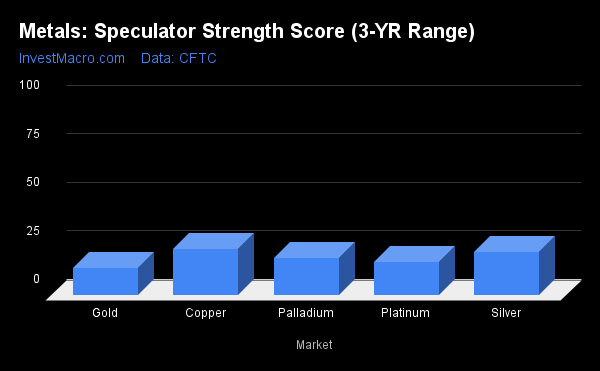
Strength scores (a measure of the 3-Year range of Speculator positions, from 0 to 100 where above 80 is extreme bullish and below 20 is extreme bearish) showed that the Copper (23.7 percent) and Silver (22.3 percent) lead the metals this week.
On the downside, Gold (14.0 percent), Platinum (17.1 percent) and Palladium (19.1 percent) continue to be at the lower end of their range and are all in bearish extreme positions below 20 percent.
Strength Statistics:
Gold (14.0 percent) vs Gold previous week (12.0 percent)
Silver (22.3 percent) vs Silver previous week (23.7 percent)
Copper (23.7 percent) vs Copper previous week (21.8 percent)
Platinum (17.1 percent) vs Platinum previous week (13.5 percent)
Palladium (19.1 percent) vs Palladium previous week (20.0 percent)
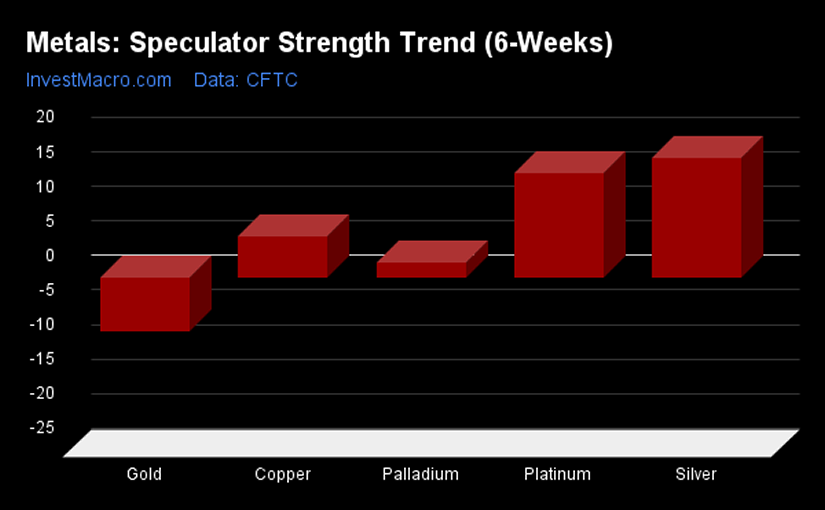
Strength Trends led Silver and Platinum

Strength Score Trends (or move index, calculates the 6-week changes in strength scores) show that the Silver (17.3 percent) and Platinum (15.2 percent) lead the past six weeks trends for metals this week. Copper (5.9 percent) and Palladium (2.2 percent) fill out the other positive movers in the latest trends data.
This leaves Gold (-7.7 percent) as the only negative mover over the past six weeks. Gold, however, has been seeing improvements in the past few weeks and is higher this week from -12.4 percent last week.
Move Statistics:
Gold (-7.7 percent) vs Gold previous week (-12.4 percent)
Silver (17.3 percent) vs Silver previous week (14.6 percent)
Copper (5.9 percent) vs Copper previous week (0.6 percent)
Platinum (15.2 percent) vs Platinum previous week (5.2 percent)
Palladium (2.2 percent) vs Palladium previous week (6.9 percent)
Individual Markets:
Gold Comex Futures:
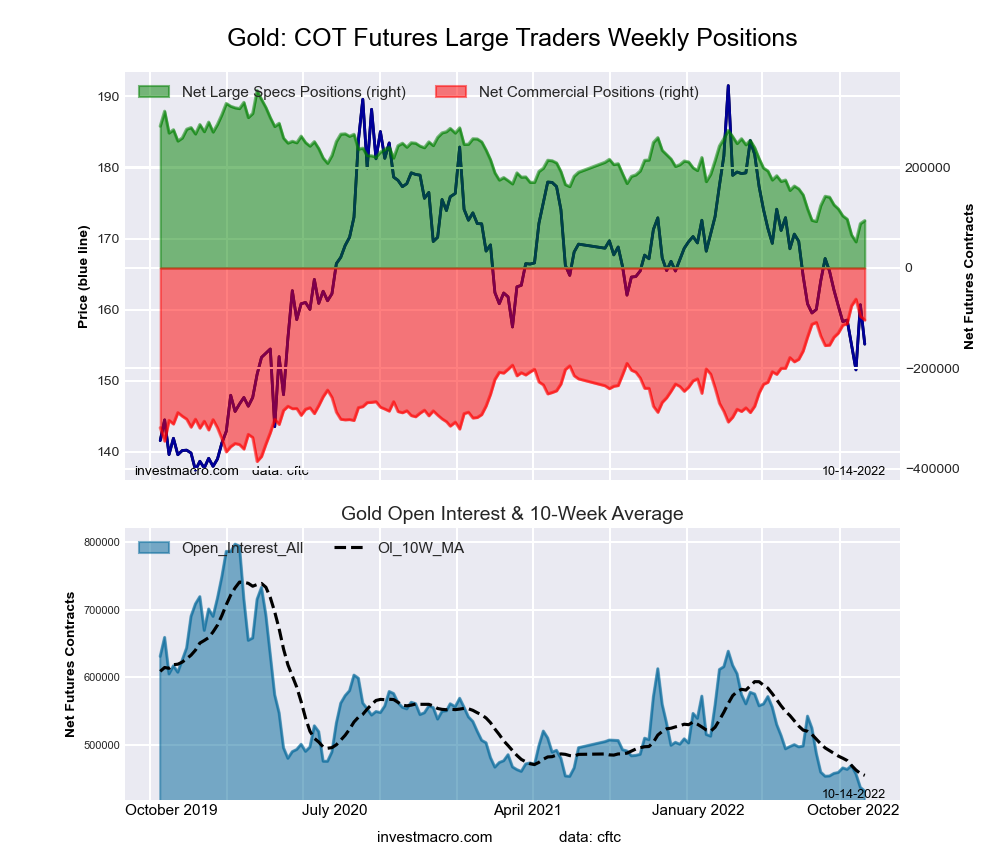 The Gold Comex Futures large speculator standing this week came in at a net position of 94,420 contracts in the data reported through Tuesday. This was a weekly gain of 6,035 contracts from the previous week which had a total of 88,385 net contracts.
This week’s current strength score (the trader positioning range over the past three years, measured from 0 to 100) shows the speculators are currently Bearish-Extreme with a score of 14.0 percent. The commercials are Bullish-Extreme with a score of 87.1 percent and the small traders (not shown in chart) are Bearish-Extreme with a score of 2.9 percent.
| Gold Futures Statistics | SPECULATORS | COMMERCIALS | SMALL TRADERS |
| – Percent of Open Interest Longs: | 49.3 | 26.2 | 8.6 |
| – Percent of Open Interest Shorts: | 27.4 | 50.2 | 6.4 |
| – Net Position: | 94,420 | -103,728 | 9,308 |
| – Gross Longs: | 212,561 | 112,867 | 36,988 |
| – Gross Shorts: | 118,141 | 216,595 | 27,680 |
| – Long to Short Ratio: | 1.8 to 1 | 0.5 to 1 | 1.3 to 1 |
| NET POSITION TREND: | |||
| – Strength Index Score (3 Year Range Pct): | 14.0 | 87.1 | 2.9 |
| – Strength Index Reading (3 Year Range): | Bearish-Extreme | Bullish-Extreme | Bearish-Extreme |
| NET POSITION MOVEMENT INDEX: | |||
| – 6-Week Change in Strength Index: | -7.7 | 8.0 | -6.6 |
Silver Comex Futures:
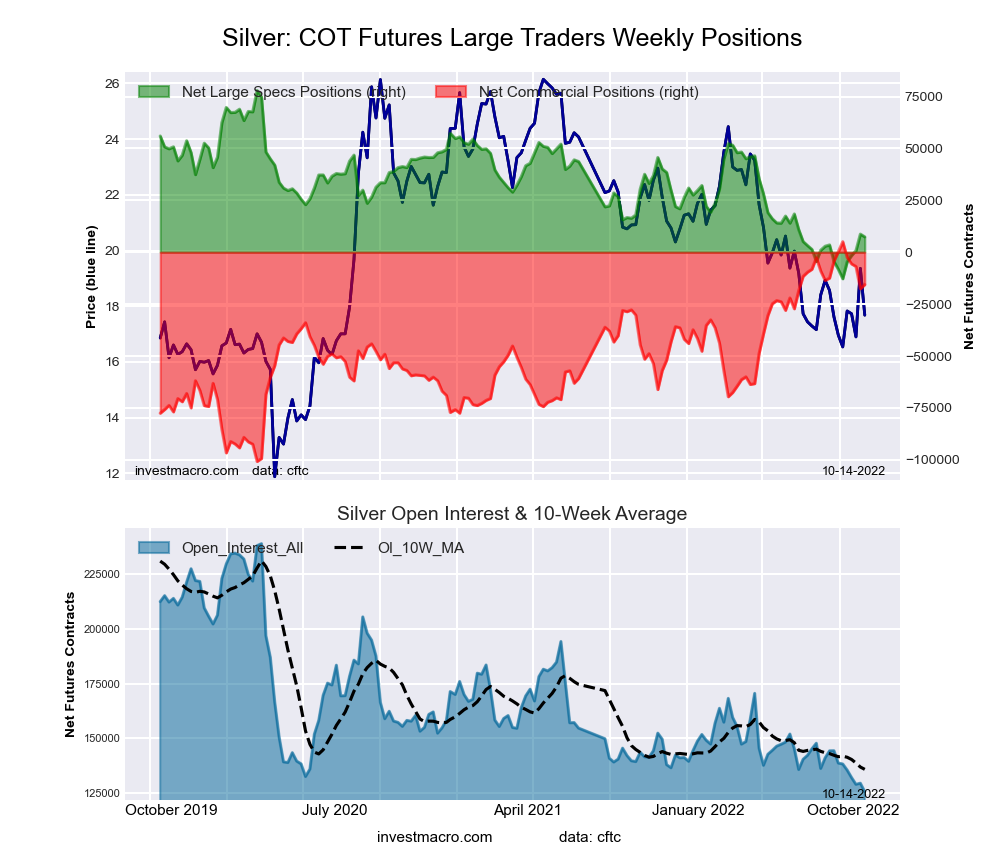 The Silver Comex Futures large speculator standing this week came in at a net position of 7,389 contracts in the data reported through Tuesday. This was a weekly decrease of -1,319 contracts from the previous week which had a total of 8,708 net contracts.
This week’s current strength score (the trader positioning range over the past three years, measured from 0 to 100) shows the speculators are currently Bearish with a score of 22.3 percent. The commercials are Bullish-Extreme with a score of 80.5 percent and the small traders (not shown in chart) are Bearish-Extreme with a score of 10.1 percent.
| Silver Futures Statistics | SPECULATORS | COMMERCIALS | SMALL TRADERS |
| – Percent of Open Interest Longs: | 38.2 | 37.9 | 17.0 |
| – Percent of Open Interest Shorts: | 32.3 | 50.3 | 10.5 |
| – Net Position: | 7,389 | -15,603 | 8,214 |
| – Gross Longs: | 47,939 | 47,603 | 21,347 |
| – Gross Shorts: | 40,550 | 63,206 | 13,133 |
| – Long to Short Ratio: | 1.2 to 1 | 0.8 to 1 | 1.6 to 1 |
| NET POSITION TREND: | |||
| – Strength Index Score (3 Year Range Pct): | 22.3 | 80.5 | 10.1 |
| – Strength Index Reading (3 Year Range): | Bearish | Bullish-Extreme | Bearish-Extreme |
| NET POSITION MOVEMENT INDEX: | |||
| – 6-Week Change in Strength Index: | 17.3 | -15.0 | 1.0 |
Copper Grade #1 Futures:
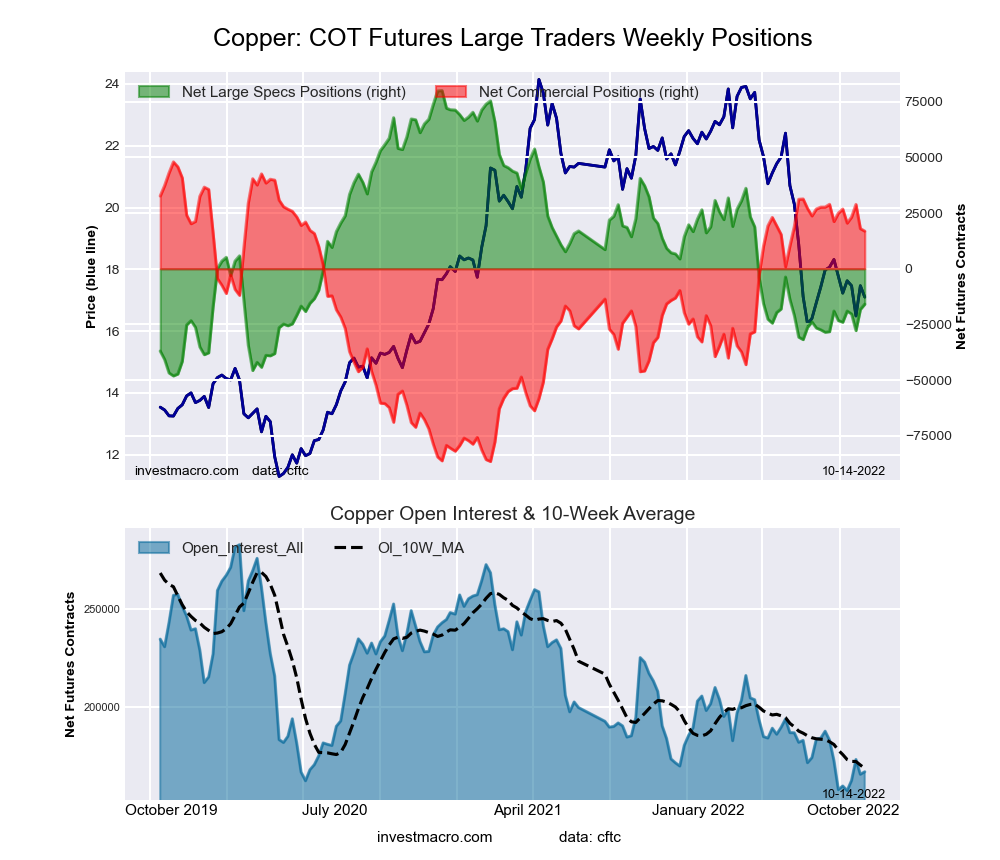 The Copper Grade #1 Futures large speculator standing this week came in at a net position of -15,899 contracts in the data reported through Tuesday. This was a weekly gain of 2,352 contracts from the previous week which had a total of -18,251 net contracts.
This week’s current strength score (the trader positioning range over the past three years, measured from 0 to 100) shows the speculators are currently Bearish with a score of 23.7 percent. The commercials are Bullish-Extreme with a score of 80.1 percent and the small traders (not shown in chart) are Bearish-Extreme with a score of 19.5 percent.
| Copper Futures Statistics | SPECULATORS | COMMERCIALS | SMALL TRADERS |
| – Percent of Open Interest Longs: | 30.5 | 47.2 | 8.3 |
| – Percent of Open Interest Shorts: | 40.0 | 37.1 | 8.9 |
| – Net Position: | -15,899 | 16,903 | -1,004 |
| – Gross Longs: | 51,021 | 79,079 | 13,853 |
| – Gross Shorts: | 66,920 | 62,176 | 14,857 |
| – Long to Short Ratio: | 0.8 to 1 | 1.3 to 1 | 0.9 to 1 |
| NET POSITION TREND: | |||
| – Strength Index Score (3 Year Range Pct): | 23.7 | 80.1 | 19.5 |
| – Strength Index Reading (3 Year Range): | Bearish | Bullish-Extreme | Bearish-Extreme |
| NET POSITION MOVEMENT INDEX: | |||
| – 6-Week Change in Strength Index: | 5.9 | -6.3 | 4.2 |
Platinum Futures:
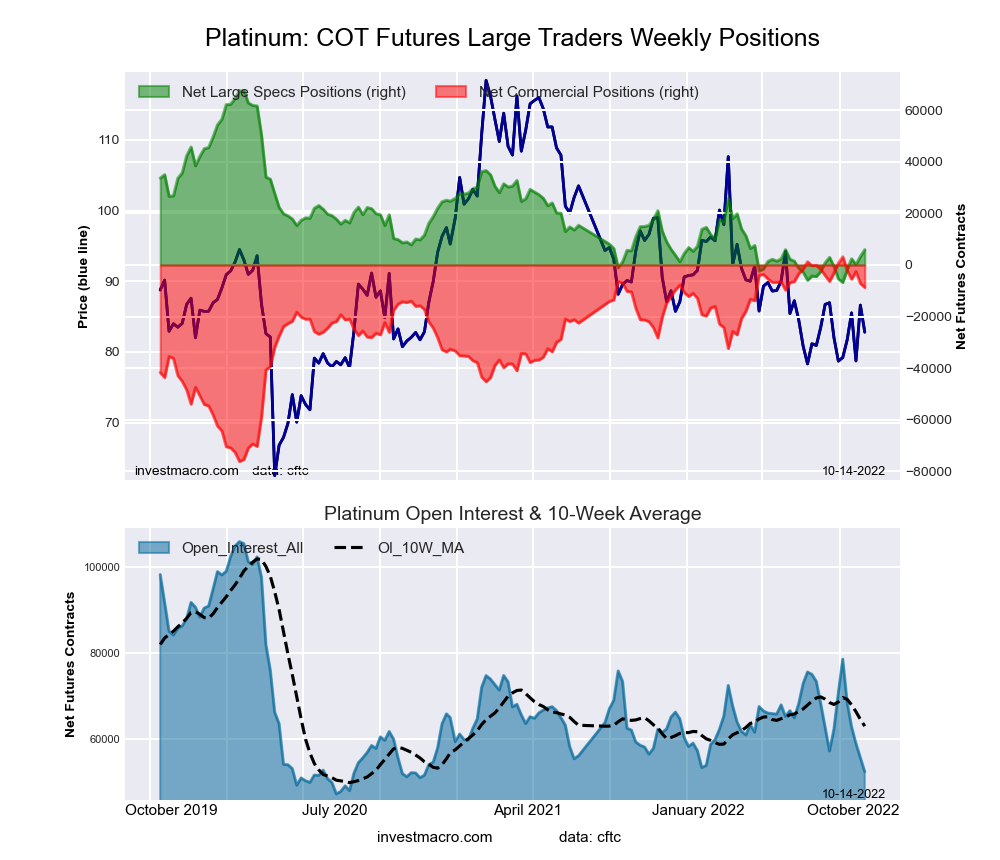 The Platinum Futures large speculator standing this week came in at a net position of 5,928 contracts in the data reported through Tuesday. This was a weekly boost of 2,647 contracts from the previous week which had a total of 3,281 net contracts.
This week’s current strength score (the trader positioning range over the past three years, measured from 0 to 100) shows the speculators are currently Bearish-Extreme with a score of 17.1 percent. The commercials are Bullish-Extreme with a score of 85.1 percent and the small traders (not shown in chart) are Bearish-Extreme with a score of 5.3 percent.
| Platinum Futures Statistics | SPECULATORS | COMMERCIALS | SMALL TRADERS |
| – Percent of Open Interest Longs: | 46.4 | 38.0 | 12.5 |
| – Percent of Open Interest Shorts: | 35.0 | 54.6 | 7.2 |
| – Net Position: | 5,928 | -8,690 | 2,762 |
| – Gross Longs: | 24,306 | 19,947 | 6,554 |
| – Gross Shorts: | 18,378 | 28,637 | 3,792 |
| – Long to Short Ratio: | 1.3 to 1 | 0.7 to 1 | 1.7 to 1 |
| NET POSITION TREND: | |||
| – Strength Index Score (3 Year Range Pct): | 17.1 | 85.1 | 5.3 |
| – Strength Index Reading (3 Year Range): | Bearish-Extreme | Bullish-Extreme | Bearish-Extreme |
| NET POSITION MOVEMENT INDEX: | |||
| – 6-Week Change in Strength Index: | 15.2 | -11.8 | -26.2 |
Palladium Futures:
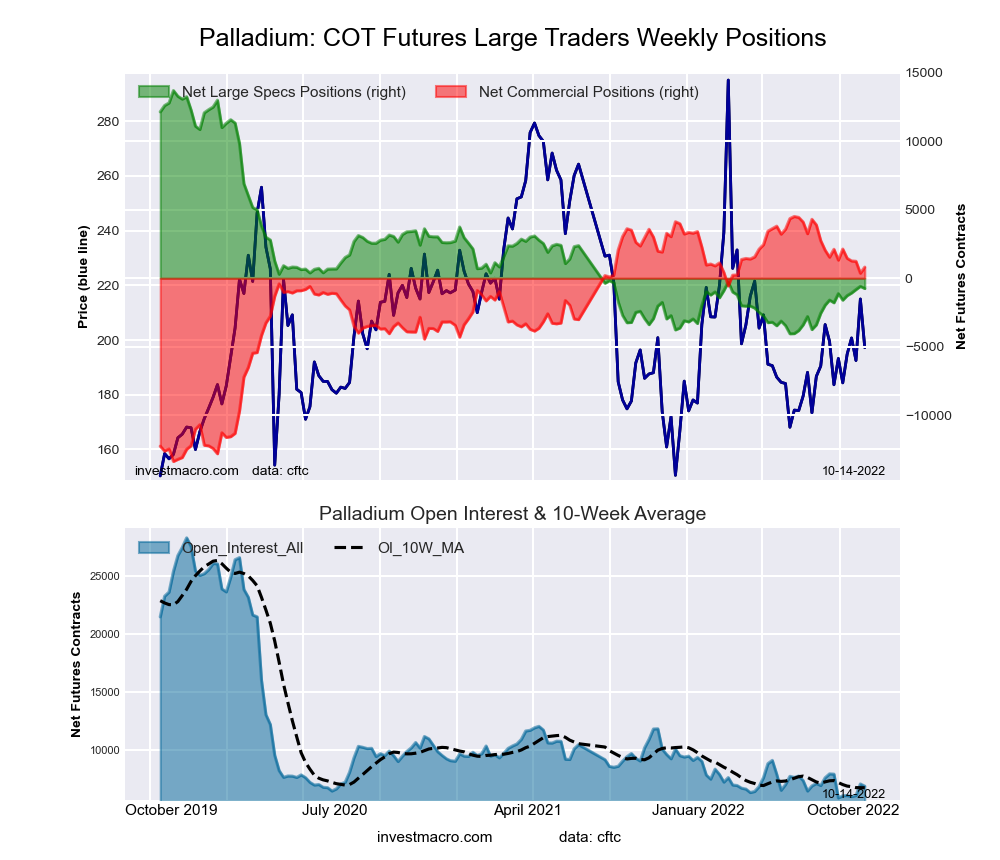 The Palladium Futures large speculator standing this week came in at a net position of -754 contracts in the data reported through Tuesday. This was a weekly fall of -158 contracts from the previous week which had a total of -596 net contracts.
This week’s current strength score (the trader positioning range over the past three years, measured from 0 to 100) shows the speculators are currently Bearish-Extreme with a score of 19.1 percent. The commercials are Bullish with a score of 79.0 percent and the small traders (not shown in chart) are Bearish with a score of 40.6 percent.
| Palladium Futures Statistics | SPECULATORS | COMMERCIALS | SMALL TRADERS |
| – Percent of Open Interest Longs: | 29.7 | 53.1 | 16.2 |
| – Percent of Open Interest Shorts: | 40.7 | 41.3 | 17.1 |
| – Net Position: | -754 | 810 | -56 |
| – Gross Longs: | 2,049 | 3,656 | 1,119 |
| – Gross Shorts: | 2,803 | 2,846 | 1,175 |
| – Long to Short Ratio: | 0.7 to 1 | 1.3 to 1 | 1.0 to 1 |
| NET POSITION TREND: | |||
| – Strength Index Score (3 Year Range Pct): | 19.1 | 79.0 | 40.6 |
| – Strength Index Reading (3 Year Range): | Bearish-Extreme | Bullish | Bearish |
| NET POSITION MOVEMENT INDEX: | |||
| – 6-Week Change in Strength Index: | 2.2 | -2.9 | 8.0 |
Article By InvestMacro – Receive our weekly COT Newsletter
*COT Report: The COT data, released weekly to the public each Friday, is updated through the most recent Tuesday (data is 3 days old) and shows a quick view of how large speculators or non-commercials (for-profit traders) were positioned in the futures markets.
The CFTC categorizes trader positions according to commercial hedgers (traders who use futures contracts for hedging as part of the business), non-commercials (large traders who speculate to realize trading profits) and nonreportable traders (usually small traders/speculators) as well as their open interest (contracts open in the market at time of reporting). See CFTC criteria here.

- COT Metals Charts: Weekly Speculator Bets led by Copper & Steel Jul 18, 2026
- COT Bonds Charts: Weekly Speculator Bets led by 2-Year, SOFR 3M & 5-Year Bonds Jul 18, 2026
- COT Energy Charts: Weekly Speculator Bets led by Brent Oil & Heating Oil Jul 18, 2026
- COT Soft Commodities Charts: Weekly Speculator Bets led by Wheat, Corn & Soybean Meal Jul 18, 2026
- The Bank of Canada kept its interest rate unchanged. Platinum prices reached a three‑week high Jul 16, 2026
- Stock indices rose after the release of US inflation data. China’s GDP slowed sharply Jul 15, 2026
- GBP/USD Awaits Political News: What Will Happen Next Jul 15, 2026
- USD/JPY Holds at Highs: Pressure Lingers on Yen Jul 14, 2026
- Oil prices jumped 4% amid a new wave of escalation between the US and Iran Jul 13, 2026
- EUR/USD: US Inflation Will Determine Everything Jul 13, 2026