By InvestMacro
The latest update for the weekly Commitment of Traders (COT) report was released by the Commodity Futures Trading Commission (CFTC) on Friday for data ending on October 11th.
This weekly Extreme Positions report highlights the Top Most Bullish and Top Most Bearish Positions for the speculator category. Extreme positioning in these markets can foreshadow strong moves in the underlying market.
To signify an extreme position, we use the Strength Index (also known as the COT Index) of each instrument, a common method of measuring COT data. The Strength Index is simply a comparison of current trader positions against the range of positions over the previous 3 years. We use over 80 percent as extremely bullish and under 20 percent as extremely bearish. (Compare Strength Index scores across all markets in the data table or cot leaders table).
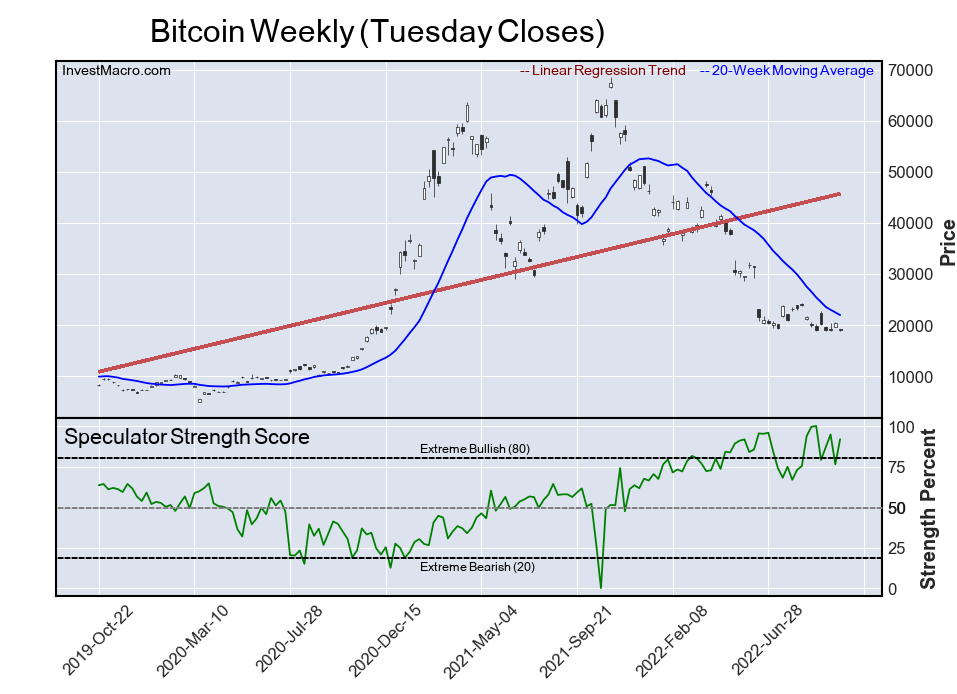
We added new charts this week that gives a trend view with the linear regression and a 20-week moving average. Note that the weekly candles close on Tuesdays to match up with the COT data and will have significant gaps.
This Week’s Most Bullish Speculator Positions:
Bitcoin
Free Reports:
 Get our Weekly Commitment of Traders Reports - See where the biggest traders (Hedge Funds and Commercial Hedgers) are positioned in the futures markets on a weekly basis.
 Download Our Metatrader 4 Indicators – Put Our Free MetaTrader 4 Custom Indicators on your charts when you join our Weekly Newsletter
The Bitcoin speculator position comes in as the most bullish extreme standing this week. The Bitcoin speculator level is currently at a 91.9 percent score of its 3-year range.
Bitcoin’s strength score jumped from 76.4 percent last week with a gain in speculator bets this week.
Nikkei 225
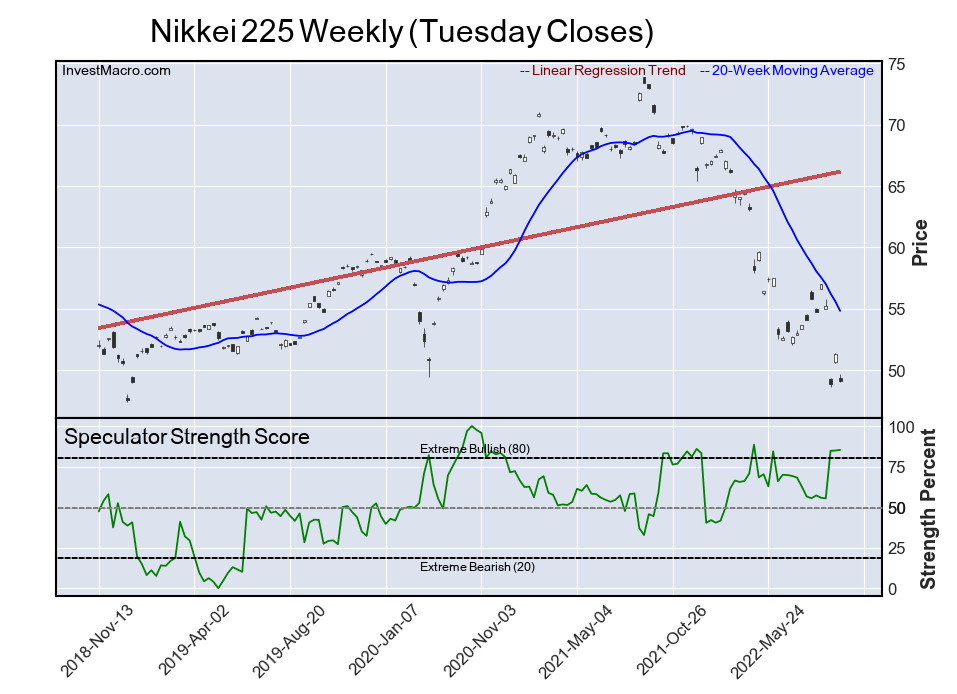
The Nikkei 225 speculator position comes next in the extreme standings this week. The Nikkei 225 speculator level is now at a 85.3 percent score of its 3-year range.
Despite the speculator extreme, the Nikkei ETF price has been on a sharp downfall as seen in the chart.
Soybean Meal
The Soybean Meal speculator position comes in third this week in the extreme standings. The Soybean Meal speculator level resides at a 81.3 percent score of its 3-year range.
This Week’s Most Bearish Speculator Positions:
Ultra 10-Year U.S. T-Note
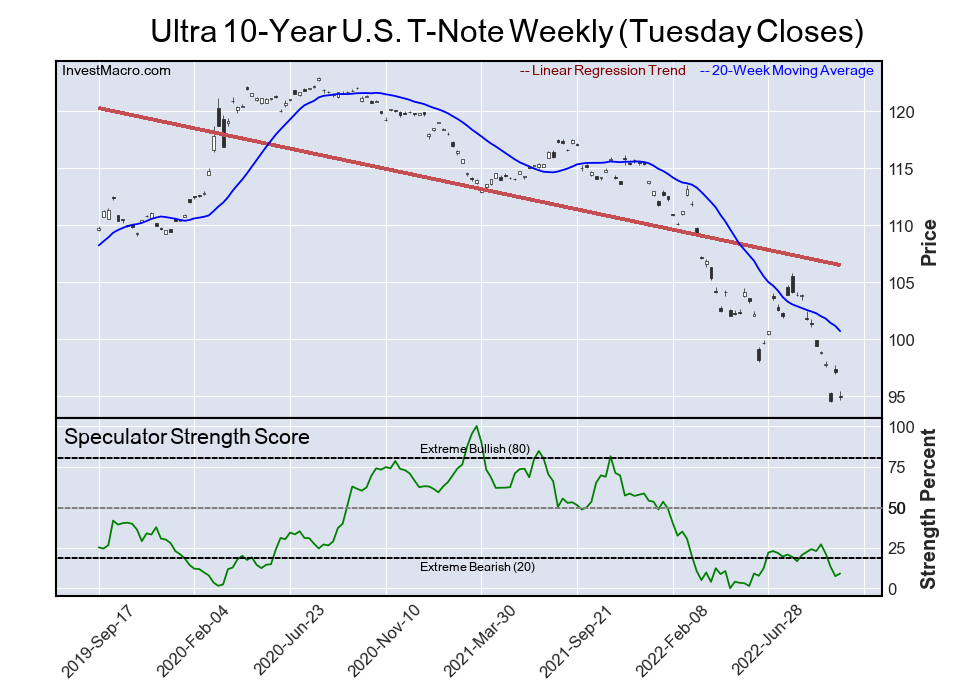
The Ultra 10-Year U.S. T-Note speculator position comes in as the most bearish extreme standing this week. The Ultra 10-Year speculator level is at just a 9.1 percent score of its 3-year range.
The Ultra 10-Year Note is a futures product that stays very close to the actual 10-Year Bond and has an approximate maturity between 9 and a half years and 10 years (Compared to the original 10-Year Bond futures that has a maturity from 7-10 years).
Canadian Dollar
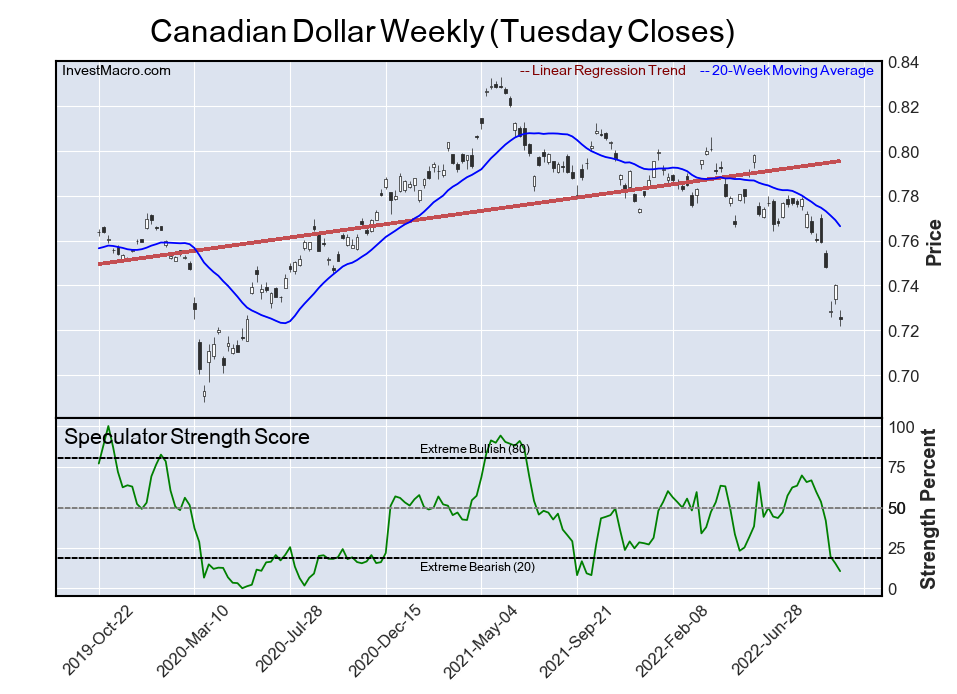
The Canadian Dollar speculator position comes in next for the most bearish extreme standing on the week. The CAD speculator level is at a 10.5 percent score of its 3-year range.
The exchange rate for the Canadian dollar against the US dollar is near two-year lows at the moment.
2-Year Bond
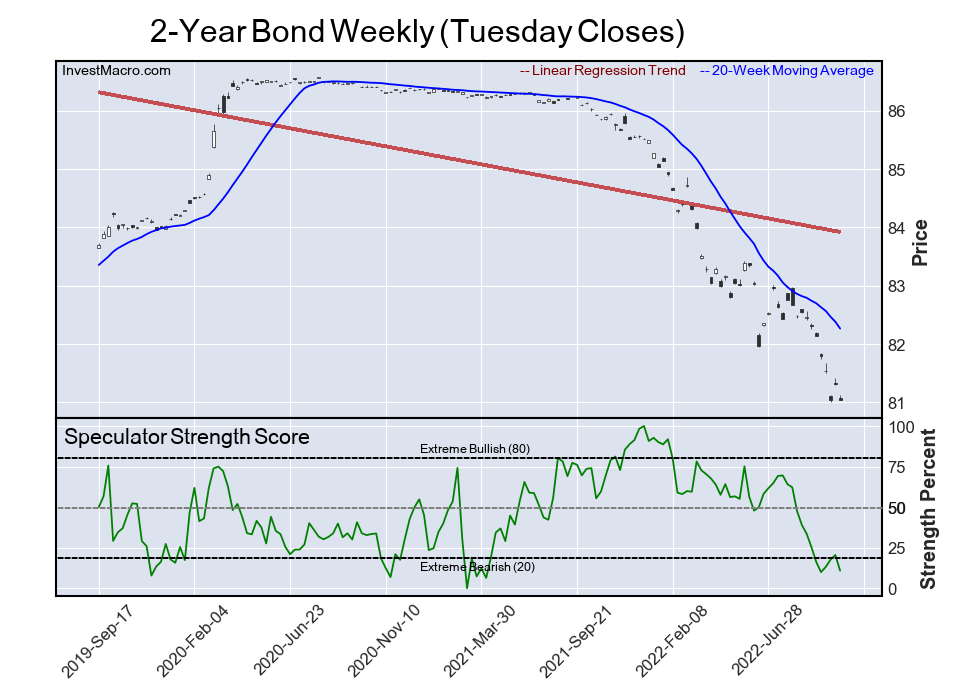
The 2-Year Bond speculator position comes in as third most bearish extreme standing of the week. The 2-Year Note speculator level resides at a 10.8 percent score of its 3-year range.
The 2-Year has been falling sharply since the US Federal Reserve started hiking interest rates and could likely continue lower as inflation remains high. The yield on the 2-Year has climbed to 4.50 percent.
MSCI EAFE MINI
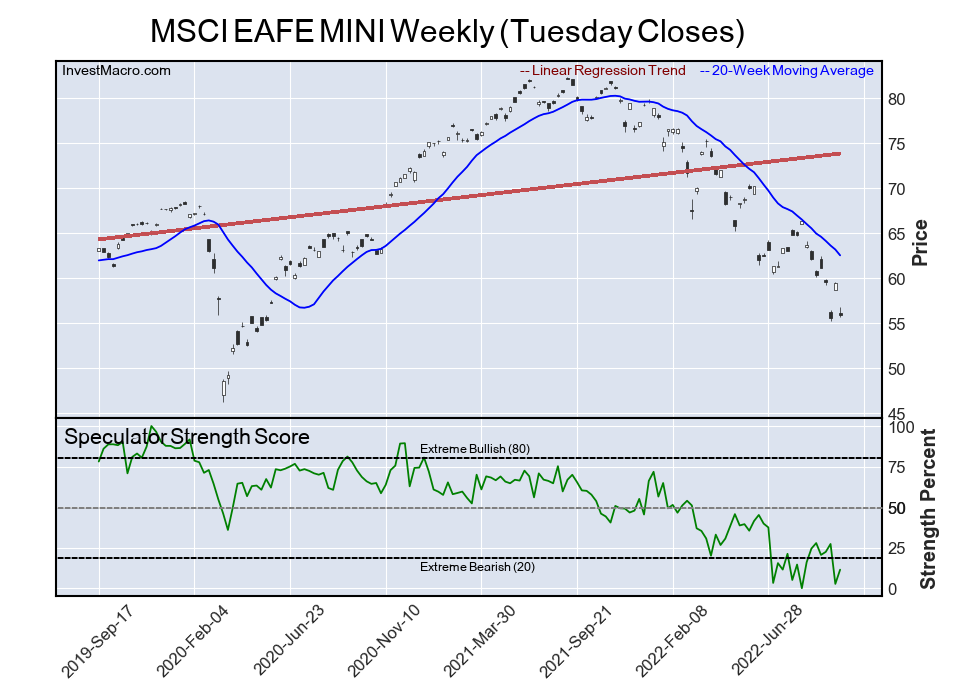
The MSCI EAFE MINI speculator position comes in as this week’s fourth most bearish extreme standing. The EAFE speculator level is at a 11.4 percent score of its 3-year range.
The EAFE ETF price has fallen with the speculator sentiment as seen on the chart and has fallen to the lowest levels since May 2020.
5-Year Bond
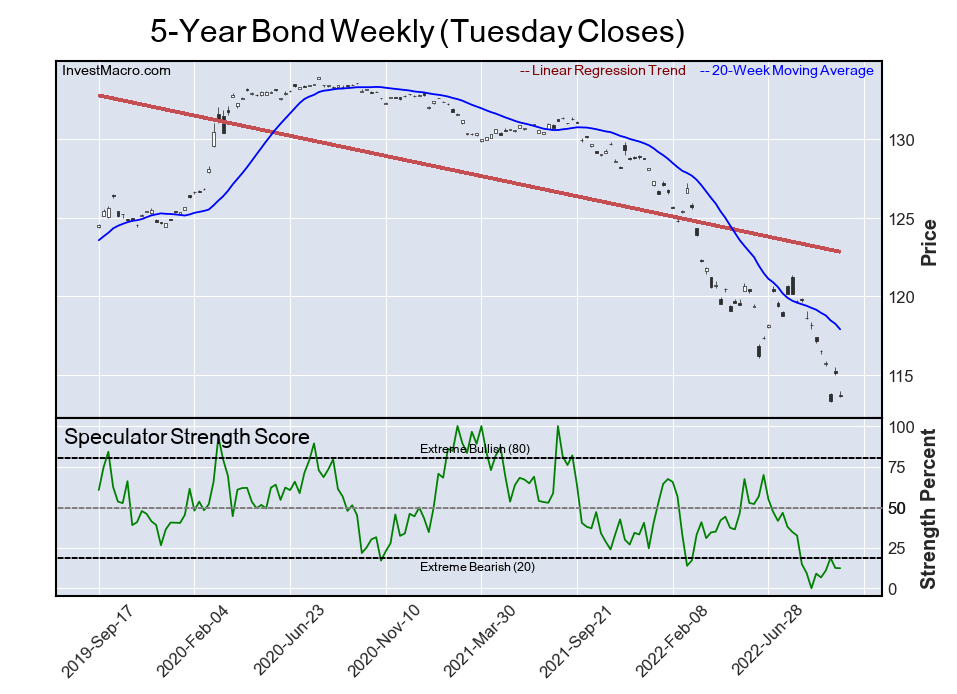
Finally, the 5-Year Bond speculator position comes in as the fifth most bearish extreme standing for this week. The 5-Year Bond speculator level is at a 12.3 percent score of its 3-year range.
Like the 2-Year, the 5-Year has been on a steep downtrend this year as the Fed and central banks around the world up their interest rates due to high inflation. Currently, this bond ETF level has fallen to the lowest price since 2011.
Article By InvestMacro – Receive our weekly COT Newsletter
*COT Report: The COT data, released weekly to the public each Friday, is updated through the most recent Tuesday (data is 3 days old) and shows a quick view of how large speculators or non-commercials (for-profit traders) were positioned in the futures markets.
The CFTC categorizes trader positions according to commercial hedgers (traders who use futures contracts for hedging as part of the business), non-commercials (large traders who speculate to realize trading profits) and nonreportable traders (usually small traders/speculators) as well as their open interest (contracts open in the market at time of reporting). See CFTC criteria here.

- COT Metals Charts: Weekly Speculator Bets led by Copper & Steel Jul 18, 2026
- COT Bonds Charts: Weekly Speculator Bets led by 2-Year, SOFR 3M & 5-Year Bonds Jul 18, 2026
- COT Energy Charts: Weekly Speculator Bets led by Brent Oil & Heating Oil Jul 18, 2026
- COT Soft Commodities Charts: Weekly Speculator Bets led by Wheat, Corn & Soybean Meal Jul 18, 2026
- The Bank of Canada kept its interest rate unchanged. Platinum prices reached a three‑week high Jul 16, 2026
- Stock indices rose after the release of US inflation data. China’s GDP slowed sharply Jul 15, 2026
- GBP/USD Awaits Political News: What Will Happen Next Jul 15, 2026
- USD/JPY Holds at Highs: Pressure Lingers on Yen Jul 14, 2026
- Oil prices jumped 4% amid a new wave of escalation between the US and Iran Jul 13, 2026
- EUR/USD: US Inflation Will Determine Everything Jul 13, 2026