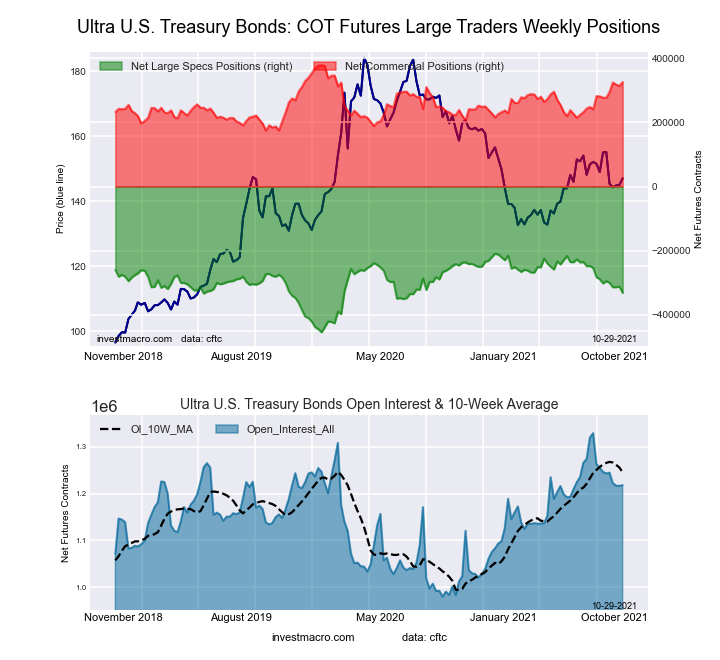
Archive for CountingPips Forex Blog – Page 23

COT Stock Market Charts: SP500 E-Mini Speculator bets rise to most bullish level in 147 weeks

By InvestMacro | COT | Data Tables | COT Leaders | Downloads | COT Newsletter

Here are the latest charts and statistics for the Commitment of Traders (COT) data published by the Commodities Futures Trading Commission (CFTC).

The latest COT data is updated through Tuesday November 2nd 2021 and shows a quick view of how large traders (for-profit speculators and commercial entities) were positioned in the futures markets.

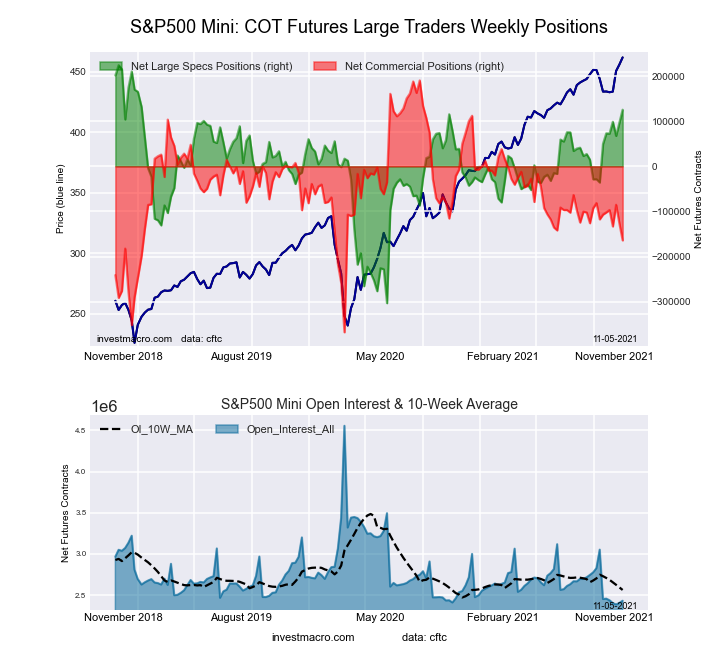
Highlighting this week’s COT Stock Market data is the S&P Mini speculator’s bullish bets. Speculator net positions jumped by 29,014 contracts this week to an overall bullish standing of 125,502 contracts. This marks the highest total net position of the past one hundred and forty-seven weeks, dating back to January of 2019. The S&P Mini contracts have risen by a total of 161,344 contracts in just the past seven weeks, bringing the net position out of negative territory on September 14th to this week’s two and a half year high.


Data Snapshot of Stock Market Traders | Columns Legend
Nov-02-2021OIOI-IndexSpec-NetSpec-IndexCom-NetCOM-IndexSmalls-NetSmalls-Index
S&P500-Mini2,431,9312125,50281-164,1213638,61934
Nikkei 22517,1138-14657-2,393442,53959
Nasdaq-Mini255,587467,219791,76128-8,98024
DowJones-Mini114,131905,08842-8,907513,81959
VIX353,54943-103,28644106,88256-3,59643
Nikkei 225 Yen55,756371,8852727,66198-29,54622


VIX Volatility Futures:

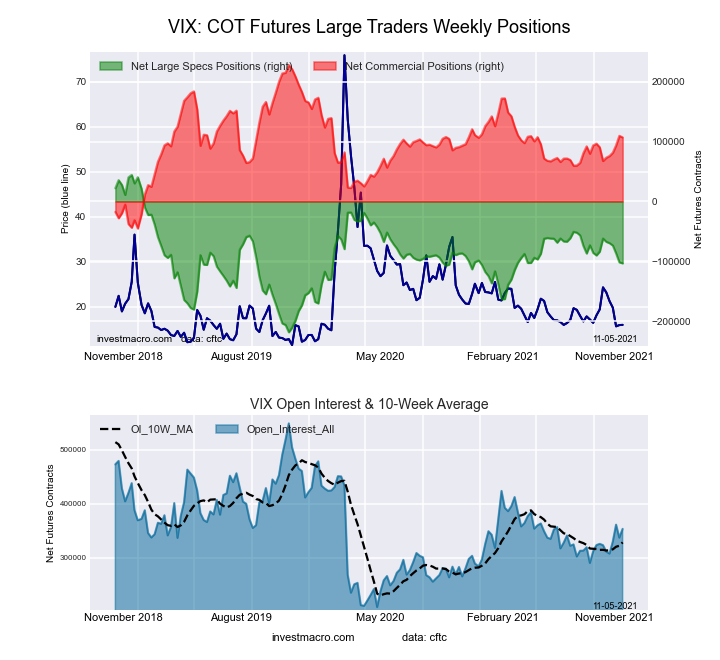
Federal Funds 30-Day Bonds Futures COT ChartThe VIX Volatility large speculator standing this week equaled a net position of -103,286 contracts in the data reported through Tuesday. This was a weekly lowering of -1,690 contracts from the previous week which had a total of -101,596 net contracts.

This week’s current strength score (the trader positioning range over the past three years, measured from 0 to 100) shows the speculators are currently Bearish with a score of 43.8 percent. The commercials are Bullish with a score of 55.8 percent and the small traders (not shown in chart) are Bearish with a score of 42.8 percent.

VIX Volatility Futures StatisticsSPECULATORSCOMMERCIALSSMALL TRADERS
– Percent of Open Interest Longs:19.455.37.3
– Percent of Open Interest Shorts:48.625.18.3
– Net Position:-103,286106,882-3,596
– Gross Longs:68,514195,58625,773
– Gross Shorts:171,80088,70429,369
– Long to Short Ratio:0.4 to 12.2 to 10.9 to 1
NET POSITION TREND:
– COT Index Score (3 Year Range Pct):43.855.842.8
– COT Index Reading (3 Year Range):BearishBullishBearish
NET POSITION MOVEMENT INDEX:
– 6-Week Change in Strength Index:-15.714.47.8


S&P500 Mini Futures:

2-Year Treasury Bonds Futures COT ChartThe S&P500 Mini large speculator standing this week equaled a net position of 125,502 contracts in the data reported through Tuesday. This was a weekly gain of 29,014 contracts from the previous week which had a total of 96,488 net contracts.

This week’s current strength score (the trader positioning range over the past three years, measured from 0 to 100) shows the speculators are currently Bullish-Extreme with a score of 81.3 percent. The commercials are Bearish with a score of 36.5 percent and the small traders (not shown in chart) are Bearish with a score of 34.5 percent.

S&P500 Mini Futures StatisticsSPECULATORSCOMMERCIALSSMALL TRADERS
– Percent of Open Interest Longs:15.270.611.3
– Percent of Open Interest Shorts:10.177.49.8
– Net Position:125,502-164,12138,619
– Gross Longs:370,7161,717,083275,903
– Gross Shorts:245,2141,881,204237,284
– Long to Short Ratio:1.5 to 10.9 to 11.2 to 1
NET POSITION TREND:
– COT Index Score (3 Year Range Pct):81.336.534.5
– COT Index Reading (3 Year Range):Bullish-ExtremeBearishBearish
NET POSITION MOVEMENT INDEX:
– 6-Week Change in Strength Index:14.3-10.2-3.9


Dow Jones Mini Futures:

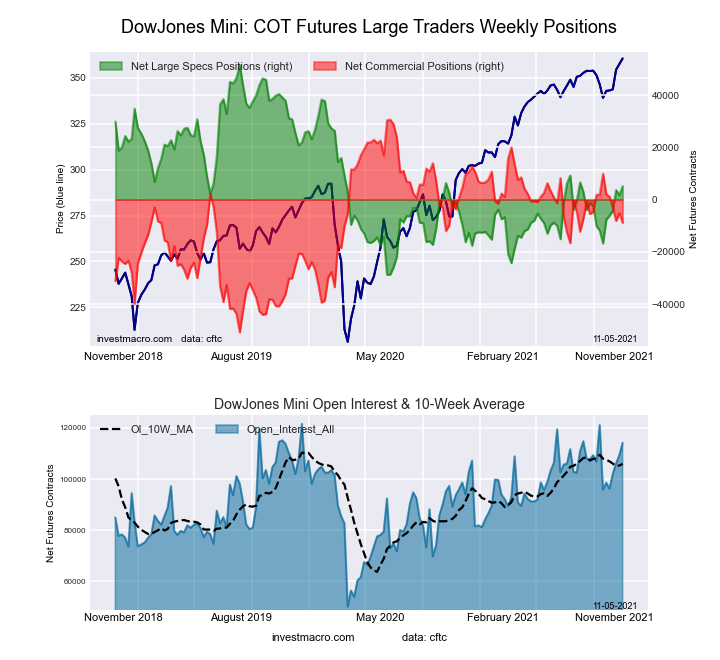
5-Year Treasury Bonds Futures COT ChartThe Dow Jones Mini large speculator standing this week equaled a net position of 5,088 contracts in the data reported through Tuesday. This was a weekly boost of 3,351 contracts from the previous week which had a total of 1,737 net contracts.

This week’s current strength score (the trader positioning range over the past three years, measured from 0 to 100) shows the speculators are currently Bearish with a score of 42.2 percent. The commercials are Bullish with a score of 51.5 percent and the small traders (not shown in chart) are Bullish with a score of 58.9 percent.

Dow Jones Mini Futures StatisticsSPECULATORSCOMMERCIALSSMALL TRADERS
– Percent of Open Interest Longs:40.242.216.0
– Percent of Open Interest Shorts:35.850.012.6
– Net Position:5,088-8,9073,819
– Gross Longs:45,90248,20018,221
– Gross Shorts:40,81457,10714,402
– Long to Short Ratio:1.1 to 10.8 to 11.3 to 1
NET POSITION TREND:
– COT Index Score (3 Year Range Pct):42.251.558.9
– COT Index Reading (3 Year Range):BearishBullishBullish
NET POSITION MOVEMENT INDEX:
– 6-Week Change in Strength Index:27.3-23.1-16.5


Nasdaq Mini Futures:

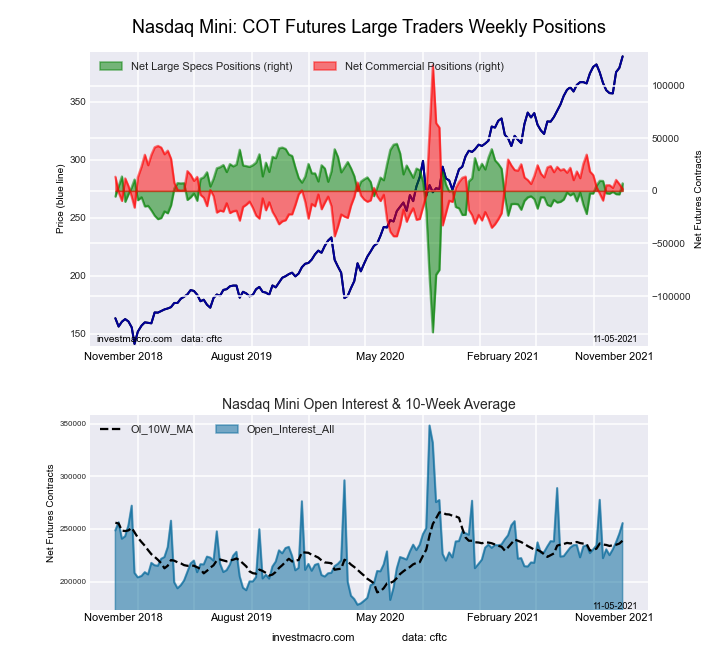
10-Year Treasury Notes Bonds Futures COT ChartThe Nasdaq Mini large speculator standing this week equaled a net position of 7,219 contracts in the data reported through Tuesday. This was a weekly lift of 10,474 contracts from the previous week which had a total of -3,255 net contracts.

This week’s current strength score (the trader positioning range over the past three years, measured from 0 to 100) shows the speculators are currently Bullish with a score of 79.1 percent. The commercials are Bearish with a score of 27.6 percent and the small traders (not shown in chart) are Bearish with a score of 23.8 percent.

Nasdaq Mini Futures StatisticsSPECULATORSCOMMERCIALSSMALL TRADERS
– Percent of Open Interest Longs:28.056.614.1
– Percent of Open Interest Shorts:25.255.917.6
– Net Position:7,2191,761-8,980
– Gross Longs:71,515144,58936,010
– Gross Shorts:64,296142,82844,990
– Long to Short Ratio:1.1 to 11.0 to 10.8 to 1
NET POSITION TREND:
– COT Index Score (3 Year Range Pct):79.127.623.8
– COT Index Reading (3 Year Range):BullishBearishBearish
NET POSITION MOVEMENT INDEX:
– 6-Week Change in Strength Index:-1.26.7-19.5


Russell 2000 Mini Futures:

Ultra 10-Year Treasury Notes Bonds Futures COT ChartThe Russell 2000 Mini large speculator standing this week equaled a net position of -38,171 contracts in the data reported through Tuesday. This was a weekly boost of 16,260 contracts from the previous week which had a total of -54,431 net contracts.

This week’s current strength score (the trader positioning range over the past three years, measured from 0 to 100) shows the speculators are currently Bearish with a score of 34.4 percent. The commercials are Bullish with a score of 58.8 percent and the small traders (not shown in chart) are Bullish with a score of 77.8 percent.

Russell 2000 Mini Futures StatisticsSPECULATORSCOMMERCIALSSMALL TRADERS
– Percent of Open Interest Longs:15.076.27.8
– Percent of Open Interest Shorts:23.471.34.3
– Net Position:-38,17122,32215,849
– Gross Longs:68,416347,05535,461
– Gross Shorts:106,587324,73319,612
– Long to Short Ratio:0.6 to 11.1 to 11.8 to 1
NET POSITION TREND:
– COT Index Score (3 Year Range Pct):34.458.877.8
– COT Index Reading (3 Year Range):BearishBullishBullish
NET POSITION MOVEMENT INDEX:
– 6-Week Change in Strength Index:19.3-24.124.8


Nikkei Stock Average (USD) Futures:

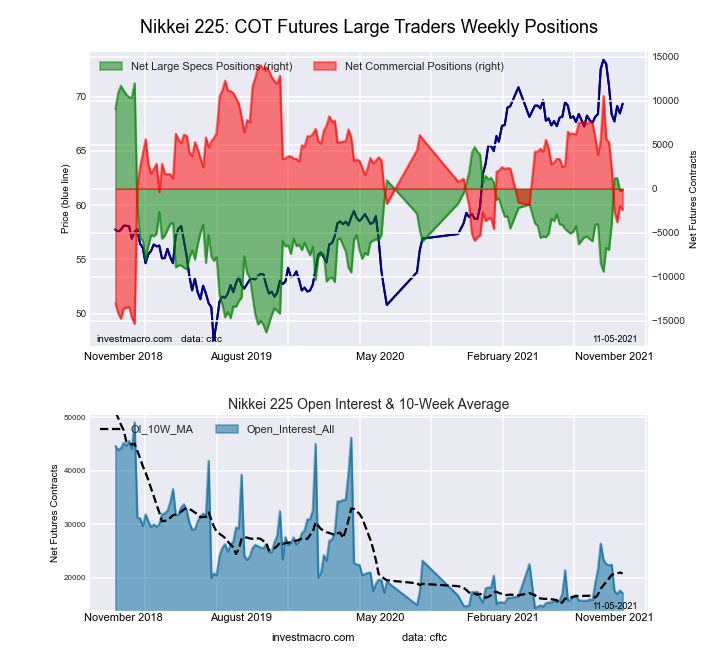
US Year Treasury Notes Long Bonds Futures COT ChartThe Nikkei Stock Average (USD) large speculator standing this week equaled a net position of -146 contracts in the data reported through Tuesday. This was a weekly advance of 116 contracts from the previous week which had a total of -262 net contracts.

This week’s current strength score (the trader positioning range over the past three years, measured from 0 to 100) shows the speculators are currently Bullish with a score of 57.1 percent. The commercials are Bearish with a score of 44.1 percent and the small traders (not shown in chart) are Bullish with a score of 59.4 percent.

Nikkei Stock Average Futures StatisticsSPECULATORSCOMMERCIALSSMALL TRADERS
– Percent of Open Interest Longs:16.655.827.4
– Percent of Open Interest Shorts:17.469.812.6
– Net Position:-146-2,3932,539
– Gross Longs:2,8399,5564,694
– Gross Shorts:2,98511,9492,155
– Long to Short Ratio:1.0 to 10.8 to 12.2 to 1
NET POSITION TREND:
– COT Index Score (3 Year Range Pct):57.144.159.4
– COT Index Reading (3 Year Range):BullishBearishBullish
NET POSITION MOVEMENT INDEX:
– 6-Week Change in Strength Index:23.1-27.318.9


MSCI EAFE Mini Futures:

Ultra US Year Treasury Notes Long Bonds Futures COT ChartThe MSCI EAFE Mini large speculator standing this week equaled a net position of 4,194 contracts in the data reported through Tuesday. This was a weekly fall of -1,581 contracts from the previous week which had a total of 5,775 net contracts.

This week’s current strength score (the trader positioning range over the past three years, measured from 0 to 100) shows the speculators are currently Bearish-Extreme with a score of 12.5 percent. The commercials are Bullish-Extreme with a score of 82.5 percent and the small traders (not shown in chart) are Bullish with a score of 57.6 percent.

MSCI EAFE Mini Futures StatisticsSPECULATORSCOMMERCIALSSMALL TRADERS
– Percent of Open Interest Longs:6.790.32.6
– Percent of Open Interest Shorts:5.792.61.5
– Net Position:4,194-8,7954,601
– Gross Longs:26,738358,99210,509
– Gross Shorts:22,544367,7875,908
– Long to Short Ratio:1.2 to 11.0 to 11.8 to 1
NET POSITION TREND:
– COT Index Score (3 Year Range Pct):12.582.557.6
– COT Index Reading (3 Year Range):Bearish-ExtremeBullish-ExtremeBullish
NET POSITION MOVEMENT INDEX:
– 6-Week Change in Strength Index:-31.832.8-7.2


Article By InvestMacroReceive our weekly COT Reports by Email

*COT Report: The COT data, released weekly to the public each Friday, is updated through the most recent Tuesday (data is 3 days old) and shows a quick view of how large speculators or non-commercials (for-profit traders) were positioned in the futures markets.

The CFTC categorizes trader positions according to commercial hedgers (traders who use futures contracts for hedging as part of the business), non-commercials (large traders who speculate to realize trading profits) and nonreportable traders (usually small traders/speculators) as well as their open interest (contracts open in the market at time of reporting).See CFTC criteria here.

COT Speculator Extremes: Brent, Palladium lead weekly Bullish & Bearish Positions

By InvestMacro | COT | Data Tables | COT Leaders | Downloads | COT Newsletter

The latest update for the weekly Commitment of Traders (COT) report was released by the Commodity Futures Trading Commission (CFTC) on Friday for data ending on November 2nd 2021.

This weekly Extreme Positions report highlights the Top 5 Most Bullish and Top 5 Most Bearish Positions for the speculator category. Extreme positioning in these markets can foreshadow strong moves in the underlying market.

To signify an extreme position, we use the Strength Index (also known as the COT Index) of each instrument, a common method of measuring COT data. The Strength Index is simply a comparison of current trader positions against the range of positions over the previous 3 years. We use over 80 percent as extremely bullish and under 20 percent as extremely bearish. (Compare Strength Index scores across all markets in the data table or cot leaders table)


Speculators or Non-Commercials Notes:

Speculators, classified as non-commercial traders by the CFTC, are made up of large commodity funds, hedge funds and other significant for-profit participants. The Specs are generally regarded as trend-followers in their behavior towards price action – net speculator bets and prices tend to go in the same directions. These traders often look to buy when prices are rising and sell when prices are falling. To illustrate this point, many times speculator contracts can be found at their most extremes (bullish or bearish) when prices are also close to their highest or lowest levels.

These extreme levels can be dangerous for the large speculators as the trade is most crowded, there is less trading ammunition still sitting on the sidelines to push the trend further and prices have moved a significant distance. When the trend becomes exhausted, some speculators take profits while others look to also exit positions when prices fail to continue in the same direction. This process usually plays out over many months to years and can ultimately create a reverse effect where prices start to fall and speculators start a process of selling when prices are falling.


Here Are This Week’s Most Bullish Speculator Positions:

Brent Oil

The Brent Oil speculator trader’s futures position comes in as the most bullish extreme standing this week. The Brent speculator level is currently at a 100 percent score of its 3-year range.

The speculator position totaled -12,714 net contracts this week which was a change by 5,096 contracts from last week. The speculator long position was a total of 46,286 contracts compared to the total spec short position of 59,000 contracts.


Coffee Futures

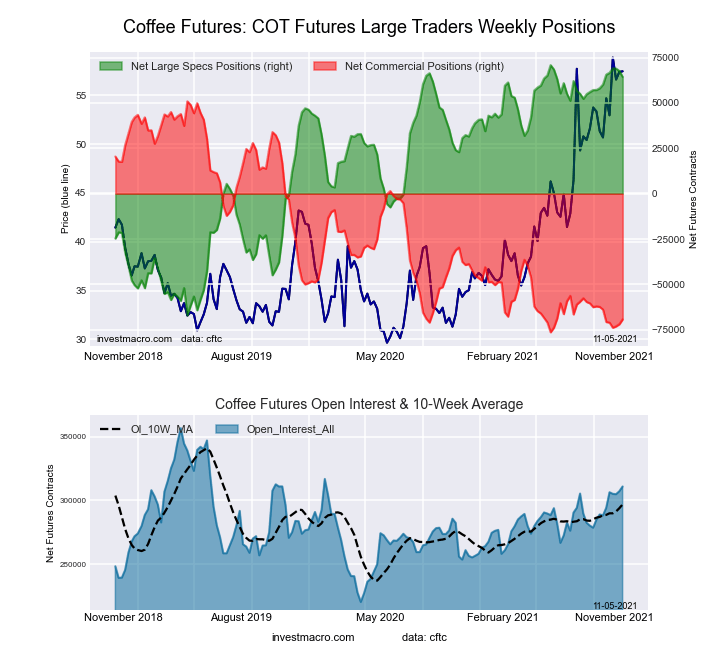
The Coffee Futures speculator trader’s futures position comes next in the extreme standings this week. The Coffee speculator level is now at a 95 percent score of its 3-year range.

The speculator position was 64,353 net contracts this week, a change by -3,240 contracts from last week. The speculator long position was a total of 83,481 contracts versus the total speculator short position of 19,128 contracts.


New Zealand Dollar

The New Zealand Dollar speculator trader’s futures position comes in third this week in the extreme standings. The NZD speculator level resides at a 95 percent score of its 3-year range.

The speculator position was 13,861 net contracts this week which marked a change by 4,955 contracts from last week. The speculator long position was a total of 27,504 contracts versus the total speculator short position of 13,643 contracts.


US Dollar Index

The US Dollar Index speculator trader’s futures position comes up number four in the extreme standings this week. The USD Index speculator level is at a 86 percent score of its 3-year range.

The speculator position was 34,982 net contracts this week and changed by 525 contracts from last week. The speculator long position was a total of 45,395 contracts against the total spec short position of 10,413 contracts.


British Pound

The British Pound speculator trader’s futures position rounds out the top five in this week’s bullish extreme standings. The GBP speculator level sits at a 85 percent score of its 3-year range.

The speculator position was 15,047 net contracts this week which was a move of 94 contracts from last week. The speculator long position was a total of 57,255 contracts in comparison to the total speculator short position of 42,208 contracts.


This Week’s Most Bearish Speculator Positions:

Palladium

The Palladium speculator trader’s futures position comes in as the most bearish extreme standing this week. The Palladium speculator level is at a 0 percent score of its 3-year range.

The speculator position was -3,391 net contracts this week, a weekly change of -437 contracts from last week. The speculator long position was a total of 2,482 contracts versus the total spec short position of 5,873 contracts.


Mexican Peso

The Mexican Peso speculator trader’s futures position comes in next for the most bearish extreme standing on the week. The MXN speculator level is at a 0 percent score of its 3-year range.

The speculator position was -51,018 net contracts this week which was a change by -7,729 contracts from last week. The speculator long position was a total of 61,553 contracts compared to the total speculator short position of 112,571 contracts.


Japanese Yen

The Japanese Yen speculator trader’s futures position comes in as third most bearish extreme standing of the week. The JPY speculator level resides at a 1 percent score of its 3-year range.

The speculator position was -107,624 net contracts this week saw movement by -588 contracts from last week. The speculator long position was a total of 20,337 contracts against the total spec short position of 127,961 contracts.


Australian Dollar

The Australian Dollar speculator trader’s futures position comes in as this week’s fourth most bearish extreme standing. The AUD speculator level is at a 14 percent score of its 3-year range.

The speculator position was -75,496 net contracts this week which was a change by -250 contracts on the week. The speculator long position was a total of 19,187 contracts versus the total speculator short position of 94,683 contracts.


Platinum

Finally, the Platinum speculator trader’s futures position comes in as the fifth most bearish extreme standing for this week. The Platinum speculator level is at a 25 percent score of its 3-year range.

The speculator position was 15,364 net contracts this week and changed by 462 contracts from last week. The speculator long position was a total of 28,870 contracts compared to the total spec short position of 13,506 contracts.


Article By InvestMacroReceive our weekly COT Reports by Email

*COT Report: The COT data, released weekly to the public each Friday, is updated through the most recent Tuesday (data is 3 days old) and shows a quick view of how large speculators or non-commercials (for-profit traders) were positioned in the futures markets.

The CFTC categorizes trader positions according to commercial hedgers (traders who use futures contracts for hedging as part of the business), non-commercials (large traders who speculate to realize trading profits) and nonreportable traders (usually small traders/speculators) as well as their open interest (contracts open in the market at time of reporting).See CFTC criteria here.


COT Metals Charts: Palladium Speculator bets hit lowest on record

By InvestMacro | COT | Data Tables | COT Leaders | Downloads | COT Newsletter

Here are the latest charts and statistics for the Commitment of Traders (COT) data published by the Commodities Futures Trading Commission (CFTC).

The latest COT data is updated through Tuesday November 2nd 2021 and shows a quick view of how large traders (for-profit speculators and commercial entities) were positioned in the futures markets.

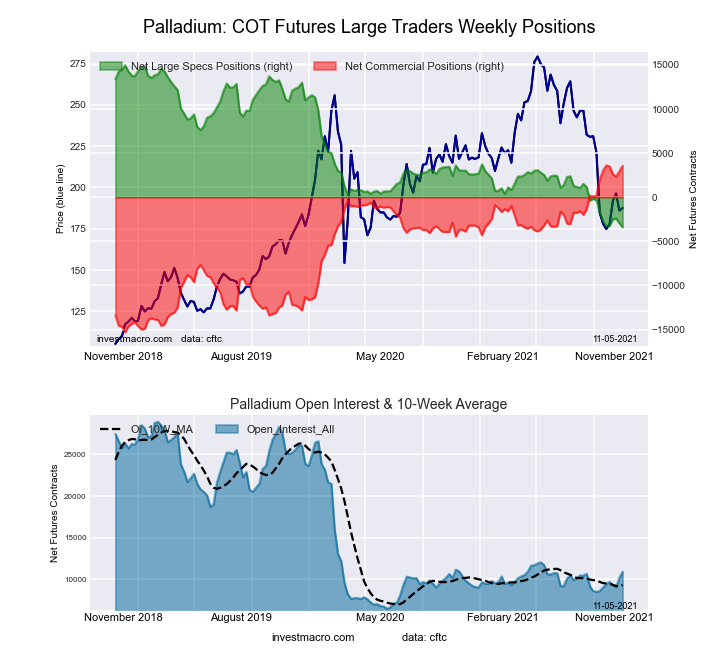
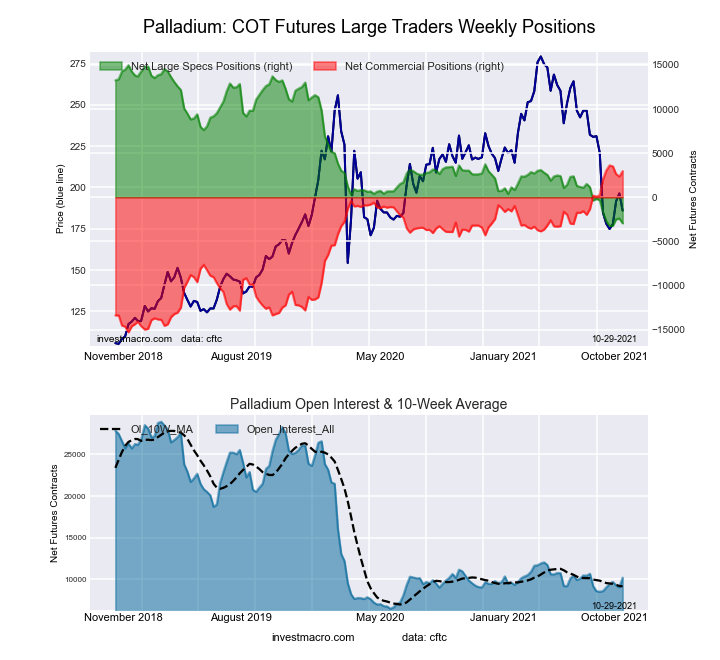
Highlighting this week’s COT metals data is the speculator’s bearishness in Palladium. The Palladium speculative position continues to see weakness and has fallen for eight out of the past twelve weeks. The overall position has now been in bearish territory for eleven straight weeks after dropping from bullish to bearish on August 24th. Palladium net spec positions are usually always in bullish territory with very few instances of net bearish levels in the data history. The current net position at -3,391 contracts marks the most bearish speculator level for Palladium on record, according to the CFTC data which goes back to 1986.


Data Snapshot of Commodity Market Traders | Columns Legend
Nov-02-2021OIOI-IndexSpec-NetSpec-IndexCom-NetCOM-IndexSmalls-NetSmalls-Index
WTI Crude2,121,46129419,29346-461,5164442,22375
Gold507,61627215,12962-239,8773824,74840
Silver141,394833,11555-48,8605115,74532
Copper217,2163932,33566-41,294318,95977
Palladium10,92620-3,39103,574100-18334
Platinum56,5081615,36425-21,964786,60054
Natural Gas1,267,22735-137,7133793,5176044,19691
Brent183,76627-12,7141007,68805,02679
Heating Oil426,6366622,38475-45,8442223,46080
Soybeans620,172358,75645-19,88561-38,8717
Corn1,506,60222383,10979-320,38526-62,7247
Coffee310,9316664,35395-69,26464,91122
Sugar884,50721209,06180-250,8492141,78860
Wheat409,1373917,89662-11,14130-6,75569


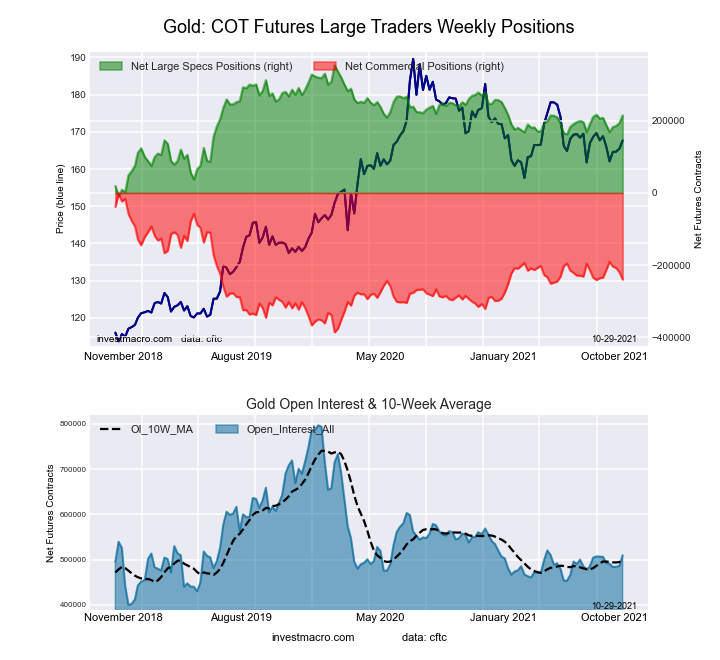
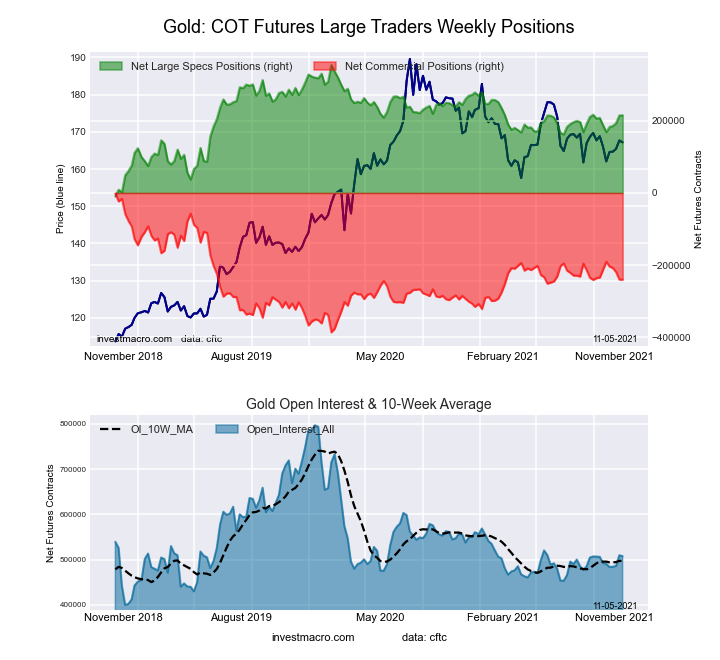
Gold Comex Futures:

Federal Funds 30-Day Bonds Futures COT ChartThe Gold Comex Futures large speculator standing this week resulted in a net position of 215,129 contracts in the data reported through Tuesday. This was a weekly gain of 569 contracts from the previous week which had a total of 214,560 net contracts.

This week’s current strength score (the trader positioning range over the past three years, measured from 0 to 100) shows the speculators are currently Bullish with a score of 61.8 percent. The commercials are Bearish with a score of 38.0 percent and the small traders (not shown in chart) are Bearish with a score of 40.2 percent.

Gold Futures StatisticsSPECULATORSCOMMERCIALSSMALL TRADERS
– Percent of Open Interest Longs:61.319.89.0
– Percent of Open Interest Shorts:18.967.14.2
– Net Position:215,129-239,87724,748
– Gross Longs:311,091100,69245,936
– Gross Shorts:95,962340,56921,188
– Long to Short Ratio:3.2 to 10.3 to 12.2 to 1
NET POSITION TREND:
– COT Index Score (3 Year Range Pct):61.838.040.2
– COT Index Reading (3 Year Range):BullishBearishBearish
NET POSITION MOVEMENT INDEX:
– 6-Week Change in Strength Index:7.6-7.1-0.6


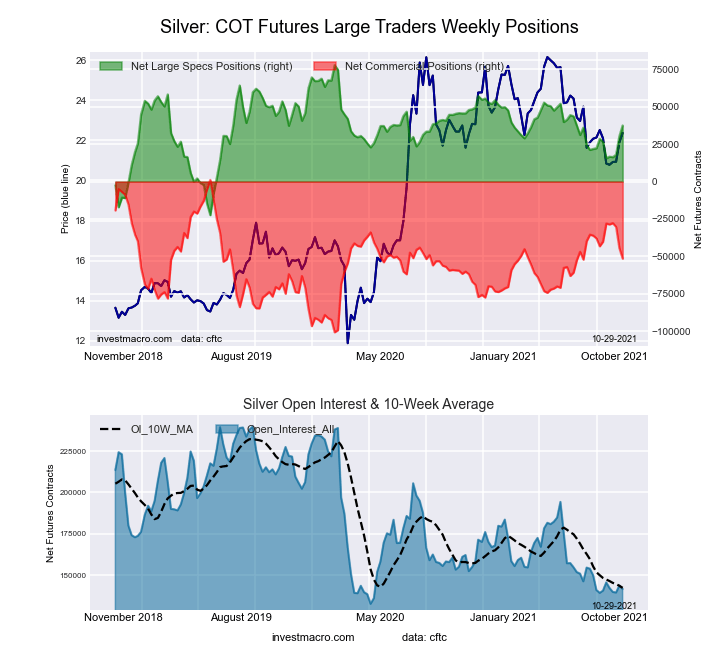
Silver Comex Futures:

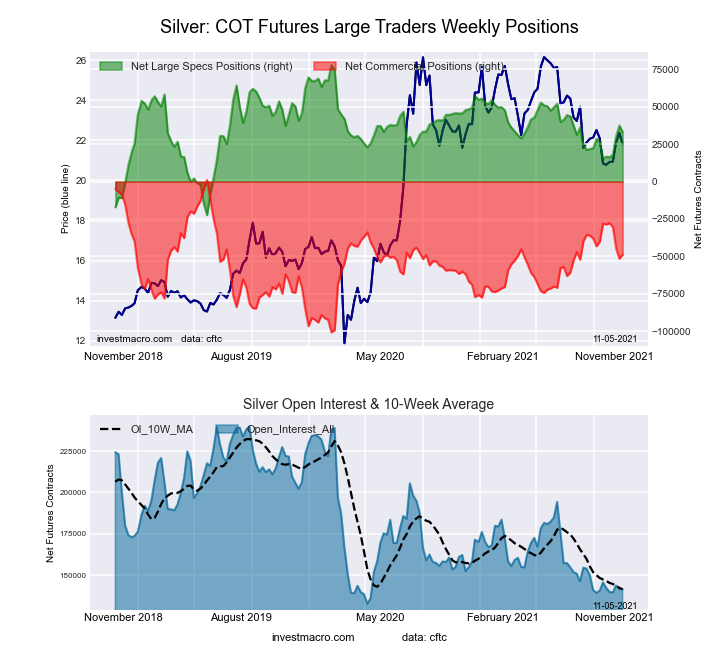
2-Year Treasury Bonds Futures COT ChartThe Silver Comex Futures large speculator standing this week resulted in a net position of 33,115 contracts in the data reported through Tuesday. This was a weekly lowering of -4,417 contracts from the previous week which had a total of 37,532 net contracts.

This week’s current strength score (the trader positioning range over the past three years, measured from 0 to 100) shows the speculators are currently Bullish with a score of 55.4 percent. The commercials are Bullish with a score of 51.0 percent and the small traders (not shown in chart) are Bearish with a score of 32.1 percent.

Silver Futures StatisticsSPECULATORSCOMMERCIALSSMALL TRADERS
– Percent of Open Interest Longs:45.629.319.2
– Percent of Open Interest Shorts:22.263.98.0
– Net Position:33,115-48,86015,745
– Gross Longs:64,50241,47327,091
– Gross Shorts:31,38790,33311,346
– Long to Short Ratio:2.1 to 10.5 to 12.4 to 1
NET POSITION TREND:
– COT Index Score (3 Year Range Pct):55.451.032.1
– COT Index Reading (3 Year Range):BullishBullishBearish
NET POSITION MOVEMENT INDEX:
– 6-Week Change in Strength Index:17.4-20.420.1


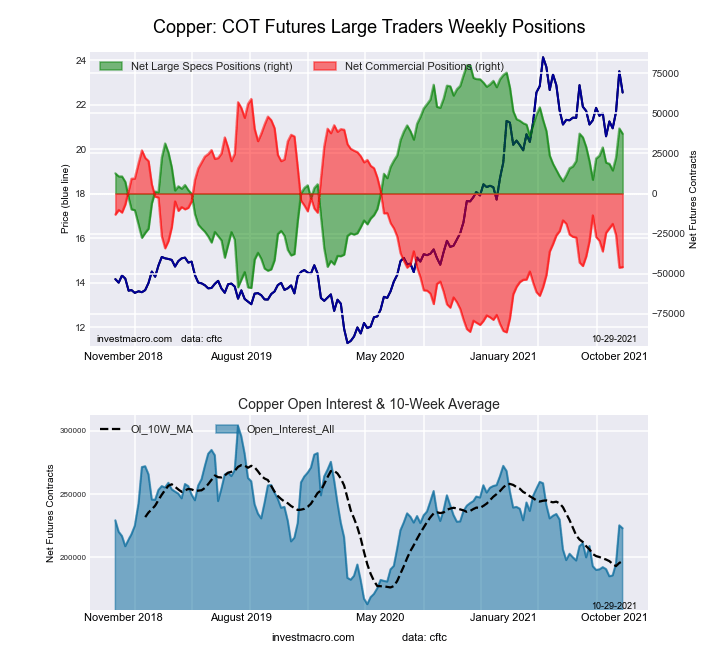
Copper Grade #1 Futures:

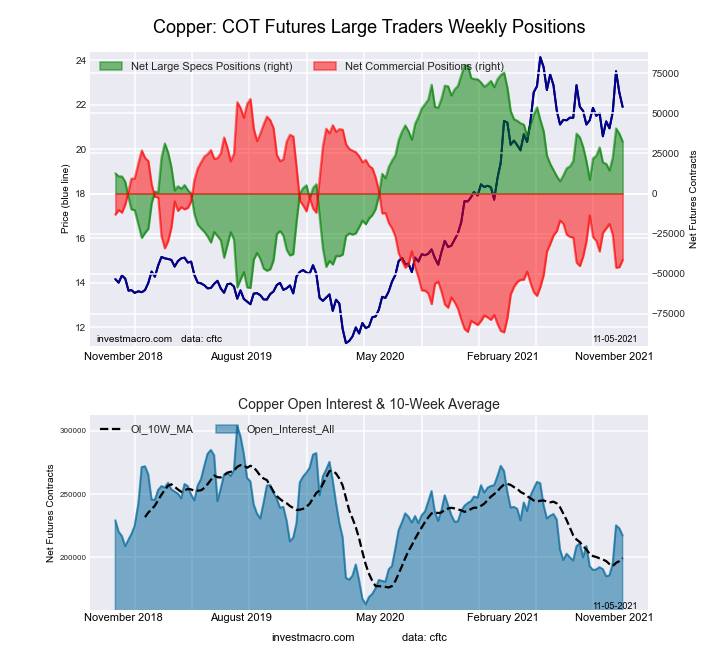
5-Year Treasury Bonds Futures COT ChartThe Copper Grade #1 Futures large speculator standing this week resulted in a net position of 32,335 contracts in the data reported through Tuesday. This was a weekly decrease of -4,944 contracts from the previous week which had a total of 37,279 net contracts.

This week’s current strength score (the trader positioning range over the past three years, measured from 0 to 100) shows the speculators are currently Bullish with a score of 65.7 percent. The commercials are Bearish with a score of 31.1 percent and the small traders (not shown in chart) are Bullish with a score of 77.1 percent.

Copper Futures StatisticsSPECULATORSCOMMERCIALSSMALL TRADERS
– Percent of Open Interest Longs:40.837.59.2
– Percent of Open Interest Shorts:25.956.55.0
– Net Position:32,335-41,2948,959
– Gross Longs:88,63281,45719,927
– Gross Shorts:56,297122,75110,968
– Long to Short Ratio:1.6 to 10.7 to 11.8 to 1
NET POSITION TREND:
– COT Index Score (3 Year Range Pct):65.731.177.1
– COT Index Reading (3 Year Range):BullishBearishBullish
NET POSITION MOVEMENT INDEX:
– 6-Week Change in Strength Index:9.4-11.621.7


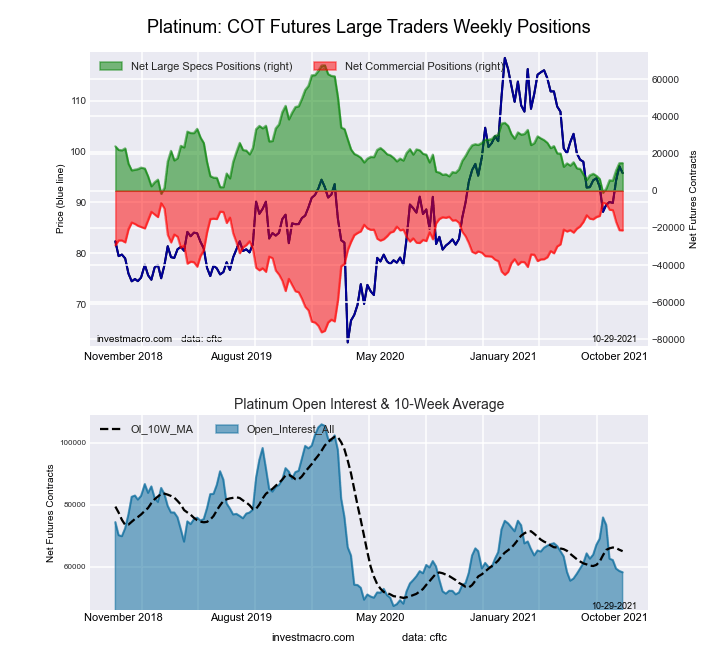
Platinum Futures:

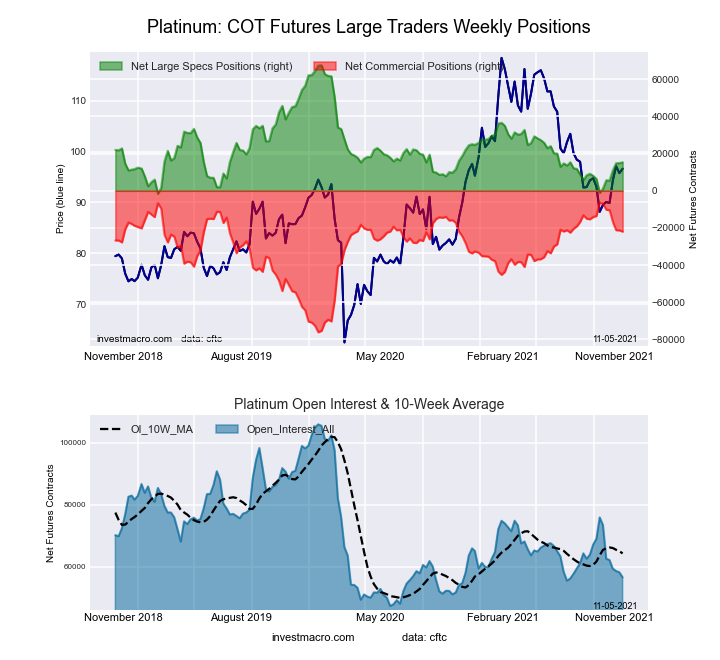
10-Year Treasury Notes Bonds Futures COT ChartThe Platinum Futures large speculator standing this week resulted in a net position of 15,364 contracts in the data reported through Tuesday. This was a weekly rise of 462 contracts from the previous week which had a total of 14,902 net contracts.

This week’s current strength score (the trader positioning range over the past three years, measured from 0 to 100) shows the speculators are currently Bearish with a score of 24.5 percent. The commercials are Bullish with a score of 77.6 percent and the small traders (not shown in chart) are Bullish with a score of 54.1 percent.

Platinum Futures StatisticsSPECULATORSCOMMERCIALSSMALL TRADERS
– Percent of Open Interest Longs:51.128.916.3
– Percent of Open Interest Shorts:23.967.74.6
– Net Position:15,364-21,9646,600
– Gross Longs:28,87016,3149,196
– Gross Shorts:13,50638,2782,596
– Long to Short Ratio:2.1 to 10.4 to 13.5 to 1
NET POSITION TREND:
– COT Index Score (3 Year Range Pct):24.577.654.1
– COT Index Reading (3 Year Range):BearishBullishBullish
NET POSITION MOVEMENT INDEX:
– 6-Week Change in Strength Index:20.4-21.411.5


Palladium Futures:

Ultra 10-Year Treasury Notes Bonds Futures COT ChartThe Palladium Futures large speculator standing this week resulted in a net position of -3,391 contracts in the data reported through Tuesday. This was a weekly decrease of -437 contracts from the previous week which had a total of -2,954 net contracts.

This week’s current strength score (the trader positioning range over the past three years, measured from 0 to 100) shows the speculators are currently Bearish-Extreme with a score of 0.0 percent. The commercials are Bullish-Extreme with a score of 99.8 percent and the small traders (not shown in chart) are Bearish with a score of 33.9 percent.

Palladium Futures StatisticsSPECULATORSCOMMERCIALSSMALL TRADERS
– Percent of Open Interest Longs:22.754.711.8
– Percent of Open Interest Shorts:53.822.013.5
– Net Position:-3,3913,574-183
– Gross Longs:2,4825,9781,287
– Gross Shorts:5,8732,4041,470
– Long to Short Ratio:0.4 to 12.5 to 10.9 to 1
NET POSITION TREND:
– COT Index Score (3 Year Range Pct):0.099.833.9
– COT Index Reading (3 Year Range):Bearish-ExtremeBullish-ExtremeBearish
NET POSITION MOVEMENT INDEX:
– 6-Week Change in Strength Index:-3.72.88.7


Article By InvestMacroReceive our weekly COT Reports by Email

*COT Report: The COT data, released weekly to the public each Friday, is updated through the most recent Tuesday (data is 3 days old) and shows a quick view of how large speculators or non-commercials (for-profit traders) were positioned in the futures markets.

The CFTC categorizes trader positions according to commercial hedgers (traders who use futures contracts for hedging as part of the business), non-commercials (large traders who speculate to realize trading profits) and nonreportable traders (usually small traders/speculators) as well as their open interest (contracts open in the market at time of reporting).See CFTC criteria here.

COT Energy Charts: Brent Crude Oil Speculator bets climb to 3-Year High

By InvestMacro | COT | Data Tables | COT Leaders | Downloads | COT Newsletter

Here are the latest charts and statistics for the Commitment of Traders (COT) data published by the Commodities Futures Trading Commission (CFTC).

The latest COT data is updated through Tuesday November 2nd 2021 and shows a quick view of how large traders (for-profit speculators and commercial entities) were positioned in the futures markets.

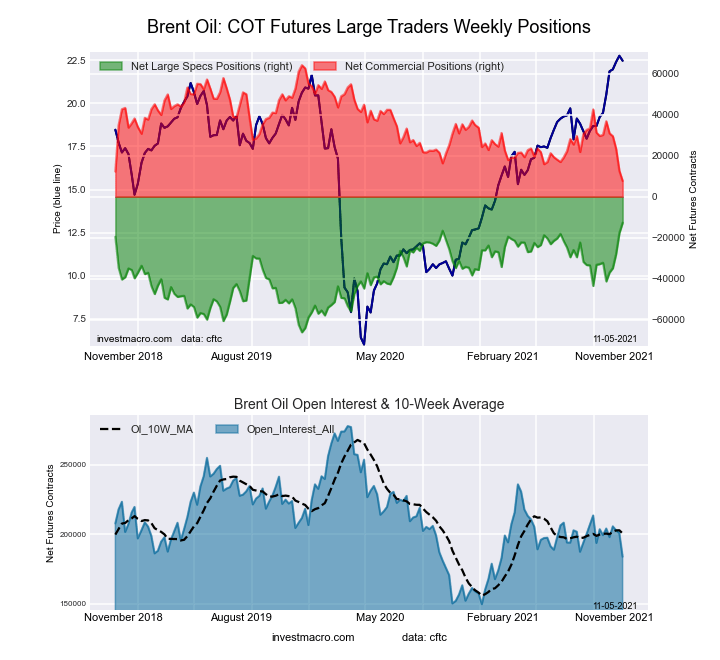
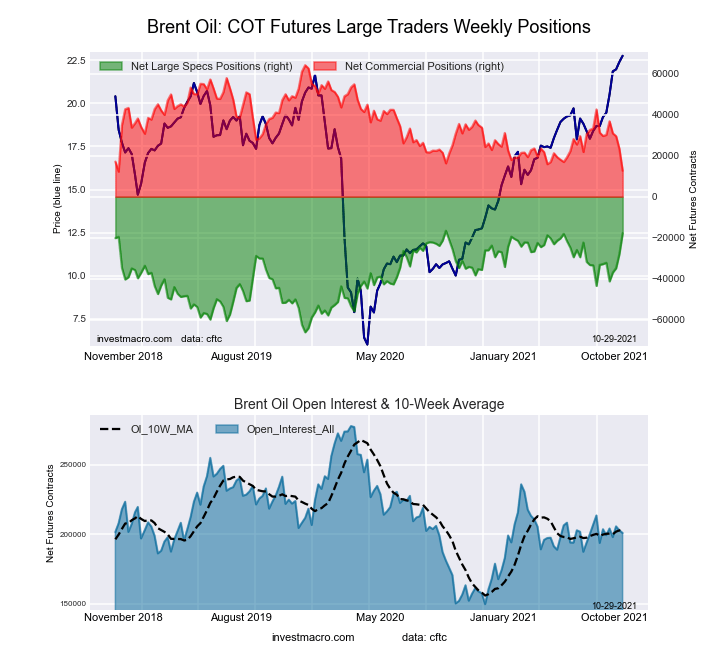
Highlighting this week’s COT Energy data is once again the Brent Oil (Last Day) contracts which have reached their best speculator position in the past one-hundred and fifty-nine weeks, dating back to October 23rd of 2018. The Brent speculative position has climbed higher for five straight weeks and for eight out the past nine weeks as well. The speculative position for Brent have continually remained in a bearish overall standing since 2013 but have been trending closer to a neutral zone lately. The strength index score (the speculative level compared to the past 3-years and used to show extremes) has risen to a score of 100 percent, showing that speculator bets are 3-year high.


Data Snapshot of Commodity Market Traders | Columns Legend
Nov-02-2021OIOI-IndexSpec-NetSpec-IndexCom-NetCOM-IndexSmalls-NetSmalls-Index
WTI Crude2,121,46129419,29346-461,5164442,22375
Gold507,61627215,12962-239,8773824,74840
Silver141,394833,11555-48,8605115,74532
Copper217,2163932,33566-41,294318,95977
Palladium10,92620-3,39103,574100-18334
Platinum56,5081615,36425-21,964786,60054
Natural Gas1,267,22735-137,7133793,5176044,19691
Brent183,76627-12,7141007,68805,02679
Heating Oil426,6366622,38475-45,8442223,46080
Soybeans620,172358,75645-19,88561-38,8717
Corn1,506,60222383,10979-320,38526-62,7247
Coffee310,9316664,35395-69,26464,91122
Sugar884,50721209,06180-250,8492141,78860
Wheat409,1373917,89662-11,14130-6,75569


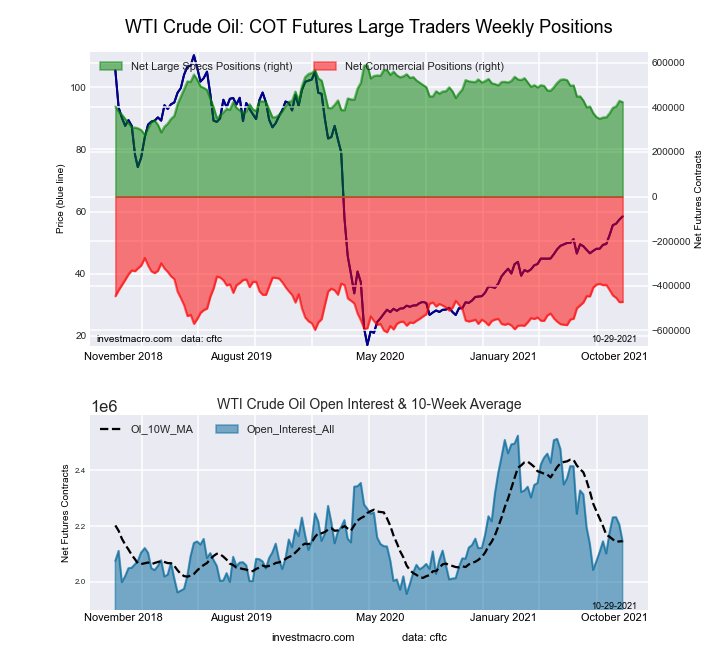
WTI Crude Oil Futures:

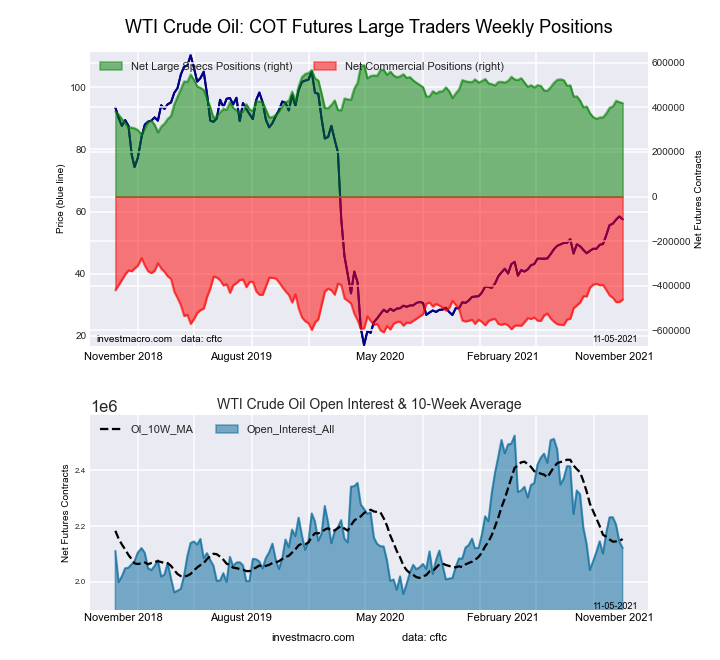
WTI Crude Oil Futures COT ChartThe WTI Crude Oil Futures large speculator standing this week resulted in a net position of 419,293 contracts in the data reported through Tuesday. This was a weekly reduction of -4,425 contracts from the previous week which had a total of 423,718 net contracts.

This week’s current strength score (the trader positioning range over the past three years, measured from 0 to 100) shows the speculators are currently Bearish with a score of 45.5 percent. The commercials are Bearish with a score of 44.1 percent and the small traders (not shown in chart) are Bullish with a score of 74.5 percent.

WTI Crude Oil Futures StatisticsSPECULATORSCOMMERCIALSSMALL TRADERS
– Percent of Open Interest Longs:25.933.24.5
– Percent of Open Interest Shorts:6.155.02.5
– Net Position:419,293-461,51642,223
– Gross Longs:548,631705,00794,536
– Gross Shorts:129,3381,166,52352,313
– Long to Short Ratio:4.2 to 10.6 to 11.8 to 1
NET POSITION TREND:
– COT Index Score (3 Year Range Pct):45.544.174.5
– COT Index Reading (3 Year Range):BearishBearishBullish
NET POSITION MOVEMENT INDEX:
– 6-Week Change in Strength Index:20.3-19.62.9


Brent Crude Oil Futures:

Brent Last Day Crude Oil Futures COT ChartThe Brent Crude Oil Futures large speculator standing this week resulted in a net position of -12,714 contracts in the data reported through Tuesday. This was a weekly advance of 5,096 contracts from the previous week which had a total of -17,810 net contracts.

This week’s current strength score (the trader positioning range over the past three years, measured from 0 to 100) shows the speculators are currently Bullish-Extreme with a score of 100.0 percent. The commercials are Bearish-Extreme with a score of 0.0 percent and the small traders (not shown in chart) are Bullish with a score of 79.5 percent.

Brent Crude Oil Futures StatisticsSPECULATORSCOMMERCIALSSMALL TRADERS
– Percent of Open Interest Longs:25.239.64.7
– Percent of Open Interest Shorts:32.135.42.0
– Net Position:-12,7147,6885,026
– Gross Longs:46,28672,7058,677
– Gross Shorts:59,00065,0173,651
– Long to Short Ratio:0.8 to 11.1 to 12.4 to 1
NET POSITION TREND:
– COT Index Score (3 Year Range Pct):100.00.079.5
– COT Index Reading (3 Year Range):Bullish-ExtremeBearish-ExtremeBullish
NET POSITION MOVEMENT INDEX:
– 6-Week Change in Strength Index:36.5-39.825.8


Natural Gas Futures:

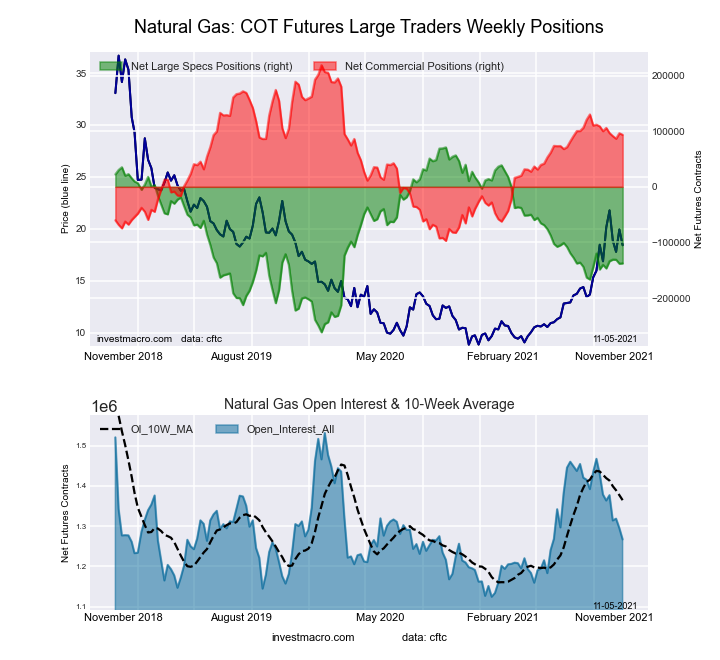
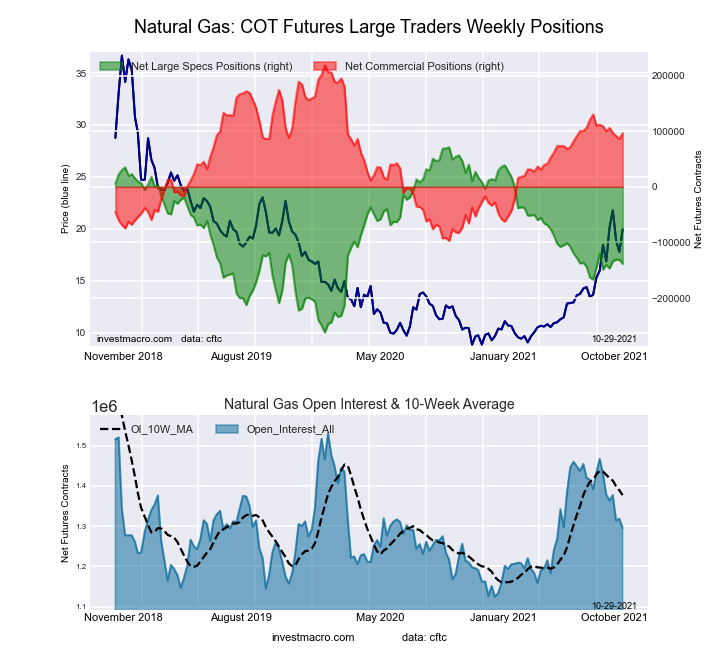
Natural Gas Futures COT ChartThe Natural Gas Futures large speculator standing this week resulted in a net position of -137,713 contracts in the data reported through Tuesday. This was a weekly boost of 475 contracts from the previous week which had a total of -138,188 net contracts.

This week’s current strength score (the trader positioning range over the past three years, measured from 0 to 100) shows the speculators are currently Bearish with a score of 37.2 percent. The commercials are Bullish with a score of 60.3 percent and the small traders (not shown in chart) are Bullish-Extreme with a score of 90.9 percent.

Natural Gas Futures StatisticsSPECULATORSCOMMERCIALSSMALL TRADERS
– Percent of Open Interest Longs:19.944.65.3
– Percent of Open Interest Shorts:30.837.21.8
– Net Position:-137,71393,51744,196
– Gross Longs:252,244565,09766,820
– Gross Shorts:389,957471,58022,624
– Long to Short Ratio:0.6 to 11.2 to 13.0 to 1
NET POSITION TREND:
– COT Index Score (3 Year Range Pct):37.260.390.9
– COT Index Reading (3 Year Range):BearishBullishBullish-Extreme
NET POSITION MOVEMENT INDEX:
– 6-Week Change in Strength Index:0.8-2.110.2


Gasoline Blendstock Futures:

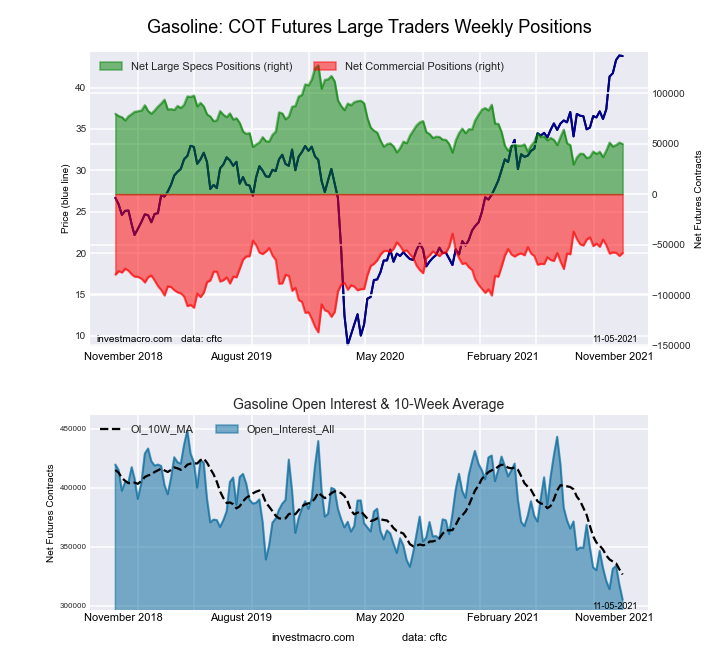
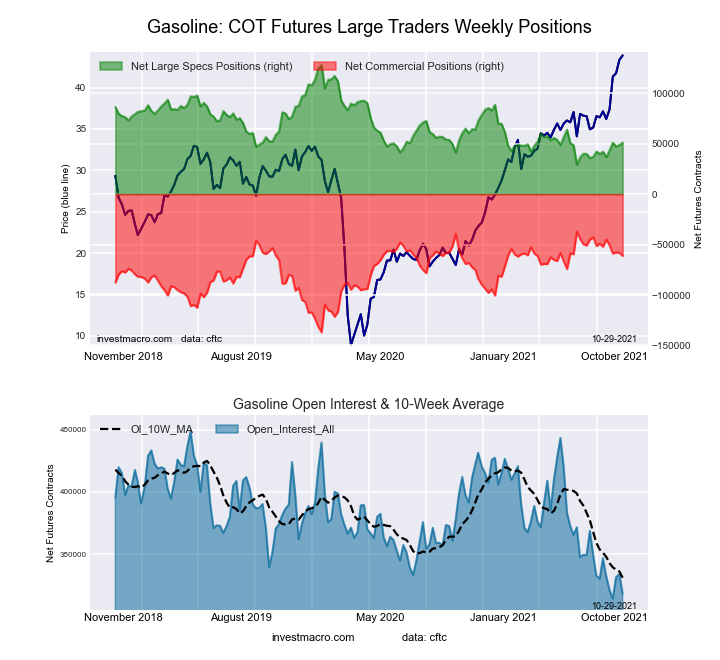
RBOB Gasoline Energy Futures COT ChartThe Gasoline Blendstock Futures large speculator standing this week resulted in a net position of 49,697 contracts in the data reported through Tuesday. This was a weekly decrease of -1,348 contracts from the previous week which had a total of 51,045 net contracts.

This week’s current strength score (the trader positioning range over the past three years, measured from 0 to 100) shows the speculators are currently Bearish with a score of 20.7 percent. The commercials are Bullish with a score of 78.7 percent and the small traders (not shown in chart) are Bullish with a score of 62.9 percent.

Nasdaq Mini Futures StatisticsSPECULATORSCOMMERCIALSSMALL TRADERS
– Percent of Open Interest Longs:35.242.16.6
– Percent of Open Interest Shorts:19.061.23.8
– Net Position:49,697-58,2948,597
– Gross Longs:107,573128,54120,227
– Gross Shorts:57,876186,83511,630
– Long to Short Ratio:1.9 to 10.7 to 11.7 to 1
NET POSITION TREND:
– COT Index Score (3 Year Range Pct):20.778.762.9
– COT Index Reading (3 Year Range):BearishBullishBullish
NET POSITION MOVEMENT INDEX:
– 6-Week Change in Strength Index:13.2-13.42.0


#2 Heating Oil NY-Harbor Futures:

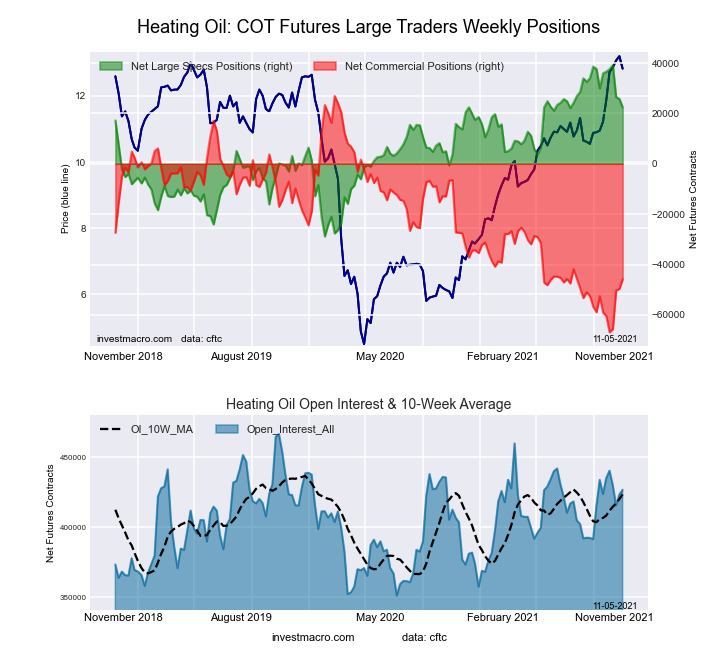
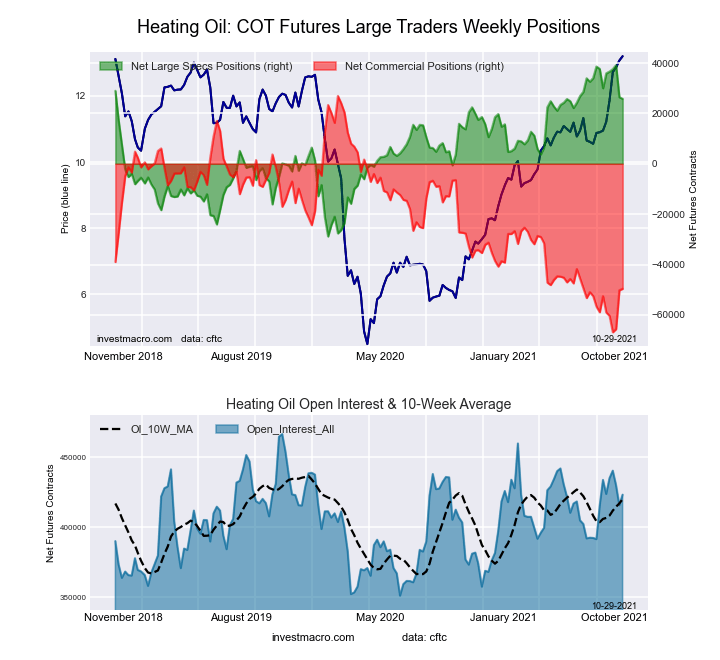
NY Harbor Heating Oil Energy Futures COT ChartThe #2 Heating Oil NY-Harbor Futures large speculator standing this week resulted in a net position of 22,384 contracts in the data reported through Tuesday. This was a weekly lowering of -3,407 contracts from the previous week which had a total of 25,791 net contracts.

This week’s current strength score (the trader positioning range over the past three years, measured from 0 to 100) shows the speculators are currently Bullish with a score of 75.4 percent. The commercials are Bearish with a score of 22.4 percent and the small traders (not shown in chart) are Bullish with a score of 79.6 percent.

Heating Oil Futures StatisticsSPECULATORSCOMMERCIALSSMALL TRADERS
– Percent of Open Interest Longs:14.652.211.2
– Percent of Open Interest Shorts:9.362.95.7
– Net Position:22,384-45,84423,460
– Gross Longs:62,233222,56547,794
– Gross Shorts:39,849268,40924,334
– Long to Short Ratio:1.6 to 10.8 to 12.0 to 1
NET POSITION TREND:
– COT Index Score (3 Year Range Pct):75.422.479.6
– COT Index Reading (3 Year Range):BullishBearishBullish
NET POSITION MOVEMENT INDEX:
– 6-Week Change in Strength Index:-19.914.11.0


Bloomberg Commodity Index Futures:

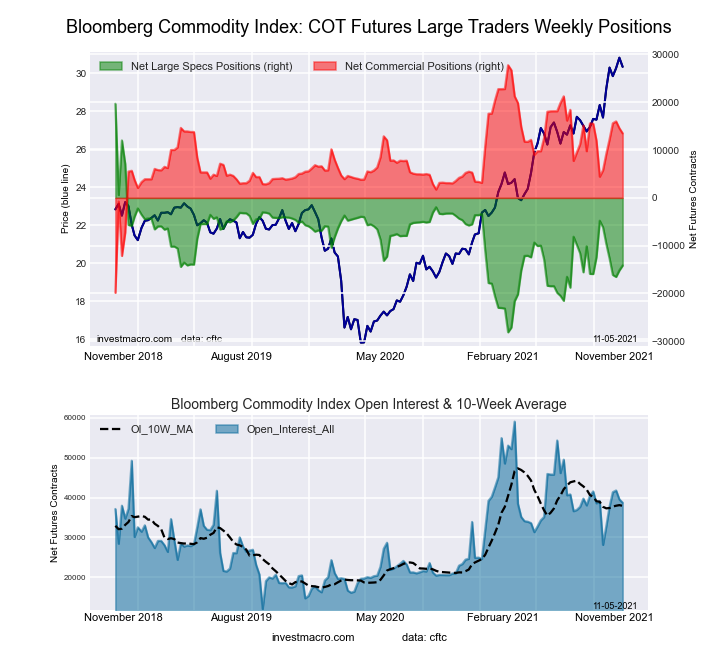
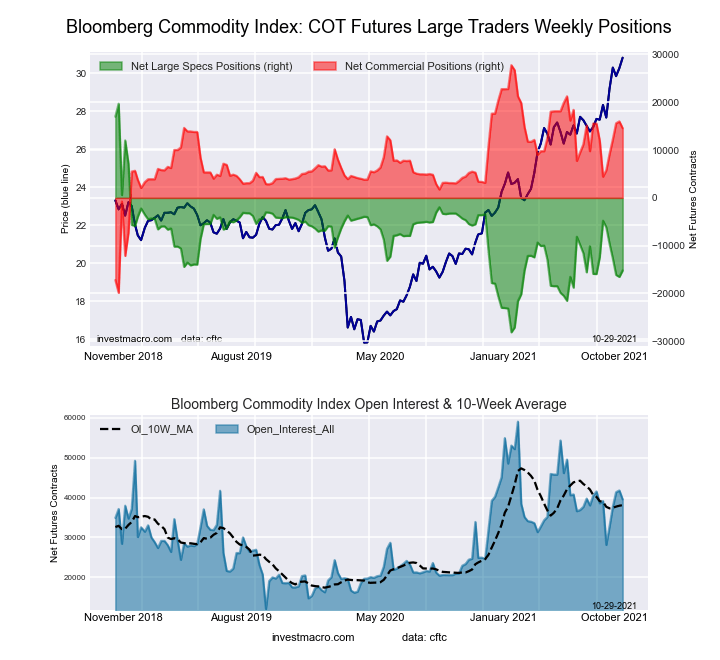
Bloomberg Commodity Index Futures COT ChartThe Bloomberg Commodity Index Futures large speculator standing this week resulted in a net position of -14,146 contracts in the data reported through Tuesday. This was a weekly advance of 1,028 contracts from the previous week which had a total of -15,174 net contracts.

This week’s current strength score (the trader positioning range over the past three years, measured from 0 to 100) shows the speculators are currently Bearish with a score of 29.2 percent. The commercials are Bullish with a score of 70.1 percent and the small traders (not shown in chart) are Bullish with a score of 53.1 percent.

Bloomberg Index Futures StatisticsSPECULATORSCOMMERCIALSSMALL TRADERS
– Percent of Open Interest Longs:53.540.01.9
– Percent of Open Interest Shorts:90.05.20.2
– Net Position:-14,14613,490656
– Gross Longs:20,70415,506746
– Gross Shorts:34,8502,01690
– Long to Short Ratio:0.6 to 17.7 to 18.3 to 1
NET POSITION TREND:
– COT Index Score (3 Year Range Pct):29.270.153.1
– COT Index Reading (3 Year Range):BearishBullishBullish
NET POSITION MOVEMENT INDEX:
– 6-Week Change in Strength Index:-16.716.212.5


Article By InvestMacroReceive our weekly COT Reports by Email

*COT Report: The COT data, released weekly to the public each Friday, is updated through the most recent Tuesday (data is 3 days old) and shows a quick view of how large speculators or non-commercials (for-profit traders) were positioned in the futures markets.

The CFTC categorizes trader positions according to commercial hedgers (traders who use futures contracts for hedging as part of the business), non-commercials (large traders who speculate to realize trading profits) and nonreportable traders (usually small traders/speculators) as well as their open interest (contracts open in the market at time of reporting).See CFTC criteria here.

COT Soft Commodities Charts: Corn Speculator bets jump by most in a year

By InvestMacro | COT | Data Tables | COT Leaders | Downloads | COT Newsletter

Here are the latest charts and statistics for the Commitment of Traders (COT) data published by the Commodities Futures Trading Commission (CFTC).

The latest COT data is updated through Tuesday November 2nd 2021 and shows a quick view of how large traders (for-profit speculators and commercial entities) were positioned in the futures markets.

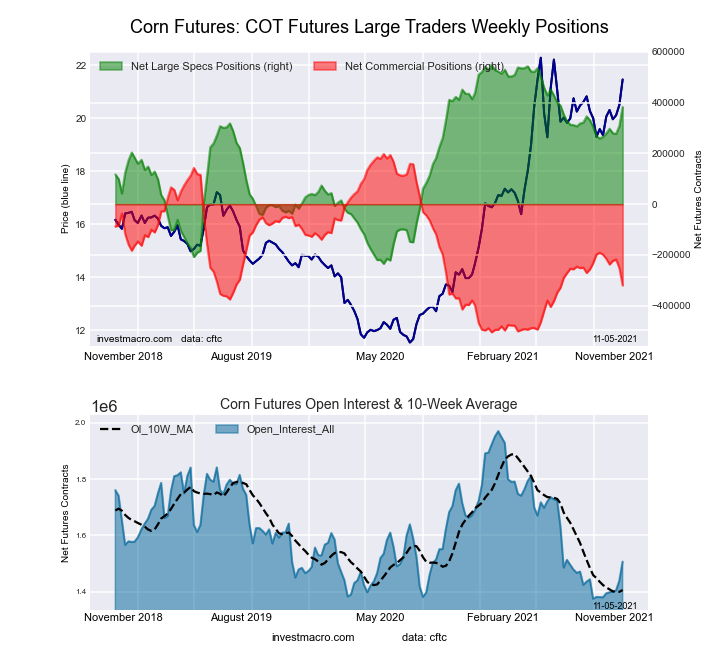
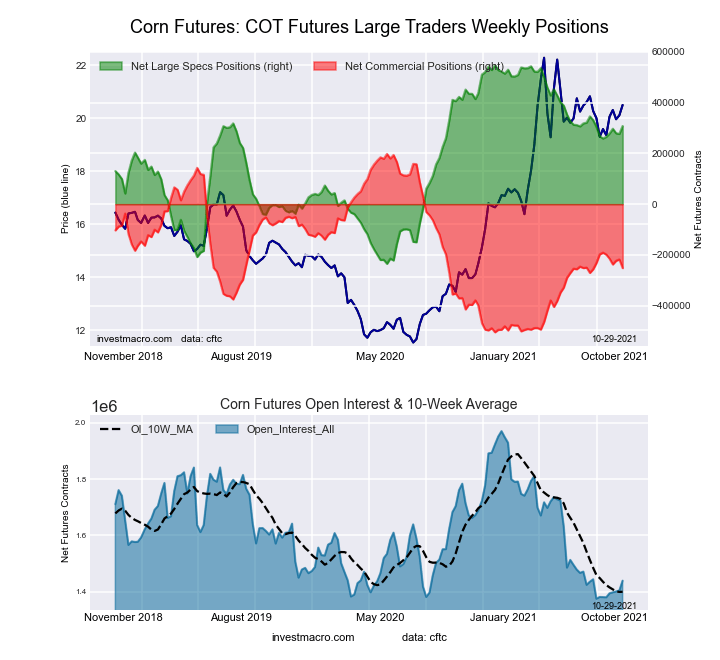
Highlighting this week’s COT Soft Commodity data is once again the rise in speculator positioning for Corn. The speculator bets for Corn jumped by over +75,000 contracts this week following a gain of over +30,000 contracts last week. This marked the largest one-week increase in net positions in a year (November 3rd 2020). Corn is now at the most bullish net speculator level of the past nineteen weeks, dating back to June 22nd.


Data Snapshot of Commodity Market Traders | Columns Legend
Nov-02-2021OIOI-IndexSpec-NetSpec-IndexCom-NetCOM-IndexSmalls-NetSmalls-Index
WTI Crude2,121,46129419,29346-461,5164442,22375
Gold507,61627215,12962-239,8773824,74840
Silver141,394833,11555-48,8605115,74532
Copper217,2163932,33566-41,294318,95977
Palladium10,92620-3,39103,574100-18334
Platinum56,5081615,36425-21,964786,60054
Natural Gas1,267,22735-137,7133793,5176044,19691
Brent183,76627-12,7141007,68805,02679
Heating Oil426,6366622,38475-45,8442223,46080
Soybeans620,172358,75645-19,88561-38,8717
Corn1,506,60222383,10979-320,38526-62,7247
Coffee310,9316664,35395-69,26464,91122
Sugar884,50721209,06180-250,8492141,78860
Wheat409,1373917,89662-11,14130-6,75569


CORN Futures:

Federal Funds 30-Day Bonds Futures COT ChartThe CORN large speculator standing this week resulted in a net position of 383,109 contracts in the data reported through Tuesday. This was a weekly increase of 75,299 contracts from the previous week which had a total of 307,810 net contracts.

This week’s current strength score (the trader positioning range over the past three years, measured from 0 to 100) shows the speculators are currently Bullish with a score of 79.0 percent. The commercials are Bearish with a score of 26.3 percent and the small traders (not shown in chart) are Bearish-Extreme with a score of 7.0 percent.

CORN Futures StatisticsSPECULATORSCOMMERCIALSSMALL TRADERS
– Percent of Open Interest Longs:32.045.28.7
– Percent of Open Interest Shorts:6.666.512.9
– Net Position:383,109-320,385-62,724
– Gross Longs:482,734681,554131,645
– Gross Shorts:99,6251,001,939194,369
– Long to Short Ratio:4.8 to 10.7 to 10.7 to 1
NET POSITION TREND:
– COT Index Score (3 Year Range Pct):79.026.37.0
– COT Index Reading (3 Year Range):BullishBearishBearish-Extreme
NET POSITION MOVEMENT INDEX:
– 6-Week Change in Strength Index:15.0-17.32.2


SUGAR Futures:

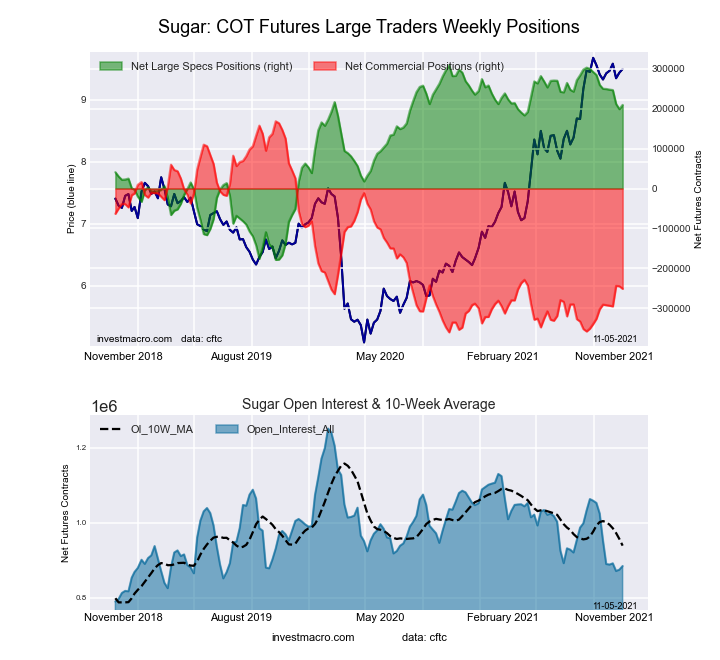
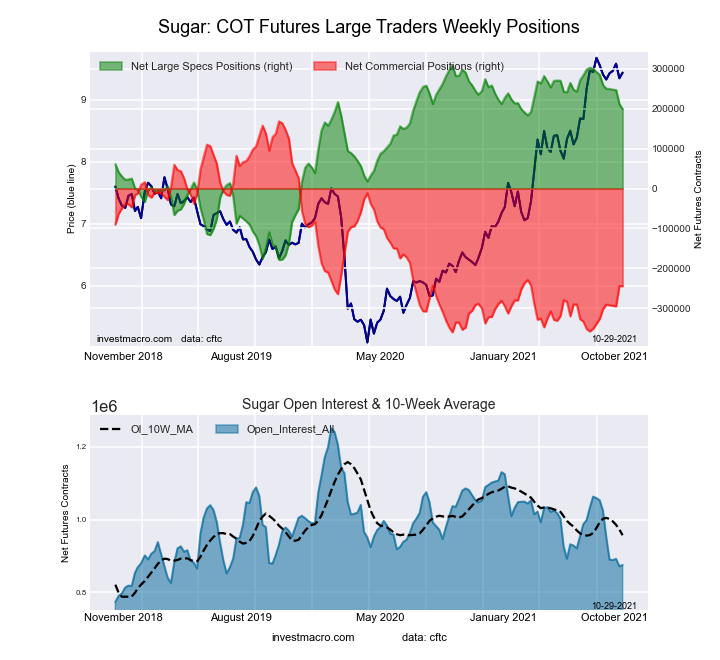
2-Year Treasury Bonds Futures COT ChartThe SUGAR large speculator standing this week resulted in a net position of 209,061 contracts in the data reported through Tuesday. This was a weekly gain of 10,454 contracts from the previous week which had a total of 198,607 net contracts.

This week’s current strength score (the trader positioning range over the past three years, measured from 0 to 100) shows the speculators are currently Bullish with a score of 79.6 percent. The commercials are Bearish with a score of 20.6 percent and the small traders (not shown in chart) are Bullish with a score of 59.5 percent.

SUGAR Futures StatisticsSPECULATORSCOMMERCIALSSMALL TRADERS
– Percent of Open Interest Longs:30.344.410.4
– Percent of Open Interest Shorts:6.772.85.7
– Net Position:209,061-250,84941,788
– Gross Longs:268,307392,71792,164
– Gross Shorts:59,246643,56650,376
– Long to Short Ratio:4.5 to 10.6 to 11.8 to 1
NET POSITION TREND:
– COT Index Score (3 Year Range Pct):79.620.659.5
– COT Index Reading (3 Year Range):BullishBearishBullish
NET POSITION MOVEMENT INDEX:
– 6-Week Change in Strength Index:-8.37.51.1


COFFEE Futures:

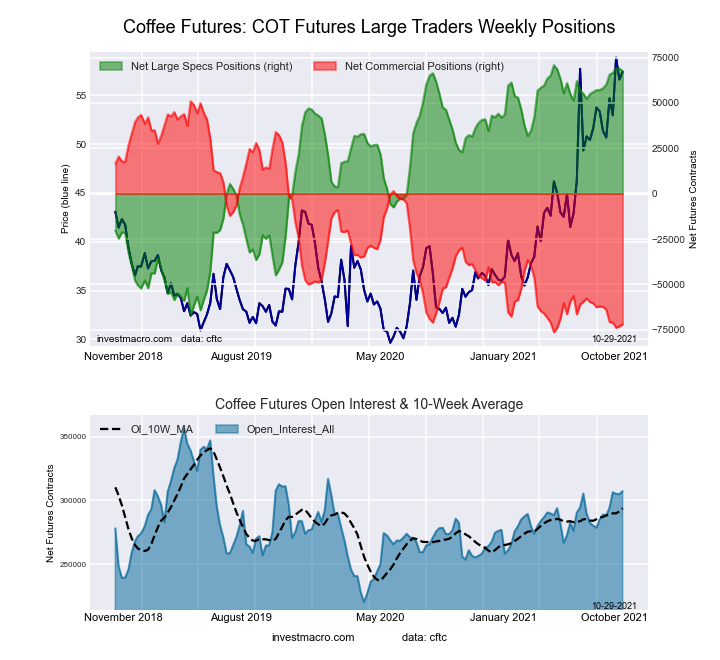
5-Year Treasury Bonds Futures COT ChartThe COFFEE large speculator standing this week resulted in a net position of 64,353 contracts in the data reported through Tuesday. This was a weekly lowering of -3,240 contracts from the previous week which had a total of 67,593 net contracts.

This week’s current strength score (the trader positioning range over the past three years, measured from 0 to 100) shows the speculators are currently Bullish-Extreme with a score of 95.3 percent. The commercials are Bearish-Extreme with a score of 5.5 percent and the small traders (not shown in chart) are Bearish with a score of 22.3 percent.

COFFEE Futures StatisticsSPECULATORSCOMMERCIALSSMALL TRADERS
– Percent of Open Interest Longs:26.841.63.8
– Percent of Open Interest Shorts:6.263.92.2
– Net Position:64,353-69,2644,911
– Gross Longs:83,481129,46811,776
– Gross Shorts:19,128198,7326,865
– Long to Short Ratio:4.4 to 10.7 to 11.7 to 1
NET POSITION TREND:
– COT Index Score (3 Year Range Pct):95.35.522.3
– COT Index Reading (3 Year Range):Bullish-ExtremeBearish-ExtremeBearish
NET POSITION MOVEMENT INDEX:
– 6-Week Change in Strength Index:3.1-4.38.2


SOYBEANS Futures:

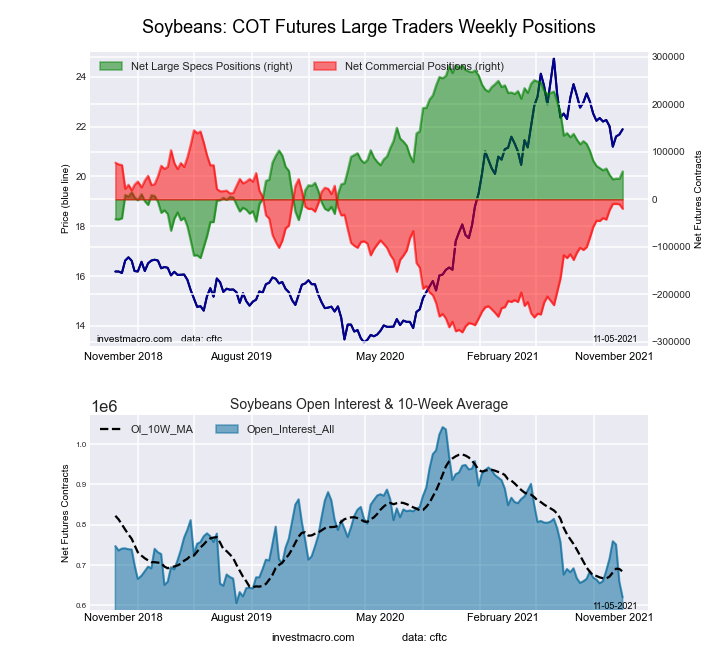
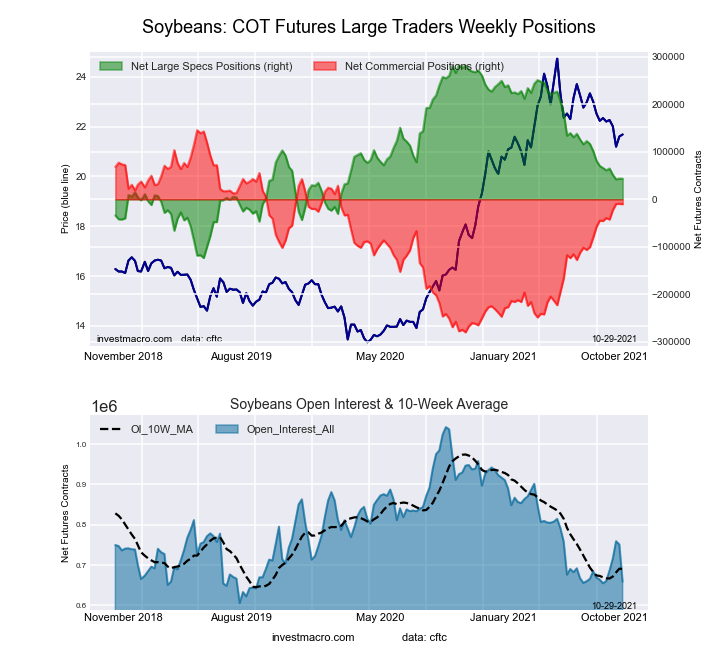
10-Year Treasury Notes Bonds Futures COT ChartThe SOYBEANS large speculator standing this week resulted in a net position of 58,756 contracts in the data reported through Tuesday. This was a weekly advance of 15,526 contracts from the previous week which had a total of 43,230 net contracts.

This week’s current strength score (the trader positioning range over the past three years, measured from 0 to 100) shows the speculators are currently Bearish with a score of 44.9 percent. The commercials are Bullish with a score of 61.1 percent and the small traders (not shown in chart) are Bearish-Extreme with a score of 7.2 percent.

SOYBEANS Futures StatisticsSPECULATORSCOMMERCIALSSMALL TRADERS
– Percent of Open Interest Longs:21.957.77.0
– Percent of Open Interest Shorts:12.460.913.3
– Net Position:58,756-19,885-38,871
– Gross Longs:135,938357,94843,540
– Gross Shorts:77,182377,83382,411
– Long to Short Ratio:1.8 to 10.9 to 10.5 to 1
NET POSITION TREND:
– COT Index Score (3 Year Range Pct):44.961.17.2
– COT Index Reading (3 Year Range):BearishBullishBearish-Extreme
NET POSITION MOVEMENT INDEX:
– 6-Week Change in Strength Index:-0.64.6-28.6


SOYBEAN OIL Futures:

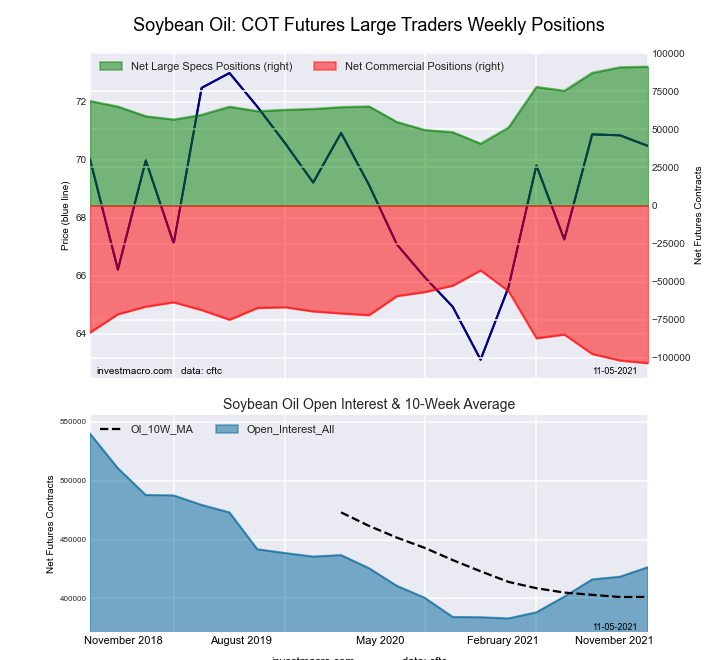
Ultra 10-Year Treasury Notes Bonds Futures COT ChartThe SOYBEAN OIL large speculator standing this week resulted in a net position of 91,131 contracts in the data reported through Tuesday. This was a weekly increase of 405 contracts from the previous week which had a total of 90,726 net contracts.

This week’s current strength score (the trader positioning range over the past three years, measured from 0 to 100) shows the speculators are currently Bullish with a score of 73.0 percent. The commercials are Bearish with a score of 28.0 percent and the small traders (not shown in chart) are Bullish with a score of 59.9 percent.

SOYBEAN OIL Futures StatisticsSPECULATORSCOMMERCIALSSMALL TRADERS
– Percent of Open Interest Longs:28.747.18.0
– Percent of Open Interest Shorts:7.371.45.1
– Net Position:91,131-103,58512,454
– Gross Longs:122,221200,75434,050
– Gross Shorts:31,090304,33921,596
– Long to Short Ratio:3.9 to 10.7 to 11.6 to 1
NET POSITION TREND:
– COT Index Score (3 Year Range Pct):73.028.059.9
– COT Index Reading (3 Year Range):BullishBearishBullish
NET POSITION MOVEMENT INDEX:
– 6-Week Change in Strength Index:27.3-30.538.5


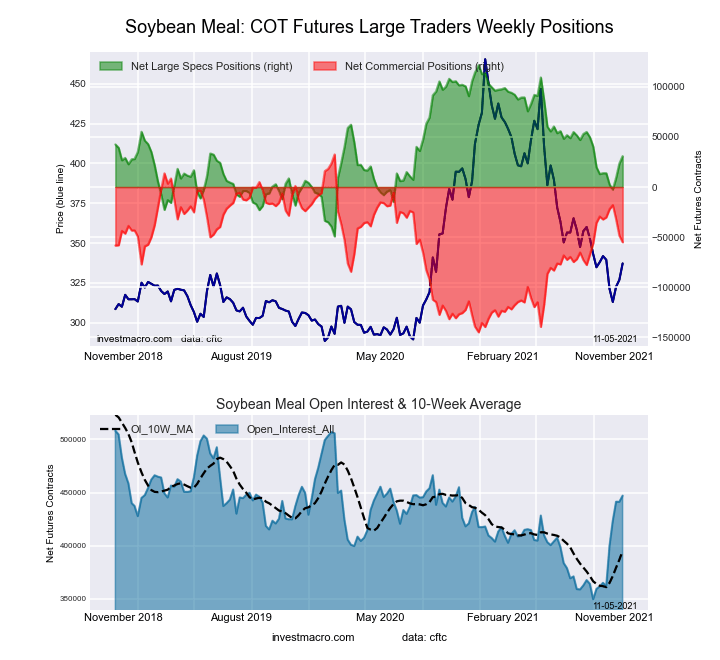
SOYBEAN MEAL Futures:

US Year Treasury Notes Long Bonds Futures COT ChartThe SOYBEAN MEAL large speculator standing this week resulted in a net position of 30,771 contracts in the data reported through Tuesday. This was a weekly boost of 7,352 contracts from the previous week which had a total of 23,419 net contracts.

This week’s current strength score (the trader positioning range over the past three years, measured from 0 to 100) shows the speculators are currently Bearish with a score of 46.8 percent. The commercials are Bullish with a score of 50.7 percent and the small traders (not shown in chart) are Bullish with a score of 68.1 percent.

SOYBEAN MEAL Futures StatisticsSPECULATORSCOMMERCIALSSMALL TRADERS
– Percent of Open Interest Longs:21.546.412.3
– Percent of Open Interest Shorts:14.658.76.9
– Net Position:30,771-55,09124,320
– Gross Longs:96,255207,31655,086
– Gross Shorts:65,484262,40730,766
– Long to Short Ratio:1.5 to 10.8 to 11.8 to 1
NET POSITION TREND:
– COT Index Score (3 Year Range Pct):46.850.768.1
– COT Index Reading (3 Year Range):BearishBullishBullish
NET POSITION MOVEMENT INDEX:
– 6-Week Change in Strength Index:9.9-12.823.1


LIVE CATTLE Futures:

Ultra US Year Treasury Notes Long Bonds Futures COT ChartThe LIVE CATTLE large speculator standing this week resulted in a net position of 41,894 contracts in the data reported through Tuesday. This was a weekly fall of -3,084 contracts from the previous week which had a total of 44,978 net contracts.

This week’s current strength score (the trader positioning range over the past three years, measured from 0 to 100) shows the speculators are currently Bearish-Extreme with a score of 17.1 percent. The commercials are Bullish with a score of 77.7 percent and the small traders (not shown in chart) are Bullish with a score of 74.5 percent.

LIVE CATTLE Futures StatisticsSPECULATORSCOMMERCIALSSMALL TRADERS
– Percent of Open Interest Longs:31.440.010.1
– Percent of Open Interest Shorts:17.352.311.8
– Net Position:41,894-36,717-5,177
– Gross Longs:93,191118,52629,946
– Gross Shorts:51,297155,24335,123
– Long to Short Ratio:1.8 to 10.8 to 10.9 to 1
NET POSITION TREND:
– COT Index Score (3 Year Range Pct):17.177.774.5
– COT Index Reading (3 Year Range):Bearish-ExtremeBullishBullish
NET POSITION MOVEMENT INDEX:
– 6-Week Change in Strength Index:-1.80.26.0


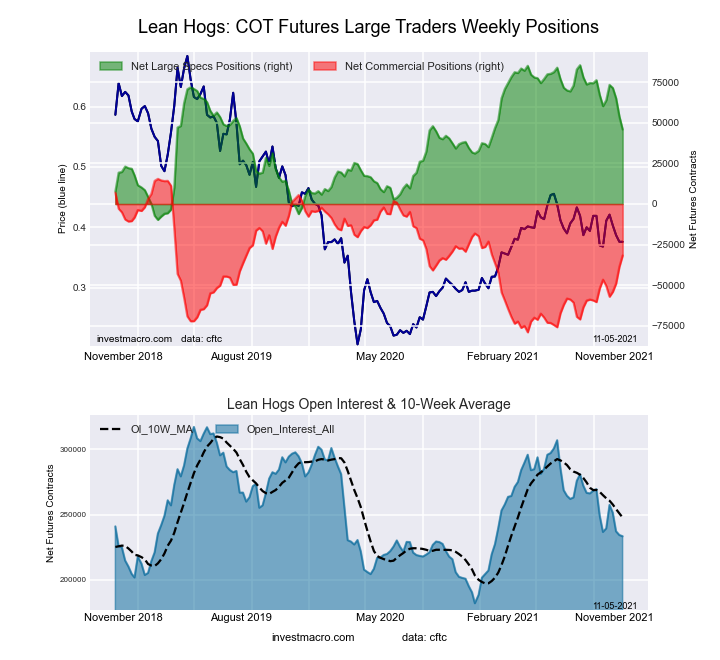
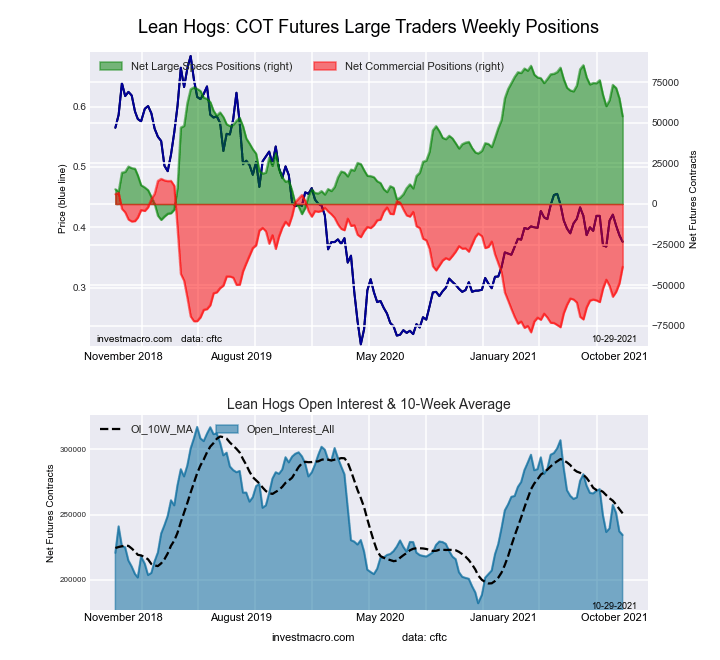
LEAN HOGS Futures:

Eurodollar Bonds Futures COT ChartThe LEAN HOGS large speculator standing this week resulted in a net position of 45,965 contracts in the data reported through Tuesday. This was a weekly fall of -8,092 contracts from the previous week which had a total of 54,057 net contracts.

This week’s current strength score (the trader positioning range over the past three years, measured from 0 to 100) shows the speculators are currently Bullish with a score of 58.4 percent. The commercials are Bullish with a score of 50.0 percent and the small traders (not shown in chart) are Bearish-Extreme with a score of 14.5 percent.

LEAN HOGS Futures StatisticsSPECULATORSCOMMERCIALSSMALL TRADERS
– Percent of Open Interest Longs:37.733.77.9
– Percent of Open Interest Shorts:18.047.314.0
– Net Position:45,965-31,775-14,190
– Gross Longs:87,92978,62718,449
– Gross Shorts:41,964110,40232,639
– Long to Short Ratio:2.1 to 10.7 to 10.6 to 1
NET POSITION TREND:
– COT Index Score (3 Year Range Pct):58.450.014.5
– COT Index Reading (3 Year Range):BullishBullishBearish-Extreme
NET POSITION MOVEMENT INDEX:
– 6-Week Change in Strength Index:-15.115.7-2.2


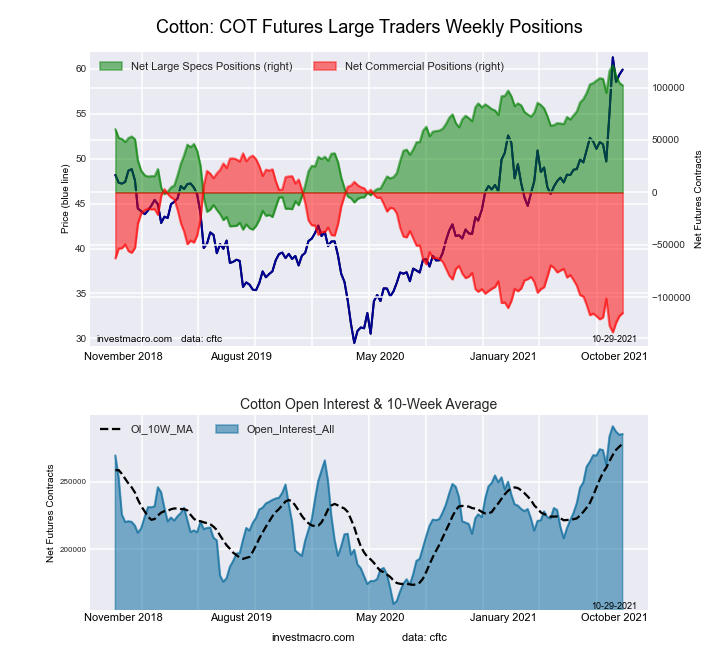
COTTON Futures:

Ultra 10-Year Treasury Notes Bonds Futures COT ChartThe COTTON large speculator standing this week resulted in a net position of 103,553 contracts in the data reported through Tuesday. This was a weekly boost of 1,484 contracts from the previous week which had a total of 102,069 net contracts.

This week’s current strength score (the trader positioning range over the past three years, measured from 0 to 100) shows the speculators are currently Bullish-Extreme with a score of 88.7 percent. The commercials are Bearish-Extreme with a score of 9.7 percent and the small traders (not shown in chart) are Bullish-Extreme with a score of 96.3 percent.

COTTON Futures StatisticsSPECULATORSCOMMERCIALSSMALL TRADERS
– Percent of Open Interest Longs:40.337.17.7
– Percent of Open Interest Shorts:3.978.13.1
– Net Position:103,553-116,80413,251
– Gross Longs:114,770105,72322,064
– Gross Shorts:11,217222,5278,813
– Long to Short Ratio:10.2 to 10.5 to 12.5 to 1
NET POSITION TREND:
– COT Index Score (3 Year Range Pct):88.79.796.3
– COT Index Reading (3 Year Range):Bullish-ExtremeBearish-ExtremeBullish-Extreme
NET POSITION MOVEMENT INDEX:
– 6-Week Change in Strength Index:5.4-9.244.3


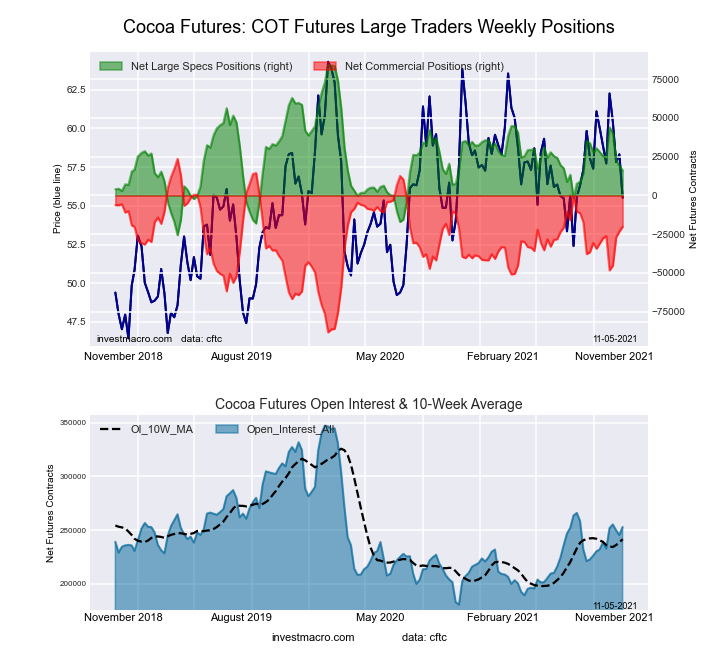
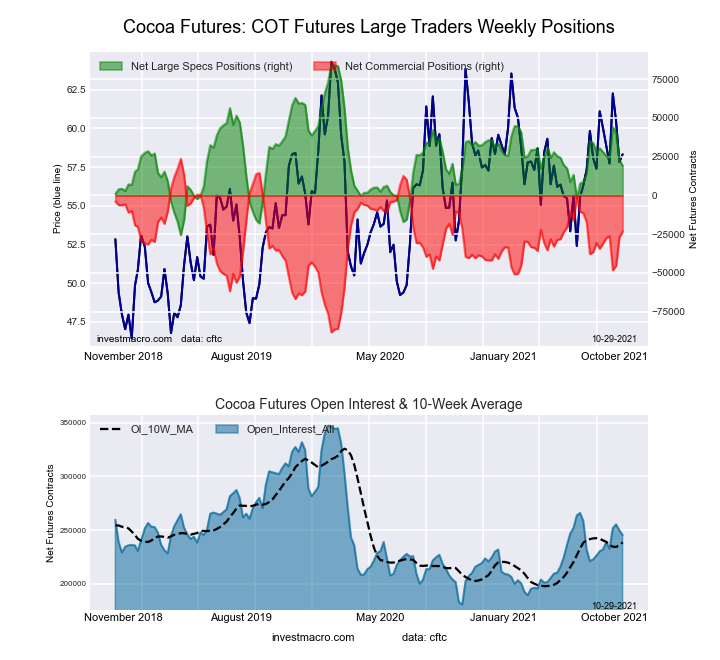
COCOA Futures:

US Year Treasury Notes Long Bonds Futures COT ChartThe COCOA large speculator standing this week resulted in a net position of 16,074 contracts in the data reported through Tuesday. This was a weekly fall of -3,124 contracts from the previous week which had a total of 19,198 net contracts.

This week’s current strength score (the trader positioning range over the past three years, measured from 0 to 100) shows the speculators are currently Bearish with a score of 38.0 percent. The commercials are Bullish with a score of 60.9 percent and the small traders (not shown in chart) are Bullish with a score of 54.6 percent.

COCOA Futures StatisticsSPECULATORSCOMMERCIALSSMALL TRADERS
– Percent of Open Interest Longs:24.452.84.7
– Percent of Open Interest Shorts:18.060.73.1
– Net Position:16,074-20,1304,056
– Gross Longs:61,609133,48311,792
– Gross Shorts:45,535153,6137,736
– Long to Short Ratio:1.4 to 10.9 to 11.5 to 1
NET POSITION TREND:
– COT Index Score (3 Year Range Pct):38.060.954.6
– COT Index Reading (3 Year Range):BearishBullishBullish
NET POSITION MOVEMENT INDEX:
– 6-Week Change in Strength Index:-8.56.721.3


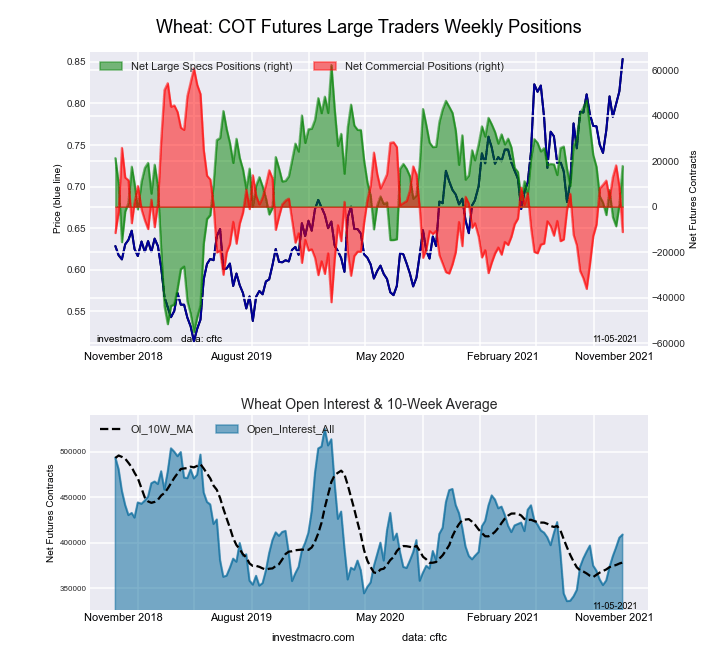
WHEAT Futures:

Ultra US Year Treasury Notes Long Bonds Futures COT ChartThe WHEAT large speculator standing this week resulted in a net position of 17,896 contracts in the data reported through Tuesday. This was a weekly lift of 17,133 contracts from the previous week which had a total of 763 net contracts.

This week’s current strength score (the trader positioning range over the past three years, measured from 0 to 100) shows the speculators are currently Bullish with a score of 62.3 percent. The commercials are Bearish with a score of 30.0 percent and the small traders (not shown in chart) are Bullish with a score of 69.3 percent.

WHEAT Futures StatisticsSPECULATORSCOMMERCIALSSMALL TRADERS
– Percent of Open Interest Longs:26.834.78.9
– Percent of Open Interest Shorts:22.537.410.5
– Net Position:17,896-11,141-6,755
– Gross Longs:109,768141,98436,283
– Gross Shorts:91,872153,12543,038
– Long to Short Ratio:1.2 to 10.9 to 10.8 to 1
NET POSITION TREND:
– COT Index Score (3 Year Range Pct):62.330.069.3
– COT Index Reading (3 Year Range):BullishBearishBullish
NET POSITION MOVEMENT INDEX:
– 6-Week Change in Strength Index:13.7-20.222.6


Article By InvestMacroReceive our weekly COT Reports by Email

*COT Report: The COT data, released weekly to the public each Friday, is updated through the most recent Tuesday (data is 3 days old) and shows a quick view of how large speculators or non-commercials (for-profit traders) were positioned in the futures markets.

The CFTC categorizes trader positions according to commercial hedgers (traders who use futures contracts for hedging as part of the business), non-commercials (large traders who speculate to realize trading profits) and nonreportable traders (usually small traders/speculators) as well as their open interest (contracts open in the market at time of reporting).See CFTC criteria here.
COT Currency Charts: Speculators raise British pound sterling bets to highest level since July

By InvestMacro.com COT Home | Data Tables | Data Downloads | Newsletter

Here are the latest charts and statistics for the Commitment of Traders (COT) data published by the Commodities Futures Trading Commission (CFTC).

The latest COT data is updated through Tuesday October 26th 2021 and shows a quick view of how large traders (for-profit speculators and commercial entities) were positioned in the futures markets. All the currencies are in direct relation to the US dollar where, for example, a bet for the euro is a bet that the euro will rise versus the dollar while a bet against the euro will be a bet that the euro will decline versus the dollar.

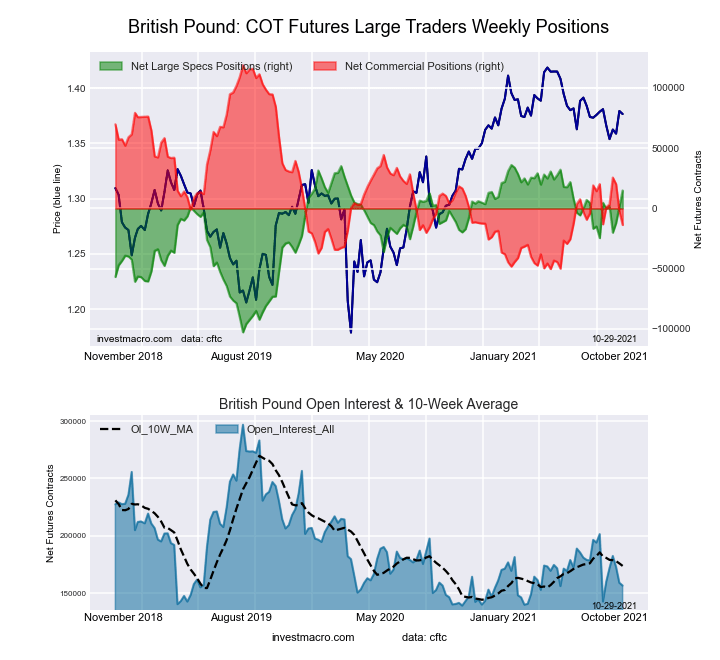
Highlighting this week’s COT Currency data is the speculator’s British pound sterling bullish bets which have ascended to their highest level since July. Speculator net positions increased for a third consecutive week (total of +34,971 contracts) this week and jumped by over +13,000 contracts for a second straight week.

Net positioning had been bearish over the preceding thirteen weeks, falling by a total of -79,176 contracts over that period and declining for nine out of those thirteen weeks. Speculator bearish bets hit a 58-week bearish low-point on September 7th before turning sharply higher (+29,314 contracts) the next week on September 14th.

The recent increases in speculator sentiment has pushed the GBP net contracts to over a three-month high, dating back to July 6th when net positions totaled 21,903 contracts.


Data Snapshot of Forex Market Traders | Columns Legend
Oct-26-2021OIOI-IndexSpec-NetSpec-IndexCom-NetCOM-IndexSmalls-NetSmalls-Index
USD Index58,9938734,45785-41,94257,48598
EUR680,37476-11,25632-16,2557127,51124
GBP156,4951114,95385-13,66022-1,29353
JPY265,25499-107,0362128,546100-21,5106
CHF54,30534-19,3793632,36267-12,98325
CAD159,475373,32058-26,6293523,30982
AUD160,01152-75,2461476,39976-1,15350
NZD43,061308,90686-11,474132,56881
MXN162,54230-43,289040,1661003,12356
RUB53,3745921,46264-23,728312,26696
BRL46,07355-942674633447973
Bitcoin16,671100-4,412058303,829100


US Dollar Index Futures:

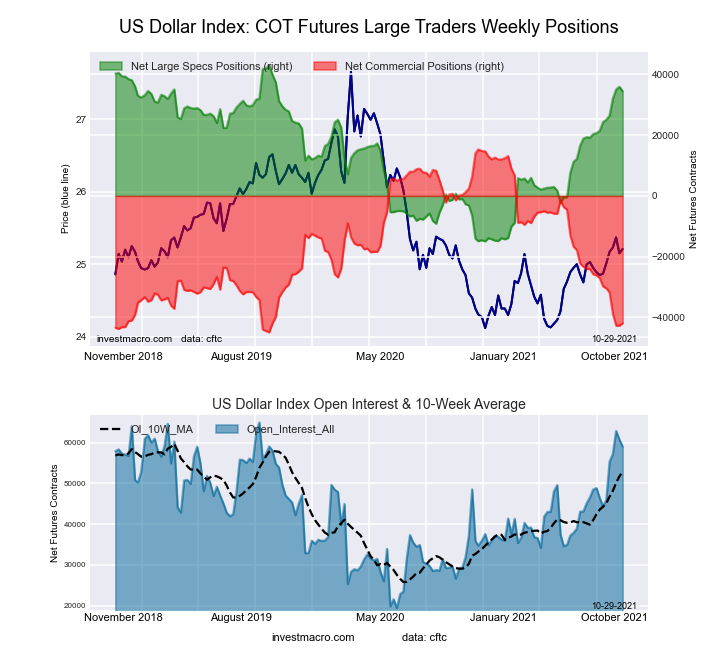
Federal Funds 30-Day Bonds Futures COT ChartThe US Dollar Index large speculator standing this week totaled a net position of 34,457 contracts in the data reported through Tuesday. This was a weekly decline of -1,477 contracts from the previous week which had a total of 35,934 net contracts.

This week’s current strength score (the trader positioning range over the past three years, measured from 0 to 100) shows the speculators are currently Bullish-Extreme with a score of 85.2 percent. The commercials are Bearish-Extreme with a score of 4.9 percent and the small traders (not shown in chart) are Bullish-Extreme with a score of 98.4 percent.

US DOLLAR INDEX StatisticsSPECULATORSCOMMERCIALSSMALL TRADERS
– Percent of Open Interest Longs:76.63.715.6
– Percent of Open Interest Shorts:18.274.82.9
– Net Position:34,457-41,9427,485
– Gross Longs:45,1892,1579,212
– Gross Shorts:10,73244,0991,727
– Long to Short Ratio:4.2 to 10.0 to 15.3 to 1
NET POSITION TREND:
– COT Index Score (3 Year Range Pct):85.24.998.4
– COT Index Reading (3 Year Range):Bullish-ExtremeBearish-ExtremeBullish-Extreme
NET POSITION MOVEMENT INDEX:
– 6-Week Change in Strength Index:17.6-20.221.7


Euro Currency Futures:

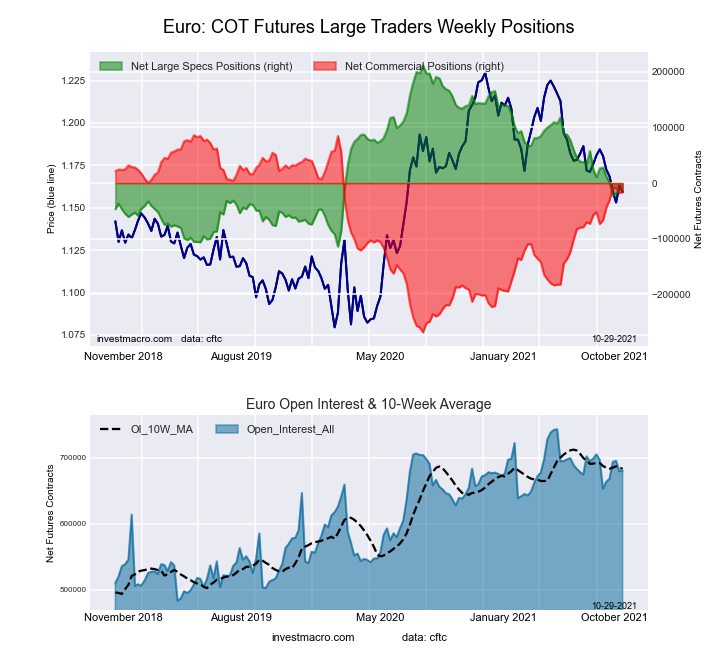
2-Year Treasury Bonds Futures COT ChartThe Euro Currency large speculator standing this week totaled a net position of -11,256 contracts in the data reported through Tuesday. This was a weekly increase of 851 contracts from the previous week which had a total of -12,107 net contracts.

This week’s current strength score (the trader positioning range over the past three years, measured from 0 to 100) shows the speculators are currently Bearish with a score of 31.5 percent. The commercials are Bullish with a score of 71.1 percent and the small traders (not shown in chart) are Bearish with a score of 23.5 percent.

EURO Currency StatisticsSPECULATORSCOMMERCIALSSMALL TRADERS
– Percent of Open Interest Longs:28.957.012.7
– Percent of Open Interest Shorts:30.659.48.7
– Net Position:-11,256-16,25527,511
– Gross Longs:196,880387,90586,683
– Gross Shorts:208,136404,16059,172
– Long to Short Ratio:0.9 to 11.0 to 11.5 to 1
NET POSITION TREND:
– COT Index Score (3 Year Range Pct):31.571.123.5
– COT Index Reading (3 Year Range):BearishBullishBearish
NET POSITION MOVEMENT INDEX:
– 6-Week Change in Strength Index:-12.014.1-17.3


British Pound Sterling Futures:

5-Year Treasury Bonds Futures COT ChartThe British Pound Sterling large speculator standing this week totaled a net position of 14,953 contracts in the data reported through Tuesday. This was a weekly gain of 13,338 contracts from the previous week which had a total of 1,615 net contracts.

This week’s current strength score (the trader positioning range over the past three years, measured from 0 to 100) shows the speculators are currently Bullish-Extreme with a score of 84.8 percent. The commercials are Bearish with a score of 21.6 percent and the small traders (not shown in chart) are Bullish with a score of 53.0 percent.

BRITISH POUND StatisticsSPECULATORSCOMMERCIALSSMALL TRADERS
– Percent of Open Interest Longs:33.247.717.5
– Percent of Open Interest Shorts:23.656.518.4
– Net Position:14,953-13,660-1,293
– Gross Longs:51,91274,68827,446
– Gross Shorts:36,95988,34828,739
– Long to Short Ratio:1.4 to 10.8 to 11.0 to 1
NET POSITION TREND:
– COT Index Score (3 Year Range Pct):84.821.653.0
– COT Index Reading (3 Year Range):Bullish-ExtremeBearishBullish
NET POSITION MOVEMENT INDEX:
– 6-Week Change in Strength Index:7.3-0.3-19.9


Japanese Yen Futures:

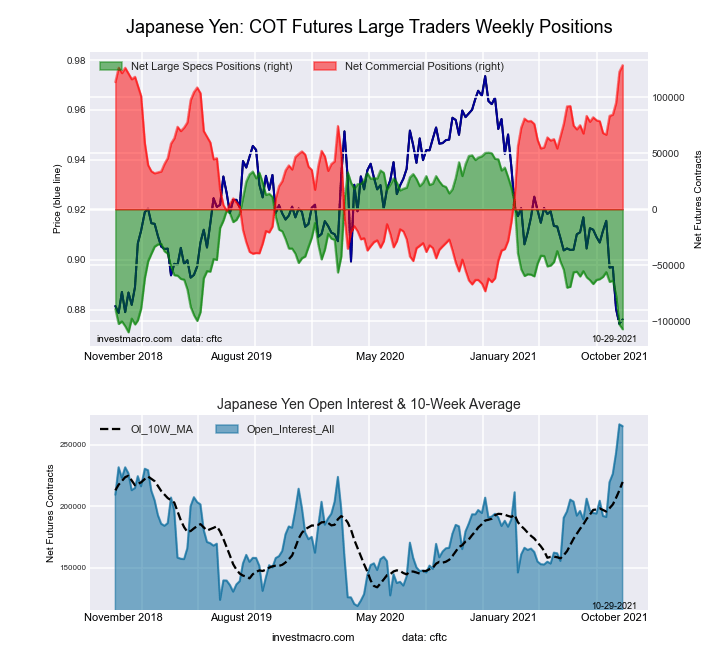
10-Year Treasury Notes Bonds Futures COT ChartThe Japanese Yen large speculator standing this week totaled a net position of -107,036 contracts in the data reported through Tuesday. This was a weekly decline of -4,302 contracts from the previous week which had a total of -102,734 net contracts.

This week’s current strength score (the trader positioning range over the past three years, measured from 0 to 100) shows the speculators are currently Bearish-Extreme with a score of 1.7 percent. The commercials are Bullish-Extreme with a score of 100.0 percent and the small traders (not shown in chart) are Bearish-Extreme with a score of 5.9 percent.

JAPANESE YEN StatisticsSPECULATORSCOMMERCIALSSMALL TRADERS
– Percent of Open Interest Longs:11.980.07.3
– Percent of Open Interest Shorts:52.231.615.4
– Net Position:-107,036128,546-21,510
– Gross Longs:31,487212,30319,254
– Gross Shorts:138,52383,75740,764
– Long to Short Ratio:0.2 to 12.5 to 10.5 to 1
NET POSITION TREND:
– COT Index Score (3 Year Range Pct):1.7100.05.9
– COT Index Reading (3 Year Range):Bearish-ExtremeBullish-ExtremeBearish-Extreme
NET POSITION MOVEMENT INDEX:
– 6-Week Change in Strength Index:-29.230.0-29.1


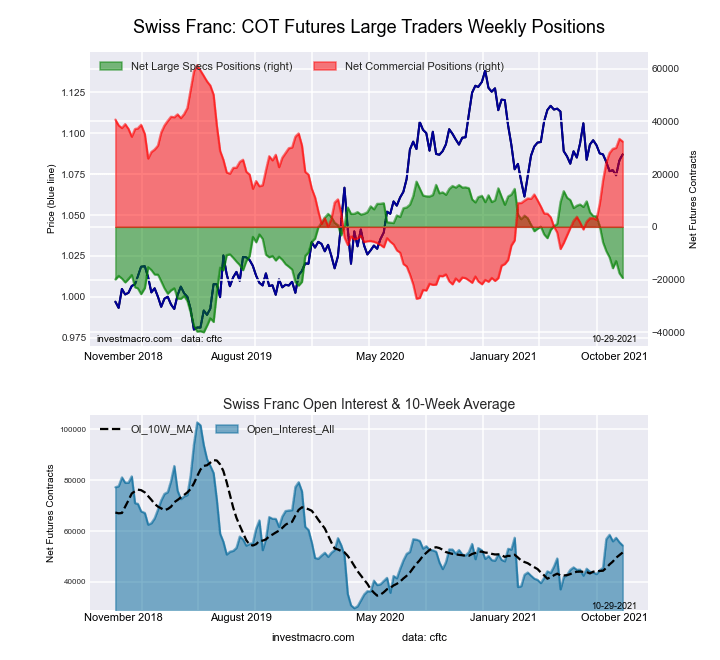
Swiss Franc Futures:

Ultra 10-Year Treasury Notes Bonds Futures COT ChartThe Swiss Franc large speculator standing this week totaled a net position of -19,379 contracts in the data reported through Tuesday. This was a weekly fall of -1,795 contracts from the previous week which had a total of -17,584 net contracts.

This week’s current strength score (the trader positioning range over the past three years, measured from 0 to 100) shows the speculators are currently Bearish with a score of 36.1 percent. The commercials are Bullish with a score of 67.3 percent and the small traders (not shown in chart) are Bearish with a score of 25.2 percent.

SWISS FRANC StatisticsSPECULATORSCOMMERCIALSSMALL TRADERS
– Percent of Open Interest Longs:2.379.817.2
– Percent of Open Interest Shorts:38.020.241.1
– Net Position:-19,37932,362-12,983
– Gross Longs:1,24643,3559,360
– Gross Shorts:20,62510,99322,343
– Long to Short Ratio:0.1 to 13.9 to 10.4 to 1
NET POSITION TREND:
– COT Index Score (3 Year Range Pct):36.167.325.2
– COT Index Reading (3 Year Range):BearishBullishBearish
NET POSITION MOVEMENT INDEX:
– 6-Week Change in Strength Index:-23.616.7-3.8


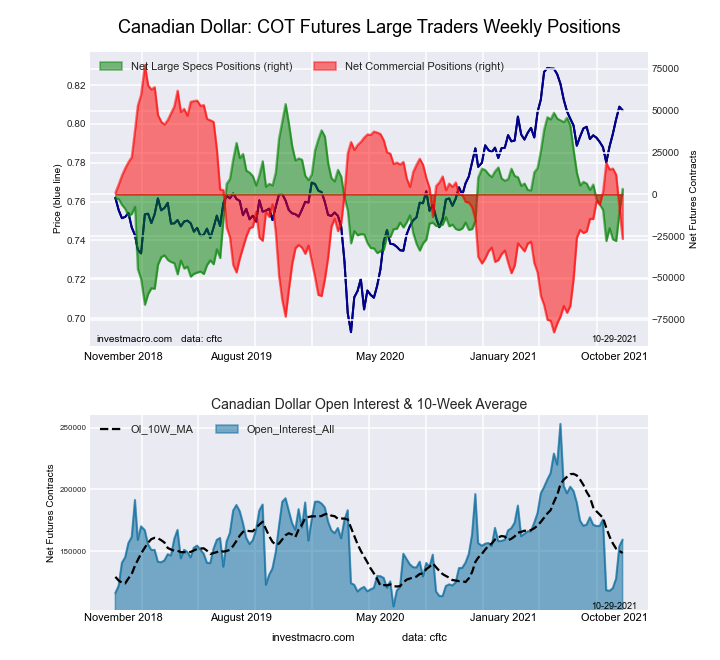
Canadian Dollar Futures:

US Year Treasury Notes Long Bonds Futures COT ChartThe Canadian Dollar large speculator standing this week totaled a net position of 3,320 contracts in the data reported through Tuesday. This was a weekly boost of 14,244 contracts from the previous week which had a total of -10,924 net contracts.

This week’s current strength score (the trader positioning range over the past three years, measured from 0 to 100) shows the speculators are currently Bullish with a score of 57.8 percent. The commercials are Bearish with a score of 35.0 percent and the small traders (not shown in chart) are Bullish-Extreme with a score of 82.0 percent.

CANADIAN DOLLAR StatisticsSPECULATORSCOMMERCIALSSMALL TRADERS
– Percent of Open Interest Longs:28.843.826.4
– Percent of Open Interest Shorts:26.760.511.8
– Net Position:3,320-26,62923,309
– Gross Longs:45,97769,91342,129
– Gross Shorts:42,65796,54218,820
– Long to Short Ratio:1.1 to 10.7 to 12.2 to 1
NET POSITION TREND:
– COT Index Score (3 Year Range Pct):57.835.082.0
– COT Index Reading (3 Year Range):BullishBearishBullish-Extreme
NET POSITION MOVEMENT INDEX:
– 6-Week Change in Strength Index:10.5-17.623.3


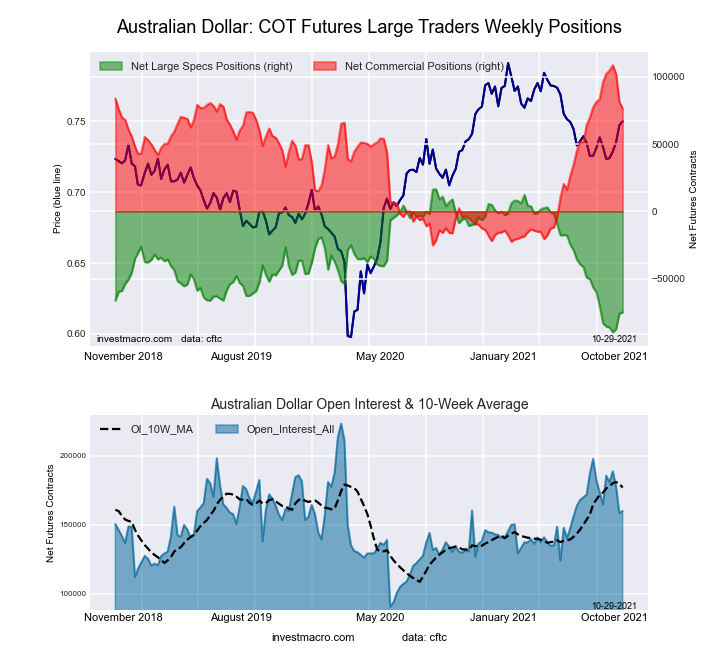
Australian Dollar Futures:

Ultra US Year Treasury Notes Long Bonds Futures COT ChartThe Australian Dollar large speculator standing this week totaled a net position of -75,246 contracts in the data reported through Tuesday. This was a weekly increase of 812 contracts from the previous week which had a total of -76,058 net contracts.

This week’s current strength score (the trader positioning range over the past three years, measured from 0 to 100) shows the speculators are currently Bearish-Extreme with a score of 13.9 percent. The commercials are Bullish with a score of 75.9 percent and the small traders (not shown in chart) are Bearish with a score of 49.6 percent.

AUSTRALIAN DOLLAR StatisticsSPECULATORSCOMMERCIALSSMALL TRADERS
– Percent of Open Interest Longs:10.973.514.0
– Percent of Open Interest Shorts:57.925.814.7
– Net Position:-75,24676,399-1,153
– Gross Longs:17,448117,66222,432
– Gross Shorts:92,69441,26323,585
– Long to Short Ratio:0.2 to 12.9 to 11.0 to 1
NET POSITION TREND:
– COT Index Score (3 Year Range Pct):13.975.949.6
– COT Index Reading (3 Year Range):Bearish-ExtremeBullishBearish
NET POSITION MOVEMENT INDEX:
– 6-Week Change in Strength Index:7.7-14.728.0


New Zealand Dollar Futures:

Eurodollar Bonds Futures COT ChartThe New Zealand Dollar large speculator standing this week totaled a net position of 8,906 contracts in the data reported through Tuesday. This was a weekly rise of 2,466 contracts from the previous week which had a total of 6,440 net contracts.

This week’s current strength score (the trader positioning range over the past three years, measured from 0 to 100) shows the speculators are currently Bullish-Extreme with a score of 86.2 percent. The commercials are Bearish-Extreme with a score of 12.7 percent and the small traders (not shown in chart) are Bullish-Extreme with a score of 81.2 percent.

NEW ZEALAND DOLLAR StatisticsSPECULATORSCOMMERCIALSSMALL TRADERS
– Percent of Open Interest Longs:56.926.313.5
– Percent of Open Interest Shorts:36.252.97.5
– Net Position:8,906-11,4742,568
– Gross Longs:24,49011,3075,819
– Gross Shorts:15,58422,7813,251
– Long to Short Ratio:1.6 to 10.5 to 11.8 to 1
NET POSITION TREND:
– COT Index Score (3 Year Range Pct):86.212.781.2
– COT Index Reading (3 Year Range):Bullish-ExtremeBearish-ExtremeBullish-Extreme
NET POSITION MOVEMENT INDEX:
– 6-Week Change in Strength Index:4.5-4.20.2


Mexican Peso Futures:

Ultra 10-Year Treasury Notes Bonds Futures COT ChartThe Mexican Peso large speculator standing this week totaled a net position of -43,289 contracts in the data reported through Tuesday. This was a weekly reduction of -4,718 contracts from the previous week which had a total of -38,571 net contracts.

This week’s current strength score (the trader positioning range over the past three years, measured from 0 to 100) shows the speculators are currently Bearish-Extreme with a score of 0.0 percent. The commercials are Bullish-Extreme with a score of 100.0 percent and the small traders (not shown in chart) are Bullish with a score of 56.3 percent.

MEXICAN PESO StatisticsSPECULATORSCOMMERCIALSSMALL TRADERS
– Percent of Open Interest Longs:39.255.94.2
– Percent of Open Interest Shorts:65.831.22.2
– Net Position:-43,28940,1663,123
– Gross Longs:63,67790,9046,749
– Gross Shorts:106,96650,7383,626
– Long to Short Ratio:0.6 to 11.8 to 11.9 to 1
NET POSITION TREND:
– COT Index Score (3 Year Range Pct):0.0100.056.3
– COT Index Reading (3 Year Range):Bearish-ExtremeBullish-ExtremeBullish
NET POSITION MOVEMENT INDEX:
– 6-Week Change in Strength Index:-12.813.5-7.0


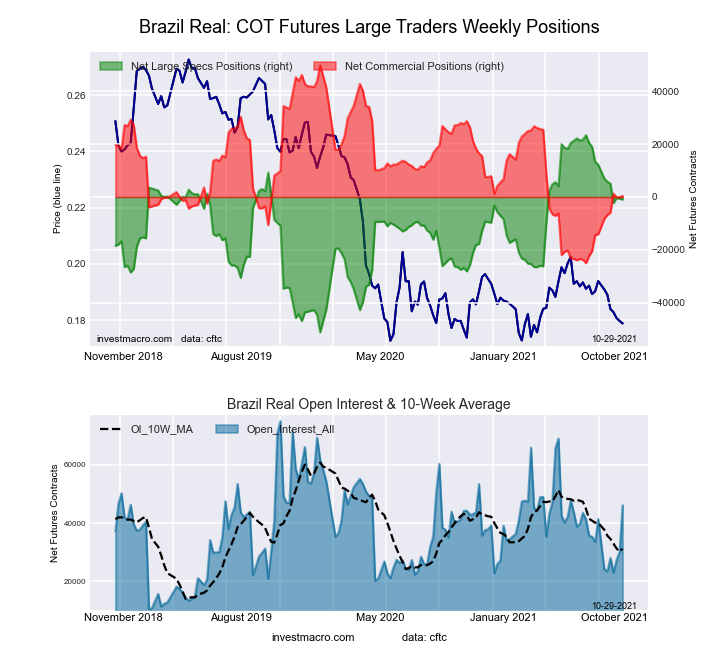
Brazilian Real Futures:

US Year Treasury Notes Long Bonds Futures COT ChartThe Brazilian Real large speculator standing this week totaled a net position of -942 contracts in the data reported through Tuesday. This was a weekly reduction of -284 contracts from the previous week which had a total of -658 net contracts.

This week’s current strength score (the trader positioning range over the past three years, measured from 0 to 100) shows the speculators are currently Bullish with a score of 67.4 percent. The commercials are Bearish with a score of 34.0 percent and the small traders (not shown in chart) are Bullish with a score of 72.6 percent.

BRAZIL REAL StatisticsSPECULATORSCOMMERCIALSSMALL TRADERS
– Percent of Open Interest Longs:44.145.97.6
– Percent of Open Interest Shorts:46.244.96.5
– Net Position:-942463479
– Gross Longs:20,33721,1283,486
– Gross Shorts:21,27920,6653,007
– Long to Short Ratio:1.0 to 11.0 to 11.2 to 1
NET POSITION TREND:
– COT Index Score (3 Year Range Pct):67.434.072.6
– COT Index Reading (3 Year Range):BullishBearishBullish
NET POSITION MOVEMENT INDEX:
– 6-Week Change in Strength Index:-10.611.7-10.6


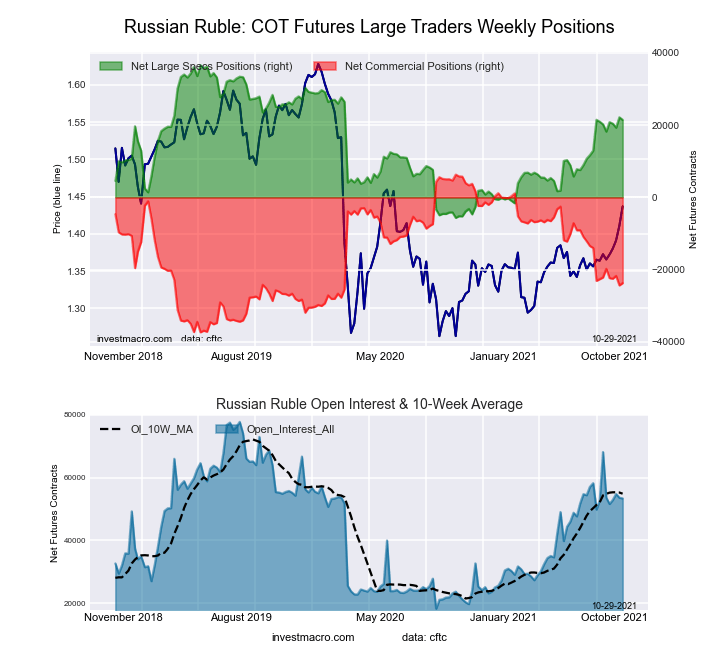
Russian Ruble Futures:

Ultra US Year Treasury Notes Long Bonds Futures COT ChartThe Russian Ruble large speculator standing this week totaled a net position of 21,462 contracts in the data reported through Tuesday. This was a weekly reduction of -709 contracts from the previous week which had a total of 22,171 net contracts.

This week’s current strength score (the trader positioning range over the past three years, measured from 0 to 100) shows the speculators are currently Bullish with a score of 64.2 percent. The commercials are Bearish with a score of 31.2 percent and the small traders (not shown in chart) are Bullish-Extreme with a score of 96.1 percent.

RUSSIAN RUBLE StatisticsSPECULATORSCOMMERCIALSSMALL TRADERS
– Percent of Open Interest Longs:57.536.56.0
– Percent of Open Interest Shorts:17.380.91.8
– Net Position:21,462-23,7282,266
– Gross Longs:30,70819,4613,205
– Gross Shorts:9,24643,189939
– Long to Short Ratio:3.3 to 10.5 to 13.4 to 1
NET POSITION TREND:
– COT Index Score (3 Year Range Pct):64.231.296.1
– COT Index Reading (3 Year Range):BullishBearishBullish-Extreme
NET POSITION MOVEMENT INDEX:
– 6-Week Change in Strength Index:2.9-3.69.2


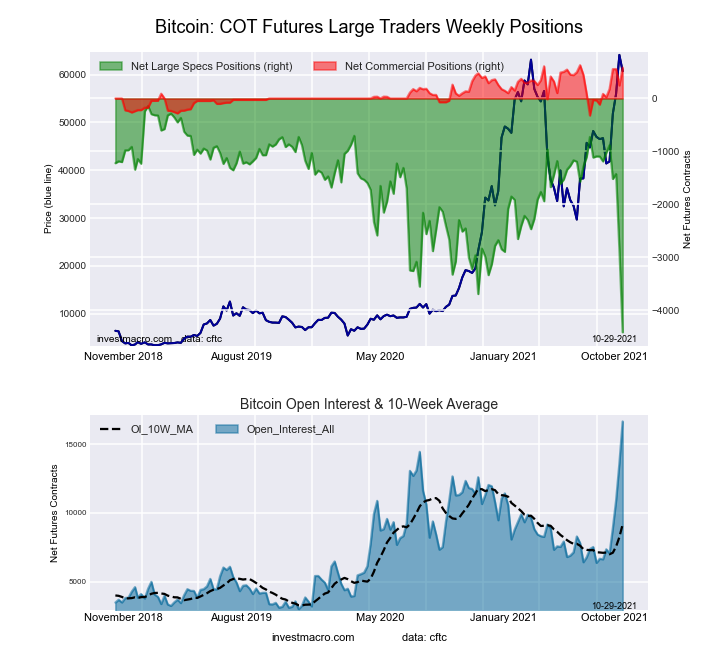
Bitcoin Futures:

Eurodollar Bonds Futures COT ChartThe Bitcoin large speculator standing this week totaled a net position of -4,412 contracts in the data reported through Tuesday. This was a weekly fall of -1,566 contracts from the previous week which had a total of -2,846 net contracts.

This week’s current strength score (the trader positioning range over the past three years, measured from 0 to 100) shows the speculators are currently Bearish-Extreme with a score of 0.0 percent. The commercials are Bullish-Extreme with a score of 95.3 percent and the small traders (not shown in chart) are Bullish-Extreme with a score of 100.0 percent.

BITCOIN StatisticsSPECULATORSCOMMERCIALSSMALL TRADERS
– Percent of Open Interest Longs:42.75.828.9
– Percent of Open Interest Shorts:69.22.35.9
– Net Position:-4,4125833,829
– Gross Longs:7,1219724,810
– Gross Shorts:11,533389981
– Long to Short Ratio:0.6 to 12.5 to 14.9 to 1
NET POSITION TREND:
– COT Index Score (3 Year Range Pct):0.095.3100.0
– COT Index Reading (3 Year Range):Bearish-ExtremeBullish-ExtremeBullish-Extreme
NET POSITION MOVEMENT INDEX:
– 6-Week Change in Strength Index:-75.552.477.6


Article By InvestMacro.comReceive our weekly COT Reports by Email

*COT Report: The COT data, released weekly to the public each Friday, is updated through the most recent Tuesday (data is 3 days old) and shows a quick view of how large speculators or non-commercials (for-profit traders) were positioned in the futures markets.

The CFTC categorizes trader positions according to commercial hedgers (traders who use futures contracts for hedging as part of the business), non-commercials (large traders who speculate to realize trading profits) and nonreportable traders (usually small traders/speculators).

Find CFTC criteria here: (http://www.cftc.gov/MarketReports/CommitmentsofTraders/ExplanatoryNotes/index.htm).

COT Bonds Futures Charts: 5-Year Treasury Bond Speculator bets fall to 46-Week Low

By InvestMacro.com COT Home | Data Tables | Data Downloads | Newsletter

Here are the latest charts and statistics for the Commitment of Traders (COT) data published by the Commodities Futures Trading Commission (CFTC).

The latest COT data is updated through Tuesday October 26th 2021 and shows a quick view of how large traders (for-profit speculators and commercial entities) were positioned in the futures markets.

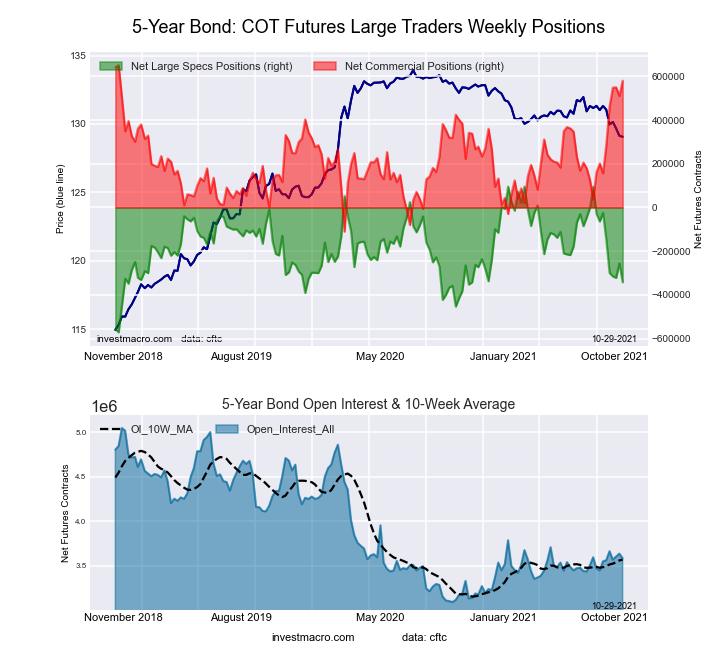
Highlighting this week’s COT Bonds data is the 5-Year Treasury Bond’s speculator positions that fell to a forty-six week low-point. The 5-year bond speculative position declined by over -86,000 contracts this week and fell for the fifth time in the past six weeks. The spec position has now fallen by a total -317,109 contracts over the past six weeks. The current net bearish standing sits at a total of -341,475 contracts for the 5-year bond speculators which registers as the most bearish level since December 8th of 2020 when net positions totaled -342,024 contracts.


Data Snapshot of Bond Market Traders | Columns Legend
Oct-26-2021OIOI-IndexSpec-NetSpec-IndexCom-NetCOM-IndexSmalls-NetSmalls-Index
Eurodollar12,675,71468-724,993361,046,05659-321,06361
FedFunds1,293,09323-44,5913454,41066-9,81944
2-Year2,029,07910-112,31867154,78847-42,4701
Long T-Bond1,173,18044-66,9946987,01348-20,01937
10-Year4,000,22764-114,84559441,51575-326,6702
5-Year3,586,54425-341,47534579,88191-238,4065


3-Month Eurodollars Futures:

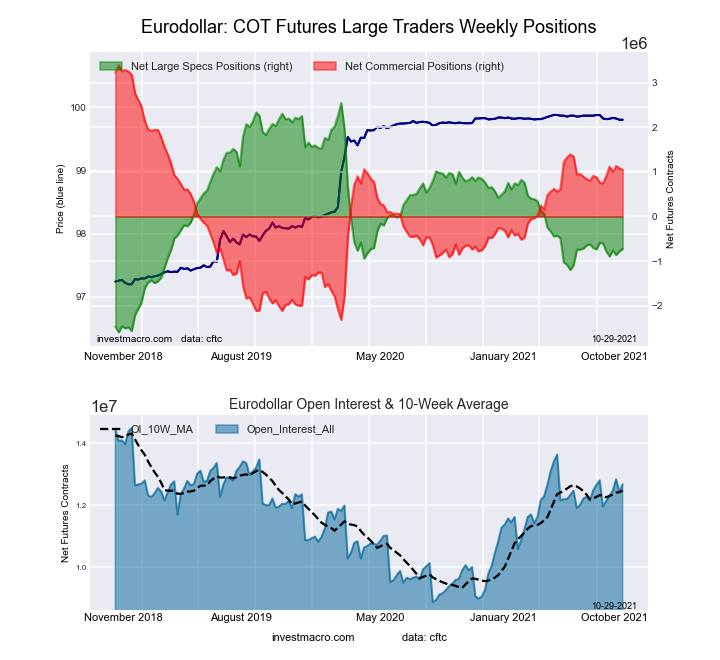
Eurodollar Bonds Futures COT ChartThe 3-Month Eurodollars large speculator standing this week recorded a net position of -724,993 contracts in the data reported through Tuesday. This was a weekly rise of 56,207 contracts from the previous week which had a total of -781,200 net contracts.

This week’s current strength score (the trader positioning range over the past three years, measured from 0 to 100) shows the speculators are currently Bearish with a score of 36.4 percent. The commercials are Bullish with a score of 58.9 percent and the small traders (not shown in chart) are Bullish with a score of 61.2 percent.

3-Month Eurodollars StatisticsSPECULATORSCOMMERCIALSSMALL TRADERS
– Percent of Open Interest Longs:13.563.74.3
– Percent of Open Interest Shorts:19.255.56.9
– Net Position:-724,9931,046,056-321,063
– Gross Longs:1,711,6948,076,945551,131
– Gross Shorts:2,436,6877,030,889872,194
– Long to Short Ratio:0.7 to 11.1 to 10.6 to 1
NET POSITION TREND:
– COT Index Score (3 Year Range Pct):36.458.961.2
– COT Index Reading (3 Year Range):BearishBullishBullish
NET POSITION MOVEMENT INDEX:
– 6-Week Change in Strength Index:-2.45.3-23.8


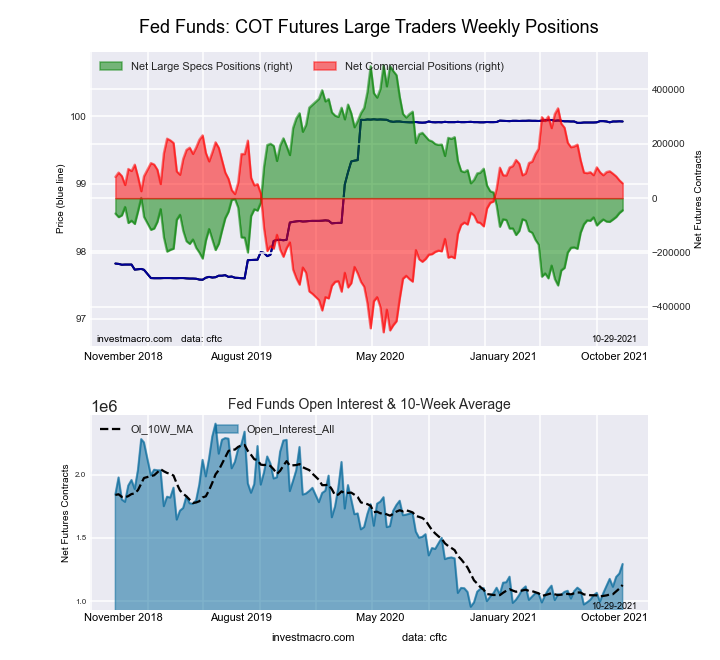
30-Day Federal Funds Futures:

Federal Funds 30-Day Bonds Futures COT ChartThe 30-Day Federal Funds large speculator standing this week recorded a net position of -44,591 contracts in the data reported through Tuesday. This was a weekly rise of 9,893 contracts from the previous week which had a total of -54,484 net contracts.

This week’s current strength score (the trader positioning range over the past three years, measured from 0 to 100) shows the speculators are currently Bearish with a score of 34.1 percent. The commercials are Bullish with a score of 66.5 percent and the small traders (not shown in chart) are Bearish with a score of 44.1 percent.

30-Day Federal Funds StatisticsSPECULATORSCOMMERCIALSSMALL TRADERS
– Percent of Open Interest Longs:5.678.61.4
– Percent of Open Interest Shorts:9.174.42.1
– Net Position:-44,59154,410-9,819
– Gross Longs:72,5751,016,20617,945
– Gross Shorts:117,166961,79627,764
– Long to Short Ratio:0.6 to 11.1 to 10.6 to 1
NET POSITION TREND:
– COT Index Score (3 Year Range Pct):34.166.544.1
– COT Index Reading (3 Year Range):BearishBullishBearish
NET POSITION MOVEMENT INDEX:
– 6-Week Change in Strength Index:4.2-3.6-8.1


2-Year Treasury Note Futures:

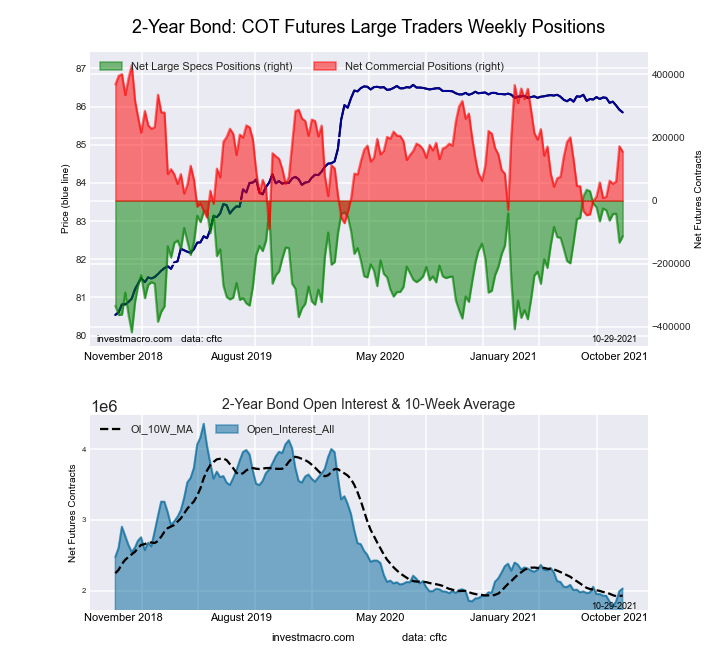
2-Year Treasury Bonds Futures COT ChartThe 2-Year Treasury Note large speculator standing this week recorded a net position of -112,318 contracts in the data reported through Tuesday. This was a weekly rise of 20,634 contracts from the previous week which had a total of -132,952 net contracts.

This week’s current strength score (the trader positioning range over the past three years, measured from 0 to 100) shows the speculators are currently Bullish with a score of 67.5 percent. The commercials are Bearish with a score of 47.2 percent and the small traders (not shown in chart) are Bearish-Extreme with a score of 0.5 percent.

2-Year Treasury Note StatisticsSPECULATORSCOMMERCIALSSMALL TRADERS
– Percent of Open Interest Longs:16.373.86.8
– Percent of Open Interest Shorts:21.866.28.9
– Net Position:-112,318154,788-42,470
– Gross Longs:330,1301,497,320138,359
– Gross Shorts:442,4481,342,532180,829
– Long to Short Ratio:0.7 to 11.1 to 10.8 to 1
NET POSITION TREND:
– COT Index Score (3 Year Range Pct):67.547.20.5
– COT Index Reading (3 Year Range):BullishBearishBearish-Extreme
NET POSITION MOVEMENT INDEX:
– 6-Week Change in Strength Index:-19.428.2-35.2


5-Year Treasury Note Futures:

5-Year Treasury Bonds Futures COT ChartThe 5-Year Treasury Note large speculator standing this week recorded a net position of -341,475 contracts in the data reported through Tuesday. This was a weekly decrease of -86,264 contracts from the previous week which had a total of -255,211 net contracts.

This week’s current strength score (the trader positioning range over the past three years, measured from 0 to 100) shows the speculators are currently Bearish with a score of 34.4 percent. The commercials are Bullish-Extreme with a score of 90.7 percent and the small traders (not shown in chart) are Bearish-Extreme with a score of 5.2 percent.

5-Year Treasury Note StatisticsSPECULATORSCOMMERCIALSSMALL TRADERS
– Percent of Open Interest Longs:10.079.37.1
– Percent of Open Interest Shorts:19.563.113.8
– Net Position:-341,475579,881-238,406
– Gross Longs:359,1802,844,217255,899
– Gross Shorts:700,6552,264,336494,305
– Long to Short Ratio:0.5 to 11.3 to 10.5 to 1
NET POSITION TREND:
– COT Index Score (3 Year Range Pct):34.490.75.2
– COT Index Reading (3 Year Range):BearishBullish-ExtremeBearish-Extreme
NET POSITION MOVEMENT INDEX:
– 6-Week Change in Strength Index:-47.655.7-32.7


10-Year Treasury Note Futures:

10-Year Treasury Notes Bonds Futures COT ChartThe 10-Year Treasury Note large speculator standing this week recorded a net position of -114,845 contracts in the data reported through Tuesday. This was a weekly decrease of -114,301 contracts from the previous week which had a total of -544 net contracts.

This week’s current strength score (the trader positioning range over the past three years, measured from 0 to 100) shows the speculators are currently Bullish with a score of 58.9 percent. The commercials are Bullish with a score of 74.9 percent and the small traders (not shown in chart) are Bearish-Extreme with a score of 1.7 percent.

10-Year Treasury Note StatisticsSPECULATORSCOMMERCIALSSMALL TRADERS
– Percent of Open Interest Longs:16.573.47.2
– Percent of Open Interest Shorts:19.462.415.4
– Net Position:-114,845441,515-326,670
– Gross Longs:660,0042,937,167287,429
– Gross Shorts:774,8492,495,652614,099
– Long to Short Ratio:0.9 to 11.2 to 10.5 to 1
NET POSITION TREND:
– COT Index Score (3 Year Range Pct):58.974.91.7
– COT Index Reading (3 Year Range):BullishBullishBearish-Extreme
NET POSITION MOVEMENT INDEX:
– 6-Week Change in Strength Index:-33.941.9-24.8


Ultra 10-Year Notes Futures:

Ultra 10-Year Treasury Notes Bonds Futures COT ChartThe Ultra 10-Year Notes large speculator standing this week recorded a net position of 156,754 contracts in the data reported through Tuesday. This was a weekly boost of 17,195 contracts from the previous week which had a total of 139,559 net contracts.

This week’s current strength score (the trader positioning range over the past three years, measured from 0 to 100) shows the speculators are currently Bullish with a score of 69.1 percent. The commercials are Bearish with a score of 49.8 percent and the small traders (not shown in chart) are Bearish-Extreme with a score of 2.6 percent.

Ultra 10-Year Notes StatisticsSPECULATORSCOMMERCIALSSMALL TRADERS
– Percent of Open Interest Longs:20.072.67.0
– Percent of Open Interest Shorts:9.871.418.4
– Net Position:156,75419,632-176,386
– Gross Longs:306,6621,116,413106,942
– Gross Shorts:149,9081,096,781283,328
– Long to Short Ratio:2.0 to 11.0 to 10.4 to 1
NET POSITION TREND:
– COT Index Score (3 Year Range Pct):69.149.82.6
– COT Index Reading (3 Year Range):BullishBearishBearish-Extreme
NET POSITION MOVEMENT INDEX:
– 6-Week Change in Strength Index:16.8-15.1-6.4


US Treasury Bonds Futures:

US Year Treasury Notes Long Bonds Futures COT ChartThe US Treasury Bonds large speculator standing this week recorded a net position of -66,994 contracts in the data reported through Tuesday. This was a weekly decrease of -9,423 contracts from the previous week which had a total of -57,571 net contracts.

This week’s current strength score (the trader positioning range over the past three years, measured from 0 to 100) shows the speculators are currently Bullish with a score of 69.3 percent. The commercials are Bearish with a score of 47.9 percent and the small traders (not shown in chart) are Bearish with a score of 36.7 percent.

US Treasury Bonds StatisticsSPECULATORSCOMMERCIALSSMALL TRADERS
– Percent of Open Interest Longs:8.875.713.9
– Percent of Open Interest Shorts:14.568.215.6
– Net Position:-66,99487,013-20,019
– Gross Longs:103,650887,603163,344
– Gross Shorts:170,644800,590183,363
– Long to Short Ratio:0.6 to 11.1 to 10.9 to 1
NET POSITION TREND:
– COT Index Score (3 Year Range Pct):69.347.936.7
– COT Index Reading (3 Year Range):BullishBearishBearish
NET POSITION MOVEMENT INDEX:
– 6-Week Change in Strength Index:-2.312.9-27.1


Ultra US Treasury Bonds Futures:

Ultra US Year Treasury Notes Long Bonds Futures COT ChartThe Ultra US Treasury Bonds large speculator standing this week recorded a net position of -331,213 contracts in the data reported through Tuesday. This was a weekly reduction of -19,436 contracts from the previous week which had a total of -311,777 net contracts.

This week’s current strength score (the trader positioning range over the past three years, measured from 0 to 100) shows the speculators are currently Bullish with a score of 50.1 percent. The commercials are Bullish with a score of 74.2 percent and the small traders (not shown in chart) are Bearish with a score of 32.5 percent.

Ultra US Treasury Bonds StatisticsSPECULATORSCOMMERCIALSSMALL TRADERS
– Percent of Open Interest Longs:3.682.712.6
– Percent of Open Interest Shorts:30.856.012.1
– Net Position:-331,213325,3245,889
– Gross Longs:44,0621,007,205153,271
– Gross Shorts:375,275681,881147,382
– Long to Short Ratio:0.1 to 11.5 to 11.0 to 1
NET POSITION TREND:
– COT Index Score (3 Year Range Pct):50.174.232.5
– COT Index Reading (3 Year Range):BullishBullishBearish
NET POSITION MOVEMENT INDEX:
– 6-Week Change in Strength Index:-12.023.8-13.7


Article By InvestMacroReceive our weekly COT Reports by Email

*COT Report: The COT data, released weekly to the public each Friday, is updated through the most recent Tuesday (data is 3 days old) and shows a quick view of how large speculators or non-commercials (for-profit traders) were positioned in the futures markets.

The CFTC categorizes trader positions according to commercial hedgers (traders who use futures contracts for hedging as part of the business), non-commercials (large traders who speculate to realize trading profits) and nonreportable traders (usually small traders/speculators) as well as their open interest (contracts open in the market at time of reporting).

Find CFTC criteria here: (http://www.cftc.gov/MarketReports/CommitmentsofTraders/ExplanatoryNotes/index.htm).

COT Metals Charts: Gold Speculator bullish bets jump to 8-Week High

By InvestMacro.com COT Home | Data Tables | Data Downloads | Newsletter

Here are the latest charts and statistics for the Commitment of Traders (COT) data published by the Commodities Futures Trading Commission (CFTC).

The latest COT data is updated through Tuesday October 26th 2021 and shows a quick view of how large traders (for-profit speculators and commercial entities) were positioned in the futures markets.

Highlighting this week’s COT metals data is the speculator’s bullishness in gold. The gold speculative position jumped by over +21,000 contracts this week which marked the biggest one-week jump of the past ten weeks. This brought the overall bullish position back above the +200,000 net contract level for the first time in six weeks and to the second highest bullish standing since May 25th. Gold positions have now been in a continuous bullish position all the way back to November 13th of 2018 when positions dipped to a total of -9,247 contracts.


Data Snapshot of Commodity Market Traders | Columns Legend
Oct-26-2021OIOI-IndexSpec-NetSpec-IndexCom-NetCOM-IndexSmalls-NetSmalls-Index
WTI Crude2,144,35933423,71847-472,4124148,69484
Gold509,79428214,56062-239,6543825,09441
Silver141,581837,53260-51,5044813,97221
Copper222,9274337,27969-45,870288,59175
Palladium10,20517-2,95422,96297-844
Platinum58,1611914,90224-21,280796,37851
Natural Gas1,295,27142-138,1883796,3616141,82785
Brent200,76840-17,8109812,64815,16281
Heating Oil423,1436325,79180-49,6351823,84481
Soybeans658,9601243,23041-10,17763-33,05317
Corn1,438,93011307,81069-252,05936-55,75111
Coffee307,1956467,59398-71,91634,32318
Sugar874,74221198,60777-244,3412245,73464
Wheat405,62533763488,75349-9,51656


Gold Comex Futures:

Federal Funds 30-Day Bonds Futures COT ChartThe Gold Comex Futures large speculator standing this week reached a net position of 214,560 contracts in the data reported through Tuesday. This was a weekly gain of 21,211 contracts from the previous week which had a total of 193,349 net contracts.

This week’s current strength score (the trader positioning range over the past three years, measured from 0 to 100) shows the speculators are currently Bullish with a score of 61.7 percent. The commercials are Bearish with a score of 38.0 percent and the small traders (not shown in chart) are Bearish with a score of 41.1 percent.

Gold Futures StatisticsSPECULATORSCOMMERCIALSSMALL TRADERS
– Percent of Open Interest Longs:61.520.39.4
– Percent of Open Interest Shorts:19.467.34.4
– Net Position:214,560-239,65425,094
– Gross Longs:313,646103,42347,707
– Gross Shorts:99,086343,07722,613
– Long to Short Ratio:3.2 to 10.3 to 12.1 to 1
NET POSITION TREND:
– COT Index Score (3 Year Range Pct):61.738.041.1
– COT Index Reading (3 Year Range):BullishBearishBearish
NET POSITION MOVEMENT INDEX:
– 6-Week Change in Strength Index:1.9-1.4-3.6


Silver Comex Futures:

2-Year Treasury Bonds Futures COT ChartThe Silver Comex Futures large speculator standing this week reached a net position of 37,532 contracts in the data reported through Tuesday. This was a weekly lift of 7,176 contracts from the previous week which had a total of 30,356 net contracts.

This week’s current strength score (the trader positioning range over the past three years, measured from 0 to 100) shows the speculators are currently Bullish with a score of 59.8 percent. The commercials are Bearish with a score of 48.4 percent and the small traders (not shown in chart) are Bearish with a score of 21.4 percent.

Silver Futures StatisticsSPECULATORSCOMMERCIALSSMALL TRADERS
– Percent of Open Interest Longs:47.127.818.6
– Percent of Open Interest Shorts:20.664.18.8
– Net Position:37,532-51,50413,972
– Gross Longs:66,67739,28926,376
– Gross Shorts:29,14590,79312,404
– Long to Short Ratio:2.3 to 10.4 to 12.1 to 1
NET POSITION TREND:
– COT Index Score (3 Year Range Pct):59.848.421.4
– COT Index Reading (3 Year Range):BullishBearishBearish
NET POSITION MOVEMENT INDEX:
– 6-Week Change in Strength Index:10.8-11.13.0


Copper Grade #1 Futures:

5-Year Treasury Bonds Futures COT ChartThe Copper Grade #1 Futures large speculator standing this week reached a net position of 37,279 contracts in the data reported through Tuesday. This was a weekly decline of -3,305 contracts from the previous week which had a total of 40,584 net contracts.

This week’s current strength score (the trader positioning range over the past three years, measured from 0 to 100) shows the speculators are currently Bullish with a score of 69.2 percent. The commercials are Bearish with a score of 27.9 percent and the small traders (not shown in chart) are Bullish with a score of 75.0 percent.

Copper Futures StatisticsSPECULATORSCOMMERCIALSSMALL TRADERS
– Percent of Open Interest Longs:44.136.09.0
– Percent of Open Interest Shorts:27.356.55.1
– Net Position:37,279-45,8708,591
– Gross Longs:98,23280,16820,017
– Gross Shorts:60,953126,03811,426
– Long to Short Ratio:1.6 to 10.6 to 11.8 to 1
NET POSITION TREND:
– COT Index Score (3 Year Range Pct):69.227.975.0
– COT Index Reading (3 Year Range):BullishBearishBullish
NET POSITION MOVEMENT INDEX:
– 6-Week Change in Strength Index:6.1-6.77.3


Platinum Futures:

10-Year Treasury Notes Bonds Futures COT ChartThe Platinum Futures large speculator standing this week reached a net position of 14,902 contracts in the data reported through Tuesday. This was a weekly increase of 58 contracts from the previous week which had a total of 14,844 net contracts.

This week’s current strength score (the trader positioning range over the past three years, measured from 0 to 100) shows the speculators are currently Bearish with a score of 23.9 percent. The commercials are Bullish with a score of 78.6 percent and the small traders (not shown in chart) are Bullish with a score of 51.0 percent.

Platinum Futures StatisticsSPECULATORSCOMMERCIALSSMALL TRADERS
– Percent of Open Interest Longs:50.629.715.8
– Percent of Open Interest Shorts:25.066.34.8
– Net Position:14,902-21,2806,378
– Gross Longs:29,44517,2659,174
– Gross Shorts:14,54338,5452,796
– Long to Short Ratio:2.0 to 10.4 to 13.3 to 1
NET POSITION TREND:
– COT Index Score (3 Year Range Pct):23.978.651.0
– COT Index Reading (3 Year Range):BearishBullishBullish
NET POSITION MOVEMENT INDEX:
– 6-Week Change in Strength Index:23.1-21.4-14.5


Palladium Futures:

Ultra 10-Year Treasury Notes Bonds Futures COT ChartThe Palladium Futures large speculator standing this week reached a net position of -2,954 contracts in the data reported through Tuesday. This was a weekly reduction of -538 contracts from the previous week which had a total of -2,416 net contracts.

This week’s current strength score (the trader positioning range over the past three years, measured from 0 to 100) shows the speculators are currently Bearish-Extreme with a score of 1.6 percent. The commercials are Bullish-Extreme with a score of 96.6 percent and the small traders (not shown in chart) are Bearish with a score of 44.2 percent.

Palladium Futures StatisticsSPECULATORSCOMMERCIALSSMALL TRADERS
– Percent of Open Interest Longs:26.451.814.1
– Percent of Open Interest Shorts:55.322.814.2
– Net Position:-2,9542,962-8
– Gross Longs:2,6915,2851,437
– Gross Shorts:5,6452,3231,445
– Long to Short Ratio:0.5 to 12.3 to 11.0 to 1
NET POSITION TREND:
– COT Index Score (3 Year Range Pct):1.696.644.2
– COT Index Reading (3 Year Range):Bearish-ExtremeBullish-ExtremeBearish
NET POSITION MOVEMENT INDEX:
– 6-Week Change in Strength Index:-6.74.819.1


Article By InvestMacro.comReceive our weekly COT Reports by Email

*COT Report: The COT data, released weekly to the public each Friday, is updated through the most recent Tuesday (data is 3 days old) and shows a quick view of how large speculators or non-commercials (for-profit traders) were positioned in the futures markets.

The CFTC categorizes trader positions according to commercial hedgers (traders who use futures contracts for hedging as part of the business), non-commercials (large traders who speculate to realize trading profits) and nonreportable traders (usually small traders/speculators).

Find CFTC criteria here: (http://www.cftc.gov/MarketReports/CommitmentsofTraders/ExplanatoryNotes/index.htm).

COT Energy Charts: Brent Crude Oil speculator bets have reached best level in 54-weeks

By InvestMacro.com COT Home | Data Tables | Data Downloads | Newsletter

Here are the latest charts and statistics for the Commitment of Traders (COT) data published by the Commodities Futures Trading Commission (CFTC).

The latest COT data is updated through Tuesday October 26th 2021 and shows a quick view of how large traders (for-profit speculators and commercial entities) were positioned in the futures markets.

Highlighting this week’s COT Energy data is the Brent Oil (Last Day) contracts which have hit their best speculator position in the past fifty-four weeks, dating back to October 20th of 2020. The speculative position for Brent has continually been in a bearish overall level since 2013 but has been trending closer to a neutral or perhaps even a bullish level soon. The Brent position has now risen for seven out of the past eight weeks and by a total of +25,751 contracts over that time-frame. The strength index score (the speculative level compared to the past 3-years) has shown an extreme level for Brent with a score of 97.6 percent.
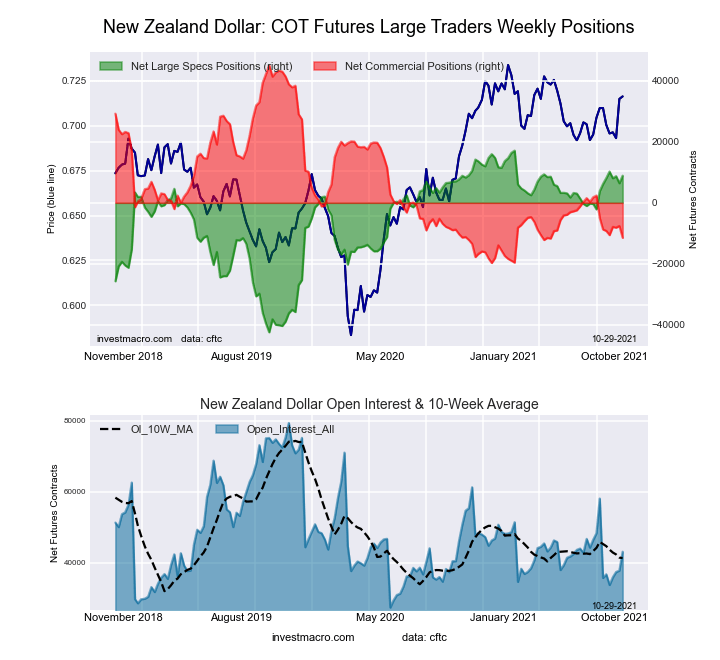
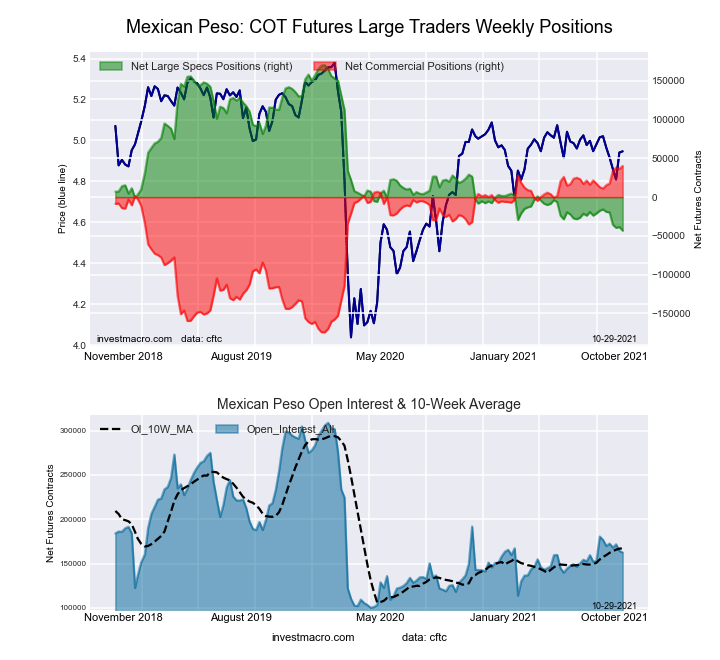

Data Snapshot of Commodity Market Traders | Columns Legend
Oct-26-2021OIOI-IndexSpec-NetSpec-IndexCom-NetCOM-IndexSmalls-NetSmalls-Index
WTI Crude2,144,35933423,71847-472,4124148,69484
Gold509,79428214,56062-239,6543825,09441
Silver141,581837,53260-51,5044813,97221
Copper222,9274337,27969-45,870288,59175
Palladium10,20517-2,95422,96297-844
Platinum58,1611914,90224-21,280796,37851
Natural Gas1,295,27142-138,1883796,3616141,82785
Brent200,76840-17,8109812,64815,16281
Heating Oil423,1436325,79180-49,6351823,84481
Soybeans658,9601243,23041-10,17763-33,05317
Corn1,438,93011307,81069-252,05936-55,75111
Coffee307,1956467,59398-71,91634,32318
Sugar874,74221198,60777-244,3412245,73464
Wheat405,62533763488,75349-9,51656


WTI Crude Oil Futures:

WTI Crude Oil Futures COT ChartThe WTI Crude Oil Futures large speculator standing this week resulted in a net position of 423,718 contracts in the data reported through Tuesday. This was a weekly decline of -5,876 contracts from the previous week which had a total of 429,594 net contracts.

This week’s current strength score (the trader positioning range over the past three years, measured from 0 to 100) shows the speculators are currently Bearish with a score of 46.9 percent. The commercials are Bearish with a score of 40.9 percent and the small traders (not shown in chart) are Bullish-Extreme with a score of 83.6 percent.

WTI Crude Oil Futures StatisticsSPECULATORSCOMMERCIALSSMALL TRADERS
– Percent of Open Interest Longs:25.732.44.7
– Percent of Open Interest Shorts:5.954.42.4
– Net Position:423,718-472,41248,694
– Gross Longs:550,171694,591100,959
– Gross Shorts:126,4531,167,00352,265
– Long to Short Ratio:4.4 to 10.6 to 11.9 to 1
NET POSITION TREND:
– COT Index Score (3 Year Range Pct):46.940.983.6
– COT Index Reading (3 Year Range):BearishBearishBullish-Extreme
NET POSITION MOVEMENT INDEX:
– 6-Week Change in Strength Index:22.0-22.69.3


Brent Crude Oil Futures:

Brent Last Day Crude Oil Futures COT ChartThe Brent Crude Oil Futures large speculator standing this week resulted in a net position of -17,810 contracts in the data reported through Tuesday. This was a weekly gain of 10,208 contracts from the previous week which had a total of -28,018 net contracts.

This week’s current strength score (the trader positioning range over the past three years, measured from 0 to 100) shows the speculators are currently Bullish-Extreme with a score of 97.6 percent. The commercials are Bearish-Extreme with a score of 0.8 percent and the small traders (not shown in chart) are Bullish-Extreme with a score of 80.7 percent.

Brent Crude Oil Futures StatisticsSPECULATORSCOMMERCIALSSMALL TRADERS
– Percent of Open Interest Longs:20.941.85.9
– Percent of Open Interest Shorts:29.835.53.3
– Net Position:-17,81012,6485,162
– Gross Longs:41,99783,84611,865
– Gross Shorts:59,80771,1986,703
– Long to Short Ratio:0.7 to 11.2 to 11.8 to 1
NET POSITION TREND:
– COT Index Score (3 Year Range Pct):97.60.880.7
– COT Index Reading (3 Year Range):Bullish-ExtremeBearish-ExtremeBullish-Extreme
NET POSITION MOVEMENT INDEX:
– 6-Week Change in Strength Index:30.5-32.716.8


Natural Gas Futures:

Natural Gas Futures COT ChartThe Natural Gas Futures large speculator standing this week resulted in a net position of -138,188 contracts in the data reported through Tuesday. This was a weekly reduction of -7,118 contracts from the previous week which had a total of -131,070 net contracts.

This week’s current strength score (the trader positioning range over the past three years, measured from 0 to 100) shows the speculators are currently Bearish with a score of 37.1 percent. The commercials are Bullish with a score of 61.2 percent and the small traders (not shown in chart) are Bullish-Extreme with a score of 84.9 percent.

Natural Gas Futures StatisticsSPECULATORSCOMMERCIALSSMALL TRADERS
– Percent of Open Interest Longs:20.144.35.1
– Percent of Open Interest Shorts:30.736.91.9
– Net Position:-138,18896,36141,827
– Gross Longs:259,785574,17765,966
– Gross Shorts:397,973477,81624,139
– Long to Short Ratio:0.7 to 11.2 to 12.7 to 1
NET POSITION TREND:
– COT Index Score (3 Year Range Pct):37.161.284.9
– COT Index Reading (3 Year Range):BearishBullishBullish-Extreme
NET POSITION MOVEMENT INDEX:
– 6-Week Change in Strength Index:3.1-3.95.2


Gasoline Blendstock Futures:

RBOB Gasoline Energy Futures COT ChartThe Gasoline Blendstock Futures large speculator standing this week resulted in a net position of 51,045 contracts in the data reported through Tuesday. This was a weekly rise of 2,403 contracts from the previous week which had a total of 48,642 net contracts.

This week’s current strength score (the trader positioning range over the past three years, measured from 0 to 100) shows the speculators are currently Bearish with a score of 22.1 percent. The commercials are Bullish with a score of 75.8 percent and the small traders (not shown in chart) are Bullish with a score of 72.1 percent.

Nasdaq Mini Futures StatisticsSPECULATORSCOMMERCIALSSMALL TRADERS
– Percent of Open Interest Longs:34.441.97.6
– Percent of Open Interest Shorts:18.461.24.4
– Net Position:51,045-61,16810,123
– Gross Longs:109,610133,47924,154
– Gross Shorts:58,565194,64714,031
– Long to Short Ratio:1.9 to 10.7 to 11.7 to 1
NET POSITION TREND:
– COT Index Score (3 Year Range Pct):22.175.872.1
– COT Index Reading (3 Year Range):BearishBullishBullish
NET POSITION MOVEMENT INDEX:
– 6-Week Change in Strength Index:9.2-9.0-0.3


#2 Heating Oil NY-Harbor Futures:

NY Harbor Heating Oil Energy Futures COT ChartThe #2 Heating Oil NY-Harbor Futures large speculator standing this week resulted in a net position of 25,791 contracts in the data reported through Tuesday. This was a weekly reduction of -650 contracts from the previous week which had a total of 26,441 net contracts.

This week’s current strength score (the trader positioning range over the past three years, measured from 0 to 100) shows the speculators are currently Bullish-Extreme with a score of 80.4 percent. The commercials are Bearish-Extreme with a score of 18.4 percent and the small traders (not shown in chart) are Bullish-Extreme with a score of 81.0 percent.

Heating Oil Futures StatisticsSPECULATORSCOMMERCIALSSMALL TRADERS
– Percent of Open Interest Longs:16.351.611.1
– Percent of Open Interest Shorts:10.263.45.5
– Net Position:25,791-49,63523,844
– Gross Longs:68,785218,43647,173
– Gross Shorts:42,994268,07123,329
– Long to Short Ratio:1.6 to 10.8 to 12.0 to 1
NET POSITION TREND:
– COT Index Score (3 Year Range Pct):80.418.481.0
– COT Index Reading (3 Year Range):Bullish-ExtremeBearish-ExtremeBullish-Extreme
NET POSITION MOVEMENT INDEX:
– 6-Week Change in Strength Index:-6.23.14.4


Bloomberg Commodity Index Futures:

Bloomberg Commodity Index Futures COT ChartThe Bloomberg Commodity Index Futures large speculator standing this week resulted in a net position of -15,174 contracts in the data reported through Tuesday. This was a weekly boost of 1,353 contracts from the previous week which had a total of -16,527 net contracts.

This week’s current strength score (the trader positioning range over the past three years, measured from 0 to 100) shows the speculators are currently Bearish with a score of 27.1 percent. The commercials are Bullish with a score of 72.3 percent and the small traders (not shown in chart) are Bullish with a score of 51.3 percent.

Bloomberg Index Futures StatisticsSPECULATORSCOMMERCIALSSMALL TRADERS
– Percent of Open Interest Longs:51.941.91.7
– Percent of Open Interest Shorts:90.25.10.1
– Net Position:-15,17414,559615
– Gross Longs:20,52216,575673
– Gross Shorts:35,6962,01658
– Long to Short Ratio:0.6 to 18.2 to 111.6 to 1
NET POSITION TREND:
– COT Index Score (3 Year Range Pct):27.172.351.3
– COT Index Reading (3 Year Range):BearishBullishBullish
NET POSITION MOVEMENT INDEX:
– 6-Week Change in Strength Index:-21.821.311.8


Article By InvestMacro.comReceive our weekly COT Reports by Email

*COT Report: The COT data, released weekly to the public each Friday, is updated through the most recent Tuesday (data is 3 days old) and shows a quick view of how large speculators or non-commercials (for-profit traders) were positioned in the futures markets.

The CFTC categorizes trader positions according to commercial hedgers (traders who use futures contracts for hedging as part of the business), non-commercials (large traders who speculate to realize trading profits) and nonreportable traders (usually small traders/speculators).

Find CFTC criteria here: (http://www.cftc.gov/MarketReports/CommitmentsofTraders/ExplanatoryNotes/index.htm).

COT Soft Commodities Charts: Speculators push Corn bullish bets to 9-week high

By InvestMacro.com COT Home | Data Tables | Data Downloads | Newsletter

Here are the latest charts and statistics for the Commitment of Traders (COT) data published by the Commodities Futures Trading Commission (CFTC).

The latest COT data is updated through Tuesday October 26th 2021 and shows a quick view of how large traders (for-profit speculators and commercial entities) were positioned in the futures markets.

Highlighting this week’s COT Soft Commodity’s data is the speculator’s sharp increase in bullish bets for Corn. Corn bets jumped by over +30,000 contracts this week which marked the largest one-week gain in the past forty-three weeks. The rise brought the overall net position back above the +300,000 net contract level for the first time since August 31st. Overall, Corn speculative positions have remained in bullish territory for sixty-one weeks after turning from bearish to bullish back in August of 2020.


Data Snapshot of Commodity Market Traders | Columns Legend
Oct-26-2021OIOI-IndexSpec-NetSpec-IndexCom-NetCOM-IndexSmalls-NetSmalls-Index
WTI Crude2,144,35933423,71847-472,4124148,69484
Gold509,79428214,56062-239,6543825,09441
Silver141,581837,53260-51,5044813,97221
Copper222,9274337,27969-45,870288,59175
Palladium10,20517-2,95422,96297-844
Platinum58,1611914,90224-21,280796,37851
Natural Gas1,295,27142-138,1883796,3616141,82785
Brent200,76840-17,8109812,64815,16281
Heating Oil423,1436325,79180-49,6351823,84481
Soybeans658,9601243,23041-10,17763-33,05317
Corn1,438,93011307,81069-252,05936-55,75111
Coffee307,1956467,59398-71,91634,32318
Sugar874,74221198,60777-244,3412245,73464
Wheat405,62533763488,75349-9,51656


CORN Futures:

Federal Funds 30-Day Bonds Futures COT ChartThe CORN large speculator standing this week totaled a net position of 307,810 contracts in the data reported through Tuesday. This was a weekly rise of 30,781 contracts from the previous week which had a total of 277,029 net contracts.

This week’s current strength score (the trader positioning range over the past three years, measured from 0 to 100) shows the speculators are currently Bullish with a score of 69.4 percent. The commercials are Bearish with a score of 36.0 percent and the small traders (not shown in chart) are Bearish-Extreme with a score of 11.0 percent.

CORN Futures StatisticsSPECULATORSCOMMERCIALSSMALL TRADERS
– Percent of Open Interest Longs:28.148.59.2
– Percent of Open Interest Shorts:6.766.113.1
– Net Position:307,810-252,059-55,751
– Gross Longs:404,890698,417132,371
– Gross Shorts:97,080950,476188,122
– Long to Short Ratio:4.2 to 10.7 to 10.7 to 1
NET POSITION TREND:
– COT Index Score (3 Year Range Pct):69.436.011.0
– COT Index Reading (3 Year Range):BullishBearishBearish-Extreme
NET POSITION MOVEMENT INDEX:
– 6-Week Change in Strength Index:6.3-8.66.6


SUGAR Futures:

2-Year Treasury Bonds Futures COT ChartThe SUGAR large speculator standing this week totaled a net position of 198,607 contracts in the data reported through Tuesday. This was a weekly fall of -12,943 contracts from the previous week which had a total of 211,550 net contracts.

This week’s current strength score (the trader positioning range over the past three years, measured from 0 to 100) shows the speculators are currently Bullish with a score of 77.4 percent. The commercials are Bearish with a score of 21.8 percent and the small traders (not shown in chart) are Bullish with a score of 64.4 percent.

SUGAR Futures StatisticsSPECULATORSCOMMERCIALSSMALL TRADERS
– Percent of Open Interest Longs:29.644.910.9
– Percent of Open Interest Shorts:6.972.85.6
– Net Position:198,607-244,34145,734
– Gross Longs:258,776392,73394,957
– Gross Shorts:60,169637,07449,223
– Long to Short Ratio:4.3 to 10.6 to 11.9 to 1
NET POSITION TREND:
– COT Index Score (3 Year Range Pct):77.421.864.4
– COT Index Reading (3 Year Range):BullishBearishBullish
NET POSITION MOVEMENT INDEX:
– 6-Week Change in Strength Index:-12.410.93.6


COFFEE Futures:

5-Year Treasury Bonds Futures COT ChartThe COFFEE large speculator standing this week totaled a net position of 67,593 contracts in the data reported through Tuesday. This was a weekly fall of -1,296 contracts from the previous week which had a total of 68,889 net contracts.

This week’s current strength score (the trader positioning range over the past three years, measured from 0 to 100) shows the speculators are currently Bullish-Extreme with a score of 97.7 percent. The commercials are Bearish-Extreme with a score of 3.5 percent and the small traders (not shown in chart) are Bearish-Extreme with a score of 18.2 percent.

COFFEE Futures StatisticsSPECULATORSCOMMERCIALSSMALL TRADERS
– Percent of Open Interest Longs:27.640.93.6
– Percent of Open Interest Shorts:5.664.32.2
– Net Position:67,593-71,9164,323
– Gross Longs:84,760125,63211,211
– Gross Shorts:17,167197,5486,888
– Long to Short Ratio:4.9 to 10.6 to 11.6 to 1
NET POSITION TREND:
– COT Index Score (3 Year Range Pct):97.73.518.2
– COT Index Reading (3 Year Range):Bullish-ExtremeBearish-ExtremeBearish-Extreme
NET POSITION MOVEMENT INDEX:
– 6-Week Change in Strength Index:6.9-7.50.3


SOYBEANS Futures:

10-Year Treasury Notes Bonds Futures COT ChartThe SOYBEANS large speculator standing this week totaled a net position of 43,230 contracts in the data reported through Tuesday. This was a weekly reduction of -311 contracts from the previous week which had a total of 43,541 net contracts.

This week’s current strength score (the trader positioning range over the past three years, measured from 0 to 100) shows the speculators are currently Bearish with a score of 41.1 percent. The commercials are Bullish with a score of 63.4 percent and the small traders (not shown in chart) are Bearish-Extreme with a score of 16.8 percent.

SOYBEANS Futures StatisticsSPECULATORSCOMMERCIALSSMALL TRADERS
– Percent of Open Interest Longs:19.157.38.0
– Percent of Open Interest Shorts:12.658.913.1
– Net Position:43,230-10,177-33,053
– Gross Longs:126,049377,73253,042
– Gross Shorts:82,819387,90986,095
– Long to Short Ratio:1.5 to 11.0 to 10.6 to 1
NET POSITION TREND:
– COT Index Score (3 Year Range Pct):41.163.416.8
– COT Index Reading (3 Year Range):BearishBullishBearish-Extreme
NET POSITION MOVEMENT INDEX:
– 6-Week Change in Strength Index:-5.68.3-21.4


SOYBEAN MEAL Futures:

US Year Treasury Notes Long Bonds Futures COT ChartThe SOYBEAN MEAL large speculator standing this week totaled a net position of 23,419 contracts in the data reported through Tuesday. This was a weekly boost of 14,305 contracts from the previous week which had a total of 9,114 net contracts.

This week’s current strength score (the trader positioning range over the past three years, measured from 0 to 100) shows the speculators are currently Bearish with a score of 42.5 percent. The commercials are Bullish with a score of 54.4 percent and the small traders (not shown in chart) are Bullish with a score of 71.2 percent.

SOYBEAN MEAL Futures StatisticsSPECULATORSCOMMERCIALSSMALL TRADERS
– Percent of Open Interest Longs:20.447.712.6
– Percent of Open Interest Shorts:15.158.76.9
– Net Position:23,419-48,52125,102
– Gross Longs:90,211210,36455,643
– Gross Shorts:66,792258,88530,541
– Long to Short Ratio:1.4 to 10.8 to 11.8 to 1
NET POSITION TREND:
– COT Index Score (3 Year Range Pct):42.554.471.2
– COT Index Reading (3 Year Range):BearishBullishBullish
NET POSITION MOVEMENT INDEX:
– 6-Week Change in Strength Index:6.1-10.734.5


LIVE CATTLE Futures:

Ultra US Year Treasury Notes Long Bonds Futures COT ChartThe LIVE CATTLE large speculator standing this week totaled a net position of 44,978 contracts in the data reported through Tuesday. This was a weekly fall of -3,513 contracts from the previous week which had a total of 48,491 net contracts.

This week’s current strength score (the trader positioning range over the past three years, measured from 0 to 100) shows the speculators are currently Bearish-Extreme with a score of 19.2 percent. The commercials are Bullish with a score of 76.8 percent and the small traders (not shown in chart) are Bullish with a score of 69.9 percent.

LIVE CATTLE Futures StatisticsSPECULATORSCOMMERCIALSSMALL TRADERS
– Percent of Open Interest Longs:32.641.710.4
– Percent of Open Interest Shorts:16.854.912.9
– Net Position:44,978-37,895-7,083
– Gross Longs:93,043119,06329,714
– Gross Shorts:48,065156,95836,797
– Long to Short Ratio:1.9 to 10.8 to 10.8 to 1
NET POSITION TREND:
– COT Index Score (3 Year Range Pct):19.276.869.9
– COT Index Reading (3 Year Range):Bearish-ExtremeBullishBullish
NET POSITION MOVEMENT INDEX:
– 6-Week Change in Strength Index:-5.55.15.0


LEAN HOGS Futures:

Eurodollar Bonds Futures COT ChartThe LEAN HOGS large speculator standing this week totaled a net position of 54,057 contracts in the data reported through Tuesday. This was a weekly decline of -11,125 contracts from the previous week which had a total of 65,182 net contracts.

This week’s current strength score (the trader positioning range over the past three years, measured from 0 to 100) shows the speculators are currently Bullish with a score of 66.9 percent. The commercials are Bearish with a score of 42.6 percent and the small traders (not shown in chart) are Bearish-Extreme with a score of 9.5 percent.

LEAN HOGS Futures StatisticsSPECULATORSCOMMERCIALSSMALL TRADERS
– Percent of Open Interest Longs:39.832.77.5
– Percent of Open Interest Shorts:16.849.214.0
– Net Position:54,057-38,763-15,294
– Gross Longs:93,40676,62017,605
– Gross Shorts:39,349115,38332,899
– Long to Short Ratio:2.4 to 10.7 to 10.5 to 1
NET POSITION TREND:
– COT Index Score (3 Year Range Pct):66.942.69.5
– COT Index Reading (3 Year Range):BullishBearishBearish-Extreme
NET POSITION MOVEMENT INDEX:
– 6-Week Change in Strength Index:-13.814.1-0.6


COTTON Futures:

Ultra 10-Year Treasury Notes Bonds Futures COT ChartThe COTTON large speculator standing this week totaled a net position of 102,069 contracts in the data reported through Tuesday. This was a weekly decline of -2,354 contracts from the previous week which had a total of 104,423 net contracts.

This week’s current strength score (the trader positioning range over the past three years, measured from 0 to 100) shows the speculators are currently Bullish-Extreme with a score of 87.7 percent. The commercials are Bearish-Extreme with a score of 10.7 percent and the small traders (not shown in chart) are Bullish-Extreme with a score of 94.1 percent.

COTTON Futures StatisticsSPECULATORSCOMMERCIALSSMALL TRADERS
– Percent of Open Interest Longs:39.738.27.9
– Percent of Open Interest Shorts:3.978.53.4
– Net Position:102,069-114,97012,901
– Gross Longs:113,246108,97922,564
– Gross Shorts:11,177223,9499,663
– Long to Short Ratio:10.1 to 10.5 to 12.3 to 1
NET POSITION TREND:
– COT Index Score (3 Year Range Pct):87.710.794.1
– COT Index Reading (3 Year Range):Bullish-ExtremeBearish-ExtremeBullish-Extreme
NET POSITION MOVEMENT INDEX:
– 6-Week Change in Strength Index:-3.92.412.9


COCOA Futures:

US Year Treasury Notes Long Bonds Futures COT ChartThe COCOA large speculator standing this week totaled a net position of 19,198 contracts in the data reported through Tuesday. This was a weekly lowering of -3,623 contracts from the previous week which had a total of 22,821 net contracts.

This week’s current strength score (the trader positioning range over the past three years, measured from 0 to 100) shows the speculators are currently Bearish with a score of 40.8 percent. The commercials are Bullish with a score of 58.1 percent and the small traders (not shown in chart) are Bullish with a score of 54.6 percent.

COCOA Futures StatisticsSPECULATORSCOMMERCIALSSMALL TRADERS
– Percent of Open Interest Longs:25.252.44.8
– Percent of Open Interest Shorts:17.461.93.1
– Net Position:19,198-23,2564,058
– Gross Longs:61,920128,63711,662
– Gross Shorts:42,722151,8937,604
– Long to Short Ratio:1.4 to 10.8 to 11.5 to 1
NET POSITION TREND:
– COT Index Score (3 Year Range Pct):40.858.154.6
– COT Index Reading (3 Year Range):BearishBullishBullish
NET POSITION MOVEMENT INDEX:
– 6-Week Change in Strength Index:-8.16.912.7


WHEAT Futures:

Ultra US Year Treasury Notes Long Bonds Futures COT ChartThe WHEAT large speculator standing this week totaled a net position of 763 contracts in the data reported through Tuesday. This was a weekly lift of 9,329 contracts from the previous week which had a total of -8,566 net contracts.

This week’s current strength score (the trader positioning range over the past three years, measured from 0 to 100) shows the speculators are currently Bearish with a score of 47.7 percent. The commercials are Bearish with a score of 49.4 percent and the small traders (not shown in chart) are Bullish with a score of 56.1 percent.

WHEAT Futures StatisticsSPECULATORSCOMMERCIALSSMALL TRADERS
– Percent of Open Interest Longs:25.238.87.8
– Percent of Open Interest Shorts:25.036.610.2
– Net Position:7638,753-9,516
– Gross Longs:102,322157,39231,777
– Gross Shorts:101,559148,63941,293
– Long to Short Ratio:1.0 to 11.1 to 10.8 to 1
NET POSITION TREND:
– COT Index Score (3 Year Range Pct):47.749.456.1
– COT Index Reading (3 Year Range):BearishBearishBullish
NET POSITION MOVEMENT INDEX:
– 6-Week Change in Strength Index:-3.20.714.9


Article By InvestMacro.comReceive our weekly COT Reports by Email

*COT Report: The COT data, released weekly to the public each Friday, is updated through the most recent Tuesday (data is 3 days old) and shows a quick view of how large speculators or non-commercials (for-profit traders) were positioned in the futures markets.

The CFTC categorizes trader positions according to commercial hedgers (traders who use futures contracts for hedging as part of the business), non-commercials (large traders who speculate to realize trading profits) and nonreportable traders (usually small traders/speculators).

Find CFTC criteria here: (http://www.cftc.gov/MarketReports/CommitmentsofTraders/ExplanatoryNotes/index.htm).