
By InvestMacro.com COT Home | Data Tables | Data Downloads | Newsletter
Here are the latest charts and statistics for the Commitment of Traders (COT) data published by the Commodities Futures Trading Commission (CFTC).
The latest COT data is updated through Tuesday October 26th 2021 and shows a quick view of how large traders (for-profit speculators and commercial entities) were positioned in the futures markets.
Highlighting this week’s COT Bonds data is the 5-Year Treasury Bond’s speculator positions that fell to a forty-six week low-point. The 5-year bond speculative position declined by over -86,000 contracts this week and fell for the fifth time in the past six weeks. The spec position has now fallen by a total -317,109 contracts over the past six weeks. The current net bearish standing sits at a total of -341,475 contracts for the 5-year bond speculators which registers as the most bearish level since December 8th of 2020 when net positions totaled -342,024 contracts.
| Oct-26-2021 | OI | OI-Index | Spec-Net | Spec-Index | Com-Net | COM-Index | Smalls-Net | Smalls-Index |
|---|---|---|---|---|---|---|---|---|
| Eurodollar | 12,675,714 | 68 | -724,993 | 36 | 1,046,056 | 59 | -321,063 | 61 |
| FedFunds | 1,293,093 | 23 | -44,591 | 34 | 54,410 | 66 | -9,819 | 44 |
| 2-Year | 2,029,079 | 10 | -112,318 | 67 | 154,788 | 47 | -42,470 | 1 |
| Long T-Bond | 1,173,180 | 44 | -66,994 | 69 | 87,013 | 48 | -20,019 | 37 |
| 10-Year | 4,000,227 | 64 | -114,845 | 59 | 441,515 | 75 | -326,670 | 2 |
| 5-Year | 3,586,544 | 25 | -341,475 | 34 | 579,881 | 91 | -238,406 | 5 |
3-Month Eurodollars Futures:
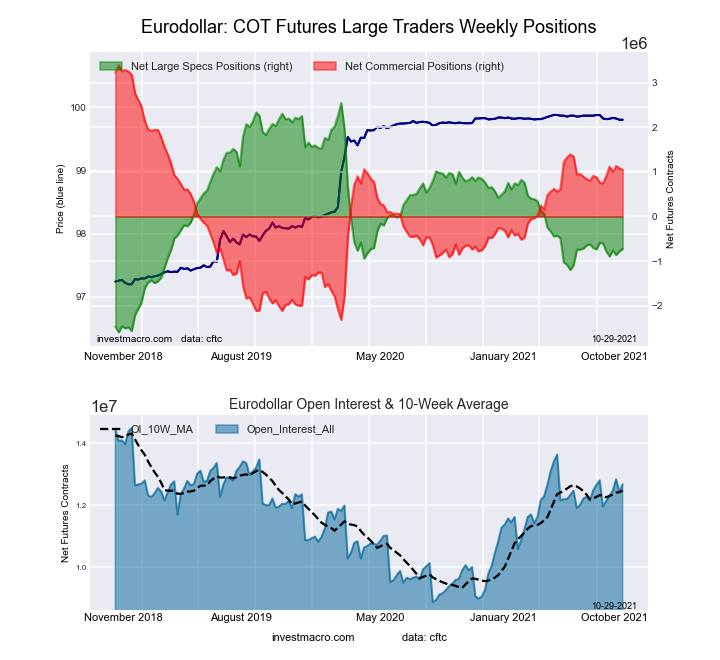 The 3-Month Eurodollars large speculator standing this week recorded a net position of -724,993 contracts in the data reported through Tuesday. This was a weekly rise of 56,207 contracts from the previous week which had a total of -781,200 net contracts.
Free Reports:
 Get our Weekly Commitment of Traders Reports - See where the biggest traders (Hedge Funds and Commercial Hedgers) are positioned in the futures markets on a weekly basis.
 Sign Up for Our Stock Market Newsletter – Get updated on News, Charts & Rankings of Public Companies when you join our Stocks Newsletter
This week’s current strength score (the trader positioning range over the past three years, measured from 0 to 100) shows the speculators are currently Bearish with a score of 36.4 percent. The commercials are Bullish with a score of 58.9 percent and the small traders (not shown in chart) are Bullish with a score of 61.2 percent.
| 3-Month Eurodollars Statistics | SPECULATORS | COMMERCIALS | SMALL TRADERS |
| – Percent of Open Interest Longs: | 13.5 | 63.7 | 4.3 |
| – Percent of Open Interest Shorts: | 19.2 | 55.5 | 6.9 |
| – Net Position: | -724,993 | 1,046,056 | -321,063 |
| – Gross Longs: | 1,711,694 | 8,076,945 | 551,131 |
| – Gross Shorts: | 2,436,687 | 7,030,889 | 872,194 |
| – Long to Short Ratio: | 0.7 to 1 | 1.1 to 1 | 0.6 to 1 |
| NET POSITION TREND: | |||
| – COT Index Score (3 Year Range Pct): | 36.4 | 58.9 | 61.2 |
| – COT Index Reading (3 Year Range): | Bearish | Bullish | Bullish |
| NET POSITION MOVEMENT INDEX: | |||
| – 6-Week Change in Strength Index: | -2.4 | 5.3 | -23.8 |
30-Day Federal Funds Futures:
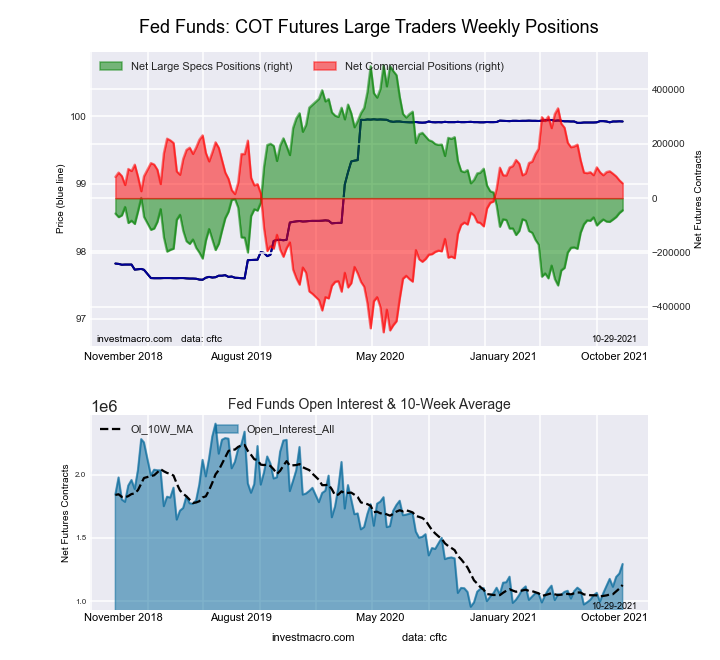 The 30-Day Federal Funds large speculator standing this week recorded a net position of -44,591 contracts in the data reported through Tuesday. This was a weekly rise of 9,893 contracts from the previous week which had a total of -54,484 net contracts.
This week’s current strength score (the trader positioning range over the past three years, measured from 0 to 100) shows the speculators are currently Bearish with a score of 34.1 percent. The commercials are Bullish with a score of 66.5 percent and the small traders (not shown in chart) are Bearish with a score of 44.1 percent.
| 30-Day Federal Funds Statistics | SPECULATORS | COMMERCIALS | SMALL TRADERS |
| – Percent of Open Interest Longs: | 5.6 | 78.6 | 1.4 |
| – Percent of Open Interest Shorts: | 9.1 | 74.4 | 2.1 |
| – Net Position: | -44,591 | 54,410 | -9,819 |
| – Gross Longs: | 72,575 | 1,016,206 | 17,945 |
| – Gross Shorts: | 117,166 | 961,796 | 27,764 |
| – Long to Short Ratio: | 0.6 to 1 | 1.1 to 1 | 0.6 to 1 |
| NET POSITION TREND: | |||
| – COT Index Score (3 Year Range Pct): | 34.1 | 66.5 | 44.1 |
| – COT Index Reading (3 Year Range): | Bearish | Bullish | Bearish |
| NET POSITION MOVEMENT INDEX: | |||
| – 6-Week Change in Strength Index: | 4.2 | -3.6 | -8.1 |
2-Year Treasury Note Futures:
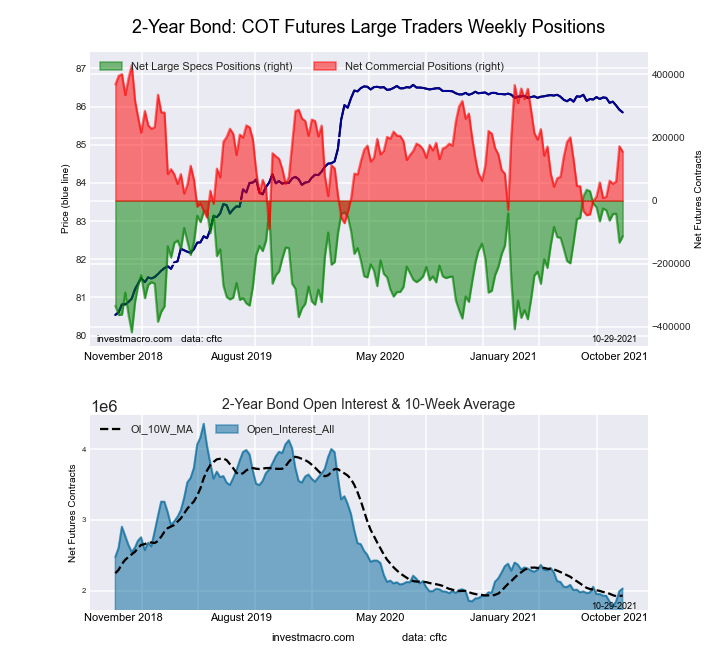 The 2-Year Treasury Note large speculator standing this week recorded a net position of -112,318 contracts in the data reported through Tuesday. This was a weekly rise of 20,634 contracts from the previous week which had a total of -132,952 net contracts.
This week’s current strength score (the trader positioning range over the past three years, measured from 0 to 100) shows the speculators are currently Bullish with a score of 67.5 percent. The commercials are Bearish with a score of 47.2 percent and the small traders (not shown in chart) are Bearish-Extreme with a score of 0.5 percent.
| 2-Year Treasury Note Statistics | SPECULATORS | COMMERCIALS | SMALL TRADERS |
| – Percent of Open Interest Longs: | 16.3 | 73.8 | 6.8 |
| – Percent of Open Interest Shorts: | 21.8 | 66.2 | 8.9 |
| – Net Position: | -112,318 | 154,788 | -42,470 |
| – Gross Longs: | 330,130 | 1,497,320 | 138,359 |
| – Gross Shorts: | 442,448 | 1,342,532 | 180,829 |
| – Long to Short Ratio: | 0.7 to 1 | 1.1 to 1 | 0.8 to 1 |
| NET POSITION TREND: | |||
| – COT Index Score (3 Year Range Pct): | 67.5 | 47.2 | 0.5 |
| – COT Index Reading (3 Year Range): | Bullish | Bearish | Bearish-Extreme |
| NET POSITION MOVEMENT INDEX: | |||
| – 6-Week Change in Strength Index: | -19.4 | 28.2 | -35.2 |
5-Year Treasury Note Futures:
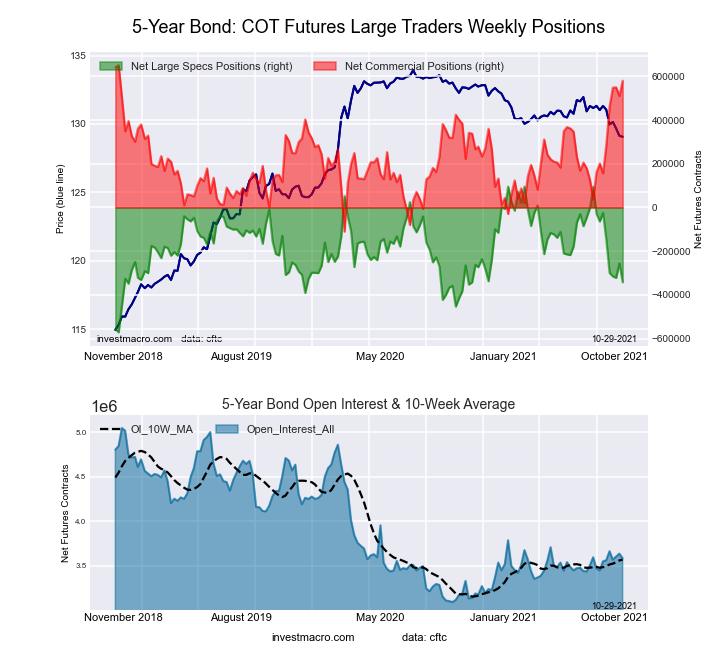 The 5-Year Treasury Note large speculator standing this week recorded a net position of -341,475 contracts in the data reported through Tuesday. This was a weekly decrease of -86,264 contracts from the previous week which had a total of -255,211 net contracts.
This week’s current strength score (the trader positioning range over the past three years, measured from 0 to 100) shows the speculators are currently Bearish with a score of 34.4 percent. The commercials are Bullish-Extreme with a score of 90.7 percent and the small traders (not shown in chart) are Bearish-Extreme with a score of 5.2 percent.
| 5-Year Treasury Note Statistics | SPECULATORS | COMMERCIALS | SMALL TRADERS |
| – Percent of Open Interest Longs: | 10.0 | 79.3 | 7.1 |
| – Percent of Open Interest Shorts: | 19.5 | 63.1 | 13.8 |
| – Net Position: | -341,475 | 579,881 | -238,406 |
| – Gross Longs: | 359,180 | 2,844,217 | 255,899 |
| – Gross Shorts: | 700,655 | 2,264,336 | 494,305 |
| – Long to Short Ratio: | 0.5 to 1 | 1.3 to 1 | 0.5 to 1 |
| NET POSITION TREND: | |||
| – COT Index Score (3 Year Range Pct): | 34.4 | 90.7 | 5.2 |
| – COT Index Reading (3 Year Range): | Bearish | Bullish-Extreme | Bearish-Extreme |
| NET POSITION MOVEMENT INDEX: | |||
| – 6-Week Change in Strength Index: | -47.6 | 55.7 | -32.7 |
10-Year Treasury Note Futures:
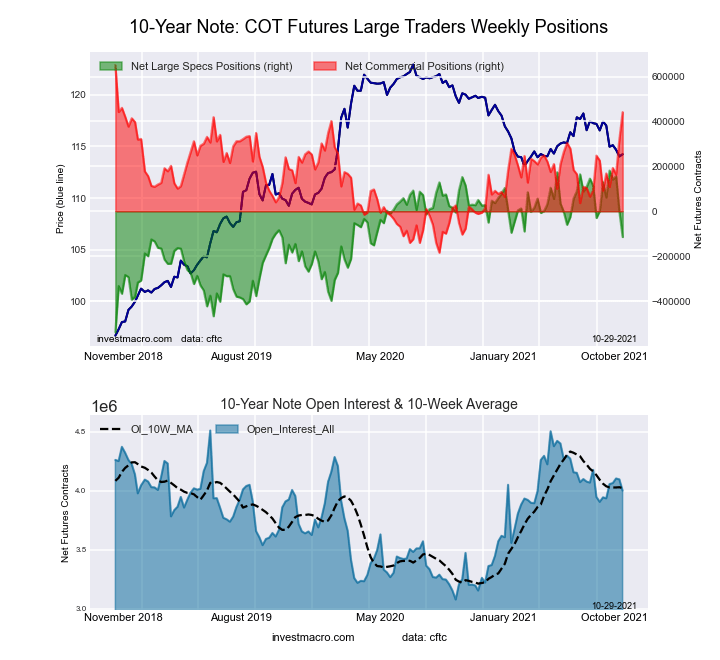 The 10-Year Treasury Note large speculator standing this week recorded a net position of -114,845 contracts in the data reported through Tuesday. This was a weekly decrease of -114,301 contracts from the previous week which had a total of -544 net contracts.
This week’s current strength score (the trader positioning range over the past three years, measured from 0 to 100) shows the speculators are currently Bullish with a score of 58.9 percent. The commercials are Bullish with a score of 74.9 percent and the small traders (not shown in chart) are Bearish-Extreme with a score of 1.7 percent.
| 10-Year Treasury Note Statistics | SPECULATORS | COMMERCIALS | SMALL TRADERS |
| – Percent of Open Interest Longs: | 16.5 | 73.4 | 7.2 |
| – Percent of Open Interest Shorts: | 19.4 | 62.4 | 15.4 |
| – Net Position: | -114,845 | 441,515 | -326,670 |
| – Gross Longs: | 660,004 | 2,937,167 | 287,429 |
| – Gross Shorts: | 774,849 | 2,495,652 | 614,099 |
| – Long to Short Ratio: | 0.9 to 1 | 1.2 to 1 | 0.5 to 1 |
| NET POSITION TREND: | |||
| – COT Index Score (3 Year Range Pct): | 58.9 | 74.9 | 1.7 |
| – COT Index Reading (3 Year Range): | Bullish | Bullish | Bearish-Extreme |
| NET POSITION MOVEMENT INDEX: | |||
| – 6-Week Change in Strength Index: | -33.9 | 41.9 | -24.8 |
Ultra 10-Year Notes Futures:
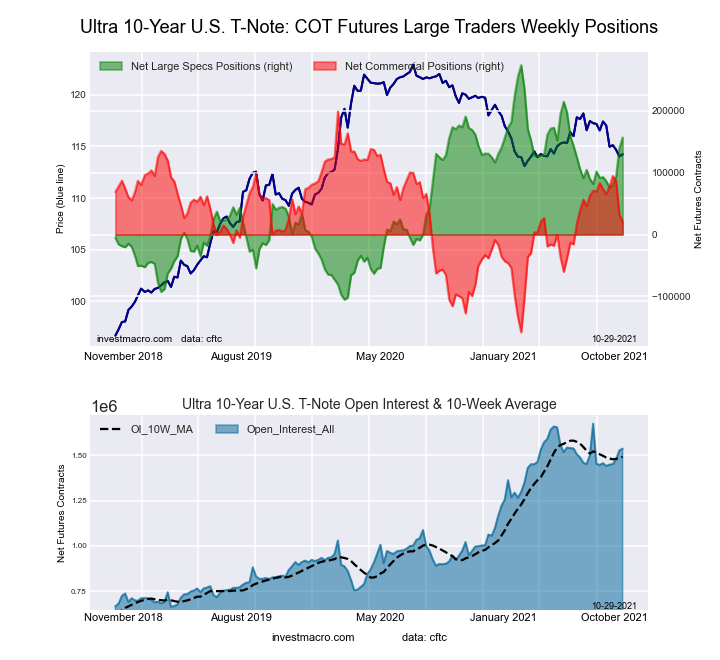 The Ultra 10-Year Notes large speculator standing this week recorded a net position of 156,754 contracts in the data reported through Tuesday. This was a weekly boost of 17,195 contracts from the previous week which had a total of 139,559 net contracts.
This week’s current strength score (the trader positioning range over the past three years, measured from 0 to 100) shows the speculators are currently Bullish with a score of 69.1 percent. The commercials are Bearish with a score of 49.8 percent and the small traders (not shown in chart) are Bearish-Extreme with a score of 2.6 percent.
| Ultra 10-Year Notes Statistics | SPECULATORS | COMMERCIALS | SMALL TRADERS |
| – Percent of Open Interest Longs: | 20.0 | 72.6 | 7.0 |
| – Percent of Open Interest Shorts: | 9.8 | 71.4 | 18.4 |
| – Net Position: | 156,754 | 19,632 | -176,386 |
| – Gross Longs: | 306,662 | 1,116,413 | 106,942 |
| – Gross Shorts: | 149,908 | 1,096,781 | 283,328 |
| – Long to Short Ratio: | 2.0 to 1 | 1.0 to 1 | 0.4 to 1 |
| NET POSITION TREND: | |||
| – COT Index Score (3 Year Range Pct): | 69.1 | 49.8 | 2.6 |
| – COT Index Reading (3 Year Range): | Bullish | Bearish | Bearish-Extreme |
| NET POSITION MOVEMENT INDEX: | |||
| – 6-Week Change in Strength Index: | 16.8 | -15.1 | -6.4 |
US Treasury Bonds Futures:
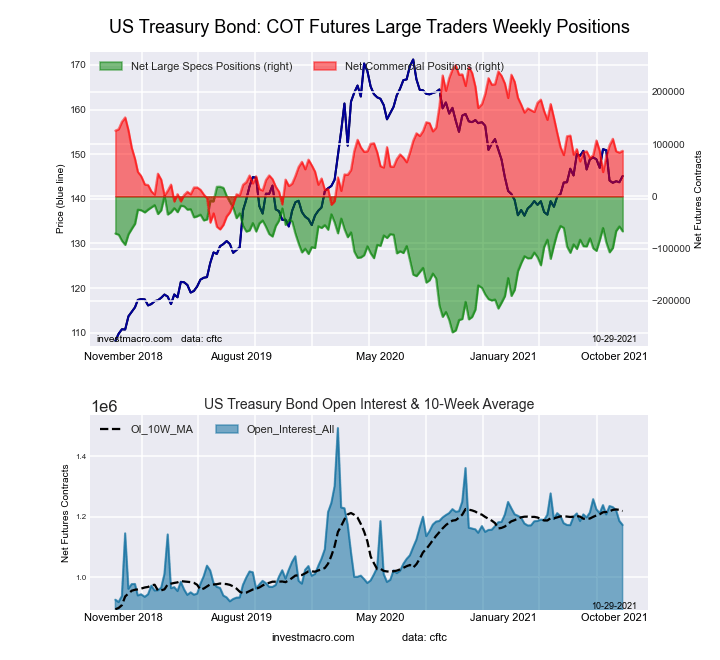 The US Treasury Bonds large speculator standing this week recorded a net position of -66,994 contracts in the data reported through Tuesday. This was a weekly decrease of -9,423 contracts from the previous week which had a total of -57,571 net contracts.
This week’s current strength score (the trader positioning range over the past three years, measured from 0 to 100) shows the speculators are currently Bullish with a score of 69.3 percent. The commercials are Bearish with a score of 47.9 percent and the small traders (not shown in chart) are Bearish with a score of 36.7 percent.
| US Treasury Bonds Statistics | SPECULATORS | COMMERCIALS | SMALL TRADERS |
| – Percent of Open Interest Longs: | 8.8 | 75.7 | 13.9 |
| – Percent of Open Interest Shorts: | 14.5 | 68.2 | 15.6 |
| – Net Position: | -66,994 | 87,013 | -20,019 |
| – Gross Longs: | 103,650 | 887,603 | 163,344 |
| – Gross Shorts: | 170,644 | 800,590 | 183,363 |
| – Long to Short Ratio: | 0.6 to 1 | 1.1 to 1 | 0.9 to 1 |
| NET POSITION TREND: | |||
| – COT Index Score (3 Year Range Pct): | 69.3 | 47.9 | 36.7 |
| – COT Index Reading (3 Year Range): | Bullish | Bearish | Bearish |
| NET POSITION MOVEMENT INDEX: | |||
| – 6-Week Change in Strength Index: | -2.3 | 12.9 | -27.1 |
Ultra US Treasury Bonds Futures:
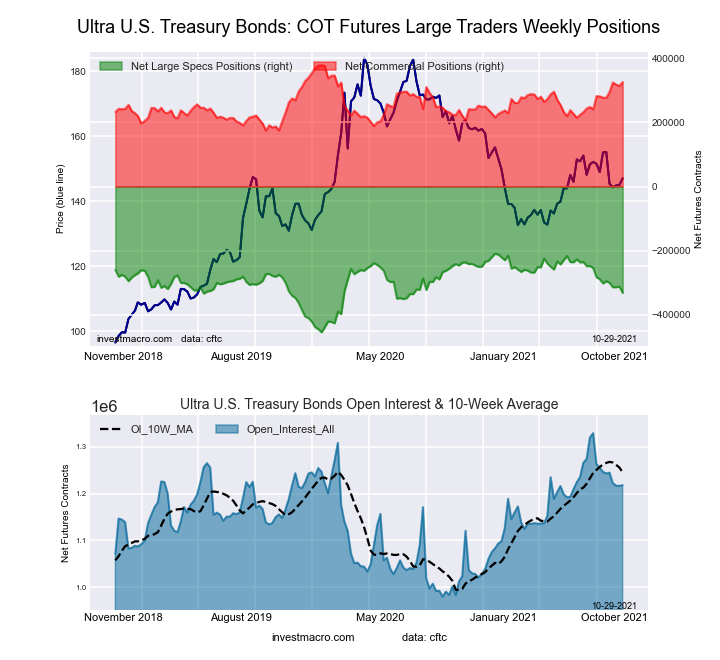 The Ultra US Treasury Bonds large speculator standing this week recorded a net position of -331,213 contracts in the data reported through Tuesday. This was a weekly reduction of -19,436 contracts from the previous week which had a total of -311,777 net contracts.
This week’s current strength score (the trader positioning range over the past three years, measured from 0 to 100) shows the speculators are currently Bullish with a score of 50.1 percent. The commercials are Bullish with a score of 74.2 percent and the small traders (not shown in chart) are Bearish with a score of 32.5 percent.
| Ultra US Treasury Bonds Statistics | SPECULATORS | COMMERCIALS | SMALL TRADERS |
| – Percent of Open Interest Longs: | 3.6 | 82.7 | 12.6 |
| – Percent of Open Interest Shorts: | 30.8 | 56.0 | 12.1 |
| – Net Position: | -331,213 | 325,324 | 5,889 |
| – Gross Longs: | 44,062 | 1,007,205 | 153,271 |
| – Gross Shorts: | 375,275 | 681,881 | 147,382 |
| – Long to Short Ratio: | 0.1 to 1 | 1.5 to 1 | 1.0 to 1 |
| NET POSITION TREND: | |||
| – COT Index Score (3 Year Range Pct): | 50.1 | 74.2 | 32.5 |
| – COT Index Reading (3 Year Range): | Bullish | Bullish | Bearish |
| NET POSITION MOVEMENT INDEX: | |||
| – 6-Week Change in Strength Index: | -12.0 | 23.8 | -13.7 |
Article By InvestMacro – Receive our weekly COT Reports by Email
*COT Report: The COT data, released weekly to the public each Friday, is updated through the most recent Tuesday (data is 3 days old) and shows a quick view of how large speculators or non-commercials (for-profit traders) were positioned in the futures markets.
The CFTC categorizes trader positions according to commercial hedgers (traders who use futures contracts for hedging as part of the business), non-commercials (large traders who speculate to realize trading profits) and nonreportable traders (usually small traders/speculators) as well as their open interest (contracts open in the market at time of reporting).
Find CFTC criteria here: (http://www.cftc.gov/MarketReports/CommitmentsofTraders/ExplanatoryNotes/index.htm).

- COT Metals Charts: Weekly Speculator Bets see small gains for Silver & Gold Jul 12, 2026
- COT Bonds Charts: Speculator Bets led by SOFR 3-Months & 2-Year Bonds Jul 12, 2026
- COT Energy Charts: Weekly Speculator Changes led by Brent Oil Jul 12, 2026
- COT Soft Commodities Charts: Weekly Speculator Changes led by Sugar, Corn & Soybeans Jul 12, 2026
- The US and European stock indices are rising again amid renewed investor interest in the AI industry. Jul 10, 2026
- USD/JPY Falls as Yen Recovers Weekly Losses Jul 10, 2026
- Crude oil prices surged sharply by 7% in reaction to the rapid escalation of the conflict in the Middle East Jul 9, 2026
- Middle East Tensions Weigh on Gold Jul 9, 2026
- Pound Awaits Tighter Policy from Bank of England Jul 8, 2026
- The United States carried out airstrikes on Iran after Iran’s attacked tankers in the Strait of Hormuz. The RBNZ raised the interest rate to 2.5% Jul 8, 2026