
By InvestMacro | COT | Data Tables | COT Leaders | Downloads | COT Newsletter
Here are the latest charts and statistics for the Commitment of Traders (COT) data published by the Commodities Futures Trading Commission (CFTC).
The latest COT data is updated through Tuesday November 2nd 2021 and shows a quick view of how large traders (for-profit speculators and commercial entities) were positioned in the futures markets.
Highlighting this week’s COT Soft Commodity data is once again the rise in speculator positioning for Corn. The speculator bets for Corn jumped by over +75,000 contracts this week following a gain of over +30,000 contracts last week. This marked the largest one-week increase in net positions in a year (November 3rd 2020). Corn is now at the most bullish net speculator level of the past nineteen weeks, dating back to June 22nd.
| Nov-02-2021 | OI | OI-Index | Spec-Net | Spec-Index | Com-Net | COM-Index | Smalls-Net | Smalls-Index |
|---|---|---|---|---|---|---|---|---|
| WTI Crude | 2,121,461 | 29 | 419,293 | 46 | -461,516 | 44 | 42,223 | 75 |
| Gold | 507,616 | 27 | 215,129 | 62 | -239,877 | 38 | 24,748 | 40 |
| Silver | 141,394 | 8 | 33,115 | 55 | -48,860 | 51 | 15,745 | 32 |
| Copper | 217,216 | 39 | 32,335 | 66 | -41,294 | 31 | 8,959 | 77 |
| Palladium | 10,926 | 20 | -3,391 | 0 | 3,574 | 100 | -183 | 34 |
| Platinum | 56,508 | 16 | 15,364 | 25 | -21,964 | 78 | 6,600 | 54 |
| Natural Gas | 1,267,227 | 35 | -137,713 | 37 | 93,517 | 60 | 44,196 | 91 |
| Brent | 183,766 | 27 | -12,714 | 100 | 7,688 | 0 | 5,026 | 79 |
| Heating Oil | 426,636 | 66 | 22,384 | 75 | -45,844 | 22 | 23,460 | 80 |
| Soybeans | 620,172 | 3 | 58,756 | 45 | -19,885 | 61 | -38,871 | 7 |
| Corn | 1,506,602 | 22 | 383,109 | 79 | -320,385 | 26 | -62,724 | 7 |
| Coffee | 310,931 | 66 | 64,353 | 95 | -69,264 | 6 | 4,911 | 22 |
| Sugar | 884,507 | 21 | 209,061 | 80 | -250,849 | 21 | 41,788 | 60 |
| Wheat | 409,137 | 39 | 17,896 | 62 | -11,141 | 30 | -6,755 | 69 |
CORN Futures:
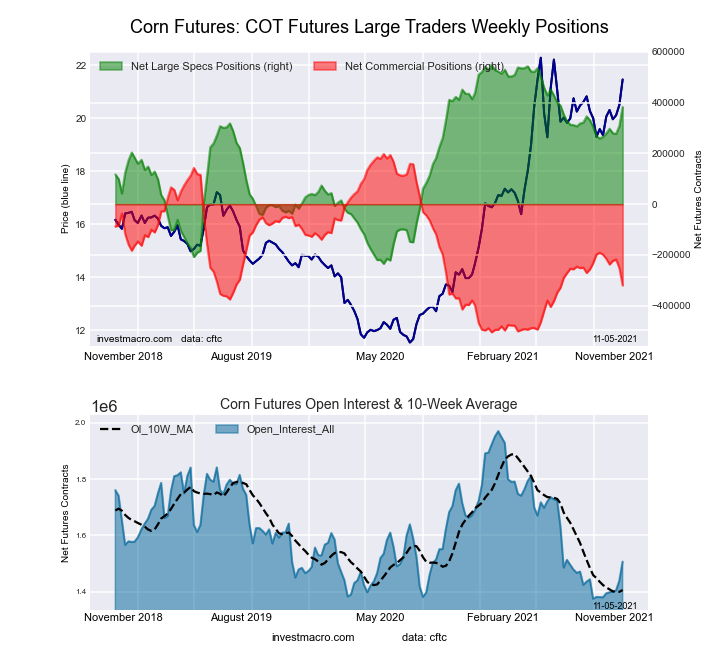 The CORN large speculator standing this week resulted in a net position of 383,109 contracts in the data reported through Tuesday. This was a weekly increase of 75,299 contracts from the previous week which had a total of 307,810 net contracts.
Free Reports:
 Download Our Metatrader 4 Indicators – Put Our Free MetaTrader 4 Custom Indicators on your charts when you join our Weekly Newsletter
 Get our Weekly Commitment of Traders Reports - See where the biggest traders (Hedge Funds and Commercial Hedgers) are positioned in the futures markets on a weekly basis.
This week’s current strength score (the trader positioning range over the past three years, measured from 0 to 100) shows the speculators are currently Bullish with a score of 79.0 percent. The commercials are Bearish with a score of 26.3 percent and the small traders (not shown in chart) are Bearish-Extreme with a score of 7.0 percent.
| CORN Futures Statistics | SPECULATORS | COMMERCIALS | SMALL TRADERS |
| – Percent of Open Interest Longs: | 32.0 | 45.2 | 8.7 |
| – Percent of Open Interest Shorts: | 6.6 | 66.5 | 12.9 |
| – Net Position: | 383,109 | -320,385 | -62,724 |
| – Gross Longs: | 482,734 | 681,554 | 131,645 |
| – Gross Shorts: | 99,625 | 1,001,939 | 194,369 |
| – Long to Short Ratio: | 4.8 to 1 | 0.7 to 1 | 0.7 to 1 |
| NET POSITION TREND: | |||
| – COT Index Score (3 Year Range Pct): | 79.0 | 26.3 | 7.0 |
| – COT Index Reading (3 Year Range): | Bullish | Bearish | Bearish-Extreme |
| NET POSITION MOVEMENT INDEX: | |||
| – 6-Week Change in Strength Index: | 15.0 | -17.3 | 2.2 |
SUGAR Futures:
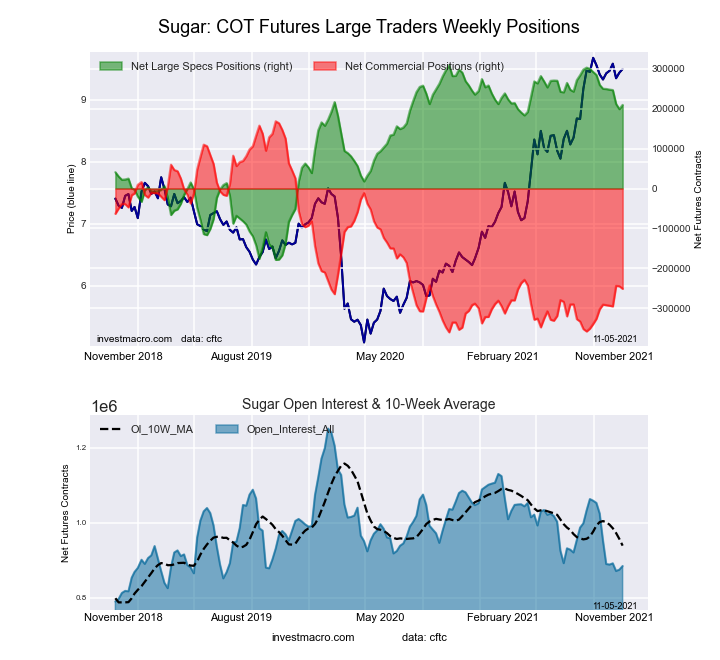 The SUGAR large speculator standing this week resulted in a net position of 209,061 contracts in the data reported through Tuesday. This was a weekly gain of 10,454 contracts from the previous week which had a total of 198,607 net contracts.
This week’s current strength score (the trader positioning range over the past three years, measured from 0 to 100) shows the speculators are currently Bullish with a score of 79.6 percent. The commercials are Bearish with a score of 20.6 percent and the small traders (not shown in chart) are Bullish with a score of 59.5 percent.
| SUGAR Futures Statistics | SPECULATORS | COMMERCIALS | SMALL TRADERS |
| – Percent of Open Interest Longs: | 30.3 | 44.4 | 10.4 |
| – Percent of Open Interest Shorts: | 6.7 | 72.8 | 5.7 |
| – Net Position: | 209,061 | -250,849 | 41,788 |
| – Gross Longs: | 268,307 | 392,717 | 92,164 |
| – Gross Shorts: | 59,246 | 643,566 | 50,376 |
| – Long to Short Ratio: | 4.5 to 1 | 0.6 to 1 | 1.8 to 1 |
| NET POSITION TREND: | |||
| – COT Index Score (3 Year Range Pct): | 79.6 | 20.6 | 59.5 |
| – COT Index Reading (3 Year Range): | Bullish | Bearish | Bullish |
| NET POSITION MOVEMENT INDEX: | |||
| – 6-Week Change in Strength Index: | -8.3 | 7.5 | 1.1 |
COFFEE Futures:
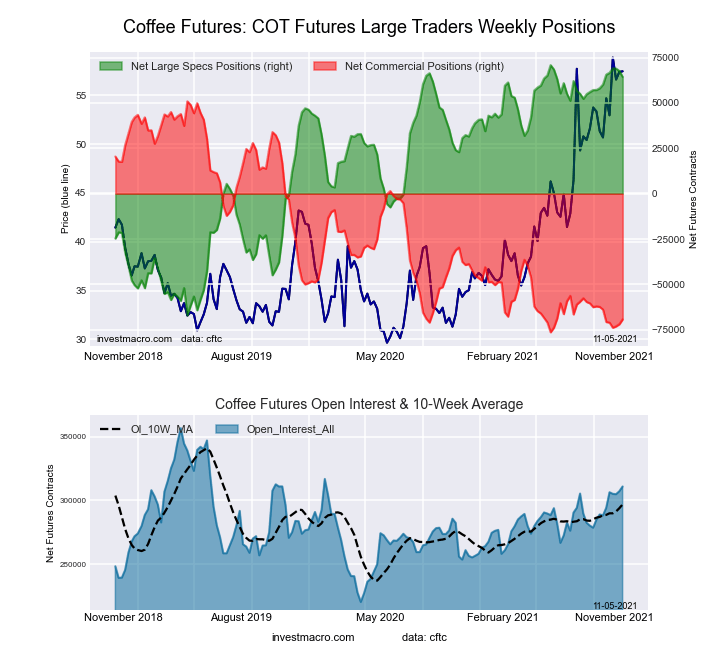 The COFFEE large speculator standing this week resulted in a net position of 64,353 contracts in the data reported through Tuesday. This was a weekly lowering of -3,240 contracts from the previous week which had a total of 67,593 net contracts.
This week’s current strength score (the trader positioning range over the past three years, measured from 0 to 100) shows the speculators are currently Bullish-Extreme with a score of 95.3 percent. The commercials are Bearish-Extreme with a score of 5.5 percent and the small traders (not shown in chart) are Bearish with a score of 22.3 percent.
| COFFEE Futures Statistics | SPECULATORS | COMMERCIALS | SMALL TRADERS |
| – Percent of Open Interest Longs: | 26.8 | 41.6 | 3.8 |
| – Percent of Open Interest Shorts: | 6.2 | 63.9 | 2.2 |
| – Net Position: | 64,353 | -69,264 | 4,911 |
| – Gross Longs: | 83,481 | 129,468 | 11,776 |
| – Gross Shorts: | 19,128 | 198,732 | 6,865 |
| – Long to Short Ratio: | 4.4 to 1 | 0.7 to 1 | 1.7 to 1 |
| NET POSITION TREND: | |||
| – COT Index Score (3 Year Range Pct): | 95.3 | 5.5 | 22.3 |
| – COT Index Reading (3 Year Range): | Bullish-Extreme | Bearish-Extreme | Bearish |
| NET POSITION MOVEMENT INDEX: | |||
| – 6-Week Change in Strength Index: | 3.1 | -4.3 | 8.2 |
SOYBEANS Futures:
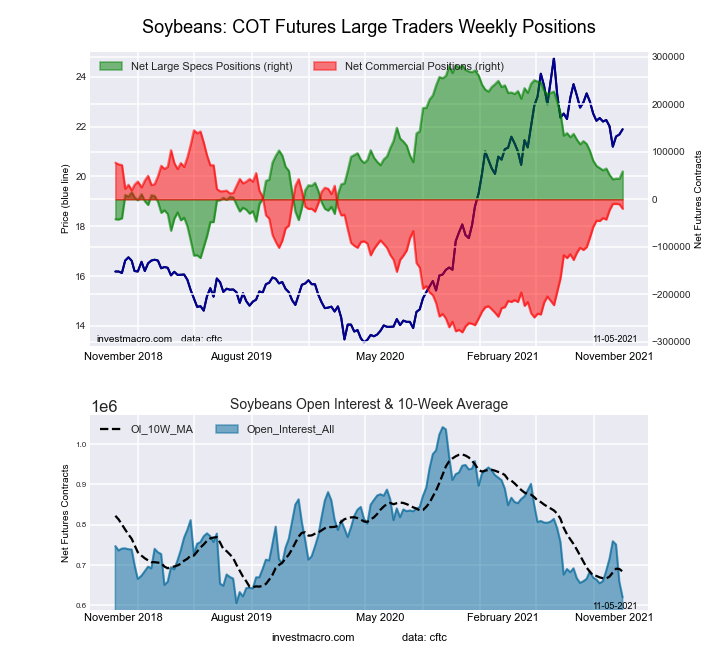 The SOYBEANS large speculator standing this week resulted in a net position of 58,756 contracts in the data reported through Tuesday. This was a weekly advance of 15,526 contracts from the previous week which had a total of 43,230 net contracts.
This week’s current strength score (the trader positioning range over the past three years, measured from 0 to 100) shows the speculators are currently Bearish with a score of 44.9 percent. The commercials are Bullish with a score of 61.1 percent and the small traders (not shown in chart) are Bearish-Extreme with a score of 7.2 percent.
| SOYBEANS Futures Statistics | SPECULATORS | COMMERCIALS | SMALL TRADERS |
| – Percent of Open Interest Longs: | 21.9 | 57.7 | 7.0 |
| – Percent of Open Interest Shorts: | 12.4 | 60.9 | 13.3 |
| – Net Position: | 58,756 | -19,885 | -38,871 |
| – Gross Longs: | 135,938 | 357,948 | 43,540 |
| – Gross Shorts: | 77,182 | 377,833 | 82,411 |
| – Long to Short Ratio: | 1.8 to 1 | 0.9 to 1 | 0.5 to 1 |
| NET POSITION TREND: | |||
| – COT Index Score (3 Year Range Pct): | 44.9 | 61.1 | 7.2 |
| – COT Index Reading (3 Year Range): | Bearish | Bullish | Bearish-Extreme |
| NET POSITION MOVEMENT INDEX: | |||
| – 6-Week Change in Strength Index: | -0.6 | 4.6 | -28.6 |
SOYBEAN OIL Futures:
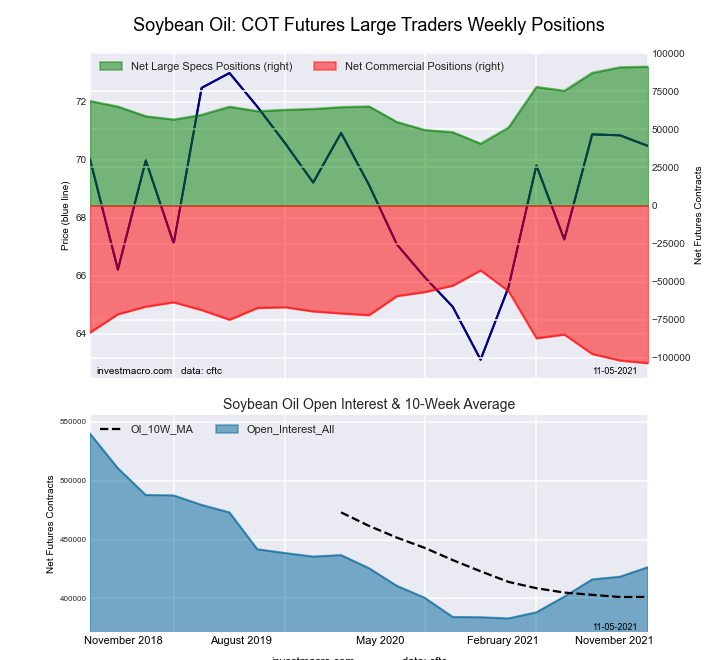 The SOYBEAN OIL large speculator standing this week resulted in a net position of 91,131 contracts in the data reported through Tuesday. This was a weekly increase of 405 contracts from the previous week which had a total of 90,726 net contracts.
This week’s current strength score (the trader positioning range over the past three years, measured from 0 to 100) shows the speculators are currently Bullish with a score of 73.0 percent. The commercials are Bearish with a score of 28.0 percent and the small traders (not shown in chart) are Bullish with a score of 59.9 percent.
| SOYBEAN OIL Futures Statistics | SPECULATORS | COMMERCIALS | SMALL TRADERS |
| – Percent of Open Interest Longs: | 28.7 | 47.1 | 8.0 |
| – Percent of Open Interest Shorts: | 7.3 | 71.4 | 5.1 |
| – Net Position: | 91,131 | -103,585 | 12,454 |
| – Gross Longs: | 122,221 | 200,754 | 34,050 |
| – Gross Shorts: | 31,090 | 304,339 | 21,596 |
| – Long to Short Ratio: | 3.9 to 1 | 0.7 to 1 | 1.6 to 1 |
| NET POSITION TREND: | |||
| – COT Index Score (3 Year Range Pct): | 73.0 | 28.0 | 59.9 |
| – COT Index Reading (3 Year Range): | Bullish | Bearish | Bullish |
| NET POSITION MOVEMENT INDEX: | |||
| – 6-Week Change in Strength Index: | 27.3 | -30.5 | 38.5 |
SOYBEAN MEAL Futures:
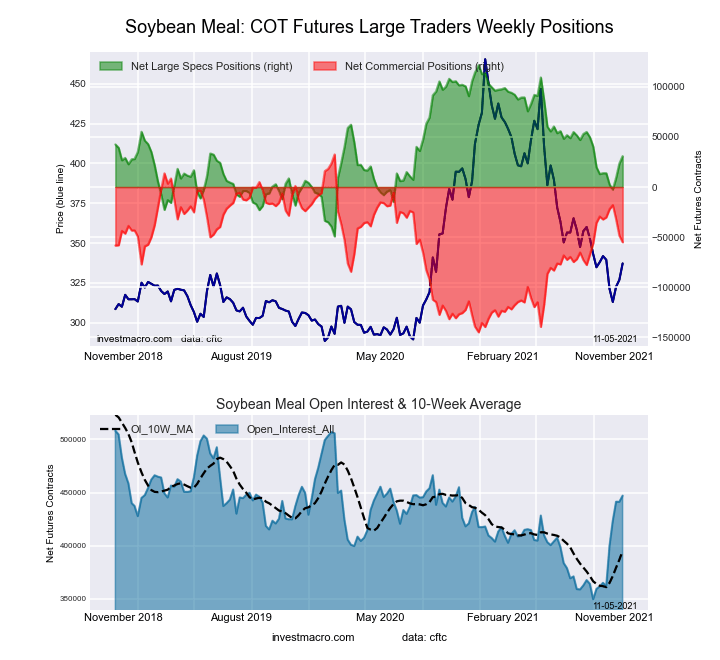 The SOYBEAN MEAL large speculator standing this week resulted in a net position of 30,771 contracts in the data reported through Tuesday. This was a weekly boost of 7,352 contracts from the previous week which had a total of 23,419 net contracts.
This week’s current strength score (the trader positioning range over the past three years, measured from 0 to 100) shows the speculators are currently Bearish with a score of 46.8 percent. The commercials are Bullish with a score of 50.7 percent and the small traders (not shown in chart) are Bullish with a score of 68.1 percent.
| SOYBEAN MEAL Futures Statistics | SPECULATORS | COMMERCIALS | SMALL TRADERS |
| – Percent of Open Interest Longs: | 21.5 | 46.4 | 12.3 |
| – Percent of Open Interest Shorts: | 14.6 | 58.7 | 6.9 |
| – Net Position: | 30,771 | -55,091 | 24,320 |
| – Gross Longs: | 96,255 | 207,316 | 55,086 |
| – Gross Shorts: | 65,484 | 262,407 | 30,766 |
| – Long to Short Ratio: | 1.5 to 1 | 0.8 to 1 | 1.8 to 1 |
| NET POSITION TREND: | |||
| – COT Index Score (3 Year Range Pct): | 46.8 | 50.7 | 68.1 |
| – COT Index Reading (3 Year Range): | Bearish | Bullish | Bullish |
| NET POSITION MOVEMENT INDEX: | |||
| – 6-Week Change in Strength Index: | 9.9 | -12.8 | 23.1 |
LIVE CATTLE Futures:
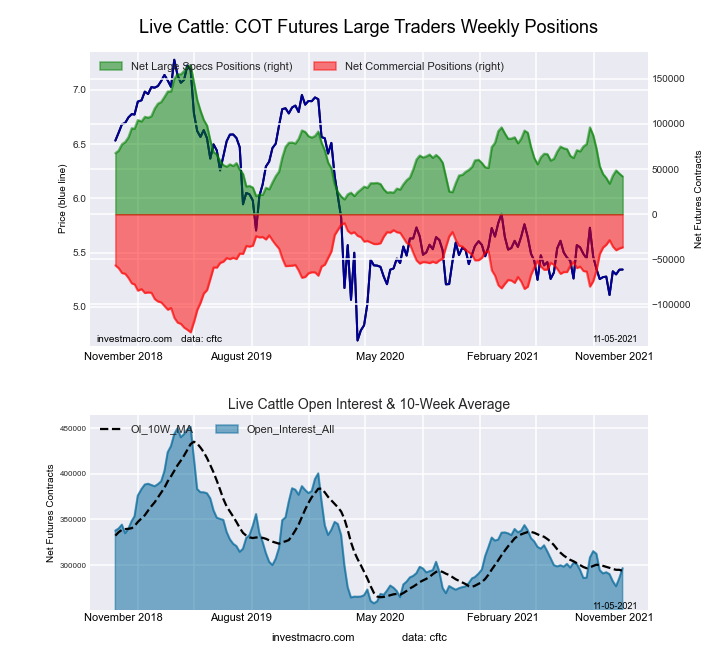 The LIVE CATTLE large speculator standing this week resulted in a net position of 41,894 contracts in the data reported through Tuesday. This was a weekly fall of -3,084 contracts from the previous week which had a total of 44,978 net contracts.
This week’s current strength score (the trader positioning range over the past three years, measured from 0 to 100) shows the speculators are currently Bearish-Extreme with a score of 17.1 percent. The commercials are Bullish with a score of 77.7 percent and the small traders (not shown in chart) are Bullish with a score of 74.5 percent.
| LIVE CATTLE Futures Statistics | SPECULATORS | COMMERCIALS | SMALL TRADERS |
| – Percent of Open Interest Longs: | 31.4 | 40.0 | 10.1 |
| – Percent of Open Interest Shorts: | 17.3 | 52.3 | 11.8 |
| – Net Position: | 41,894 | -36,717 | -5,177 |
| – Gross Longs: | 93,191 | 118,526 | 29,946 |
| – Gross Shorts: | 51,297 | 155,243 | 35,123 |
| – Long to Short Ratio: | 1.8 to 1 | 0.8 to 1 | 0.9 to 1 |
| NET POSITION TREND: | |||
| – COT Index Score (3 Year Range Pct): | 17.1 | 77.7 | 74.5 |
| – COT Index Reading (3 Year Range): | Bearish-Extreme | Bullish | Bullish |
| NET POSITION MOVEMENT INDEX: | |||
| – 6-Week Change in Strength Index: | -1.8 | 0.2 | 6.0 |
LEAN HOGS Futures:
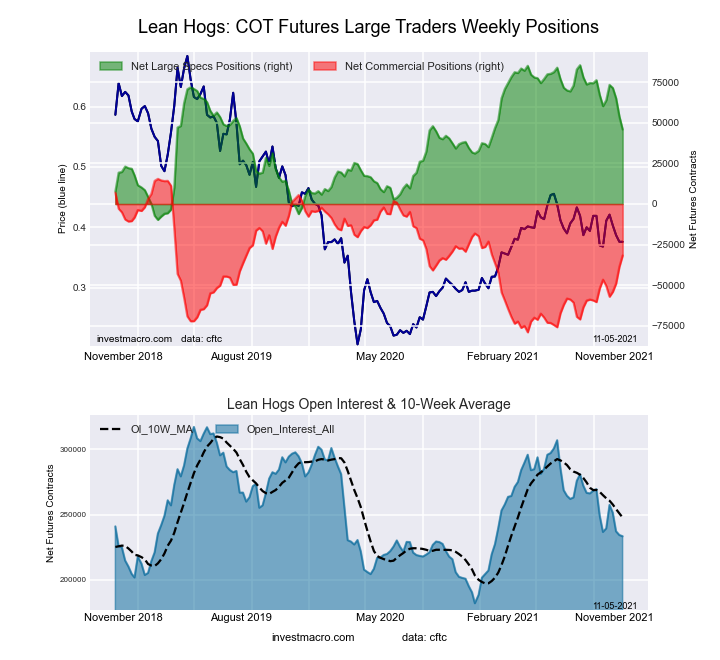 The LEAN HOGS large speculator standing this week resulted in a net position of 45,965 contracts in the data reported through Tuesday. This was a weekly fall of -8,092 contracts from the previous week which had a total of 54,057 net contracts.
This week’s current strength score (the trader positioning range over the past three years, measured from 0 to 100) shows the speculators are currently Bullish with a score of 58.4 percent. The commercials are Bullish with a score of 50.0 percent and the small traders (not shown in chart) are Bearish-Extreme with a score of 14.5 percent.
| LEAN HOGS Futures Statistics | SPECULATORS | COMMERCIALS | SMALL TRADERS |
| – Percent of Open Interest Longs: | 37.7 | 33.7 | 7.9 |
| – Percent of Open Interest Shorts: | 18.0 | 47.3 | 14.0 |
| – Net Position: | 45,965 | -31,775 | -14,190 |
| – Gross Longs: | 87,929 | 78,627 | 18,449 |
| – Gross Shorts: | 41,964 | 110,402 | 32,639 |
| – Long to Short Ratio: | 2.1 to 1 | 0.7 to 1 | 0.6 to 1 |
| NET POSITION TREND: | |||
| – COT Index Score (3 Year Range Pct): | 58.4 | 50.0 | 14.5 |
| – COT Index Reading (3 Year Range): | Bullish | Bullish | Bearish-Extreme |
| NET POSITION MOVEMENT INDEX: | |||
| – 6-Week Change in Strength Index: | -15.1 | 15.7 | -2.2 |
COTTON Futures:
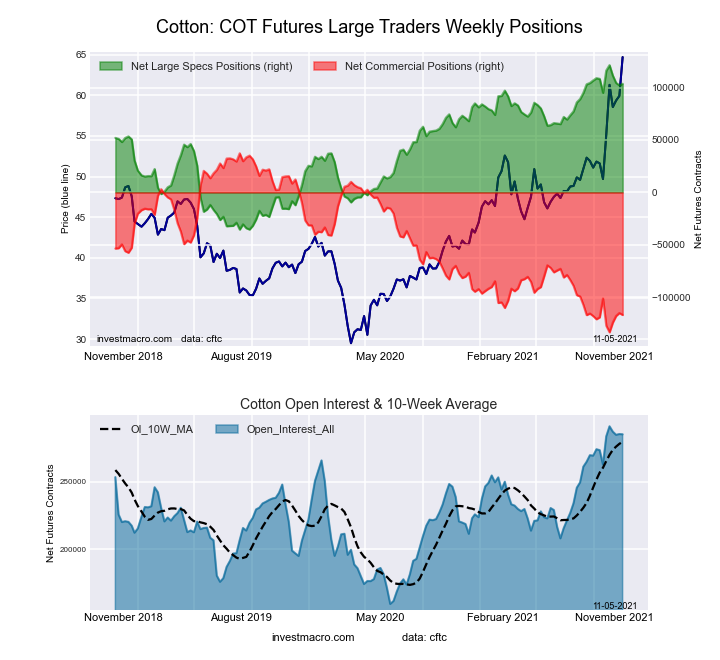 The COTTON large speculator standing this week resulted in a net position of 103,553 contracts in the data reported through Tuesday. This was a weekly boost of 1,484 contracts from the previous week which had a total of 102,069 net contracts.
This week’s current strength score (the trader positioning range over the past three years, measured from 0 to 100) shows the speculators are currently Bullish-Extreme with a score of 88.7 percent. The commercials are Bearish-Extreme with a score of 9.7 percent and the small traders (not shown in chart) are Bullish-Extreme with a score of 96.3 percent.
| COTTON Futures Statistics | SPECULATORS | COMMERCIALS | SMALL TRADERS |
| – Percent of Open Interest Longs: | 40.3 | 37.1 | 7.7 |
| – Percent of Open Interest Shorts: | 3.9 | 78.1 | 3.1 |
| – Net Position: | 103,553 | -116,804 | 13,251 |
| – Gross Longs: | 114,770 | 105,723 | 22,064 |
| – Gross Shorts: | 11,217 | 222,527 | 8,813 |
| – Long to Short Ratio: | 10.2 to 1 | 0.5 to 1 | 2.5 to 1 |
| NET POSITION TREND: | |||
| – COT Index Score (3 Year Range Pct): | 88.7 | 9.7 | 96.3 |
| – COT Index Reading (3 Year Range): | Bullish-Extreme | Bearish-Extreme | Bullish-Extreme |
| NET POSITION MOVEMENT INDEX: | |||
| – 6-Week Change in Strength Index: | 5.4 | -9.2 | 44.3 |
COCOA Futures:
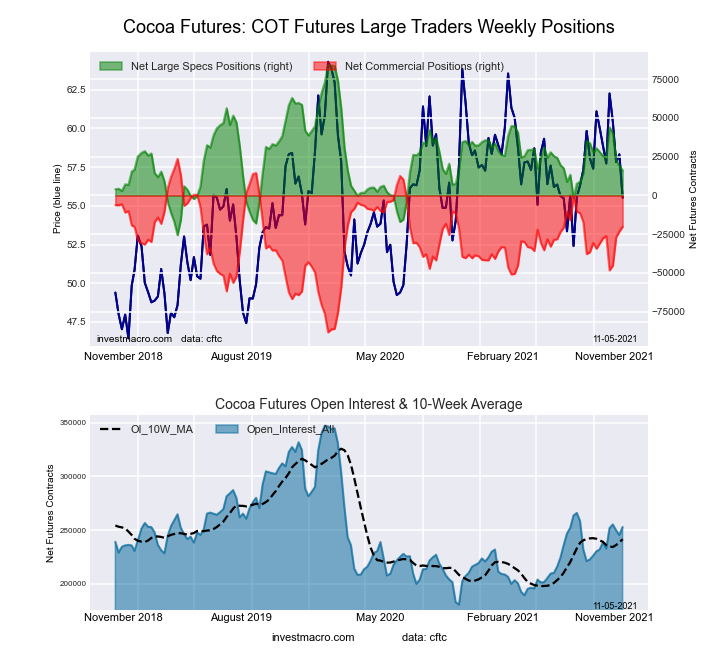 The COCOA large speculator standing this week resulted in a net position of 16,074 contracts in the data reported through Tuesday. This was a weekly fall of -3,124 contracts from the previous week which had a total of 19,198 net contracts.
This week’s current strength score (the trader positioning range over the past three years, measured from 0 to 100) shows the speculators are currently Bearish with a score of 38.0 percent. The commercials are Bullish with a score of 60.9 percent and the small traders (not shown in chart) are Bullish with a score of 54.6 percent.
| COCOA Futures Statistics | SPECULATORS | COMMERCIALS | SMALL TRADERS |
| – Percent of Open Interest Longs: | 24.4 | 52.8 | 4.7 |
| – Percent of Open Interest Shorts: | 18.0 | 60.7 | 3.1 |
| – Net Position: | 16,074 | -20,130 | 4,056 |
| – Gross Longs: | 61,609 | 133,483 | 11,792 |
| – Gross Shorts: | 45,535 | 153,613 | 7,736 |
| – Long to Short Ratio: | 1.4 to 1 | 0.9 to 1 | 1.5 to 1 |
| NET POSITION TREND: | |||
| – COT Index Score (3 Year Range Pct): | 38.0 | 60.9 | 54.6 |
| – COT Index Reading (3 Year Range): | Bearish | Bullish | Bullish |
| NET POSITION MOVEMENT INDEX: | |||
| – 6-Week Change in Strength Index: | -8.5 | 6.7 | 21.3 |
WHEAT Futures:
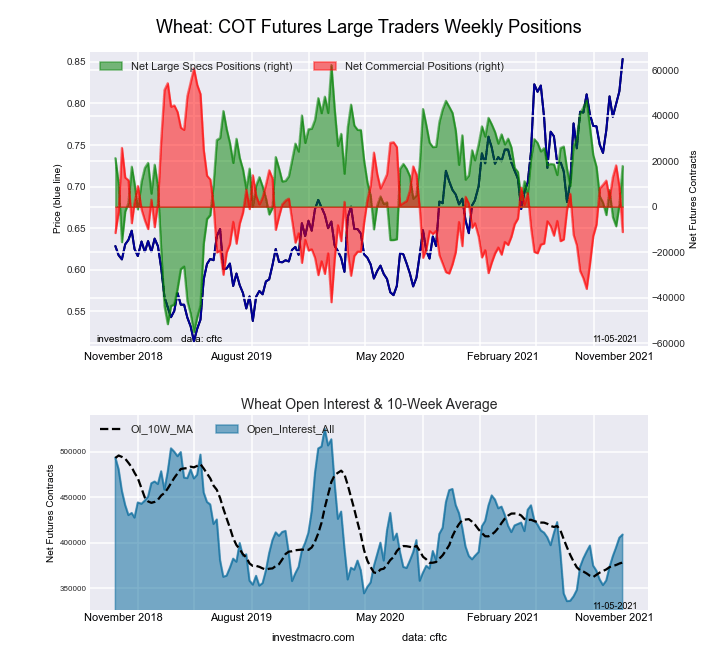 The WHEAT large speculator standing this week resulted in a net position of 17,896 contracts in the data reported through Tuesday. This was a weekly lift of 17,133 contracts from the previous week which had a total of 763 net contracts.
This week’s current strength score (the trader positioning range over the past three years, measured from 0 to 100) shows the speculators are currently Bullish with a score of 62.3 percent. The commercials are Bearish with a score of 30.0 percent and the small traders (not shown in chart) are Bullish with a score of 69.3 percent.
| WHEAT Futures Statistics | SPECULATORS | COMMERCIALS | SMALL TRADERS |
| – Percent of Open Interest Longs: | 26.8 | 34.7 | 8.9 |
| – Percent of Open Interest Shorts: | 22.5 | 37.4 | 10.5 |
| – Net Position: | 17,896 | -11,141 | -6,755 |
| – Gross Longs: | 109,768 | 141,984 | 36,283 |
| – Gross Shorts: | 91,872 | 153,125 | 43,038 |
| – Long to Short Ratio: | 1.2 to 1 | 0.9 to 1 | 0.8 to 1 |
| NET POSITION TREND: | |||
| – COT Index Score (3 Year Range Pct): | 62.3 | 30.0 | 69.3 |
| – COT Index Reading (3 Year Range): | Bullish | Bearish | Bullish |
| NET POSITION MOVEMENT INDEX: | |||
| – 6-Week Change in Strength Index: | 13.7 | -20.2 | 22.6 |
Article By InvestMacro – Receive our weekly COT Reports by Email
*COT Report: The COT data, released weekly to the public each Friday, is updated through the most recent Tuesday (data is 3 days old) and shows a quick view of how large speculators or non-commercials (for-profit traders) were positioned in the futures markets.
The CFTC categorizes trader positions according to commercial hedgers (traders who use futures contracts for hedging as part of the business), non-commercials (large traders who speculate to realize trading profits) and nonreportable traders (usually small traders/speculators) as well as their open interest (contracts open in the market at time of reporting).See CFTC criteria here.

- COT Metals Charts: Weekly Speculator Bets led by Copper & Steel Jul 18, 2026
- COT Bonds Charts: Weekly Speculator Bets led by 2-Year, SOFR 3M & 5-Year Bonds Jul 18, 2026
- COT Energy Charts: Weekly Speculator Bets led by Brent Oil & Heating Oil Jul 18, 2026
- COT Soft Commodities Charts: Weekly Speculator Bets led by Wheat, Corn & Soybean Meal Jul 18, 2026
- The Bank of Canada kept its interest rate unchanged. Platinum prices reached a three‑week high Jul 16, 2026
- Stock indices rose after the release of US inflation data. China’s GDP slowed sharply Jul 15, 2026
- GBP/USD Awaits Political News: What Will Happen Next Jul 15, 2026
- USD/JPY Holds at Highs: Pressure Lingers on Yen Jul 14, 2026
- Oil prices jumped 4% amid a new wave of escalation between the US and Iran Jul 13, 2026
- EUR/USD: US Inflation Will Determine Everything Jul 13, 2026