
By InvestMacro.com COT Home | Data Tables | Data Downloads | Newsletter
Here are the latest charts and statistics for the Commitment of Traders (COT) data published by the Commodities Futures Trading Commission (CFTC).
The latest COT data is updated through Tuesday October 26th 2021 and shows a quick view of how large traders (for-profit speculators and commercial entities) were positioned in the futures markets.
Highlighting this week’s COT Soft Commodity’s data is the speculator’s sharp increase in bullish bets for Corn. Corn bets jumped by over +30,000 contracts this week which marked the largest one-week gain in the past forty-three weeks. The rise brought the overall net position back above the +300,000 net contract level for the first time since August 31st. Overall, Corn speculative positions have remained in bullish territory for sixty-one weeks after turning from bearish to bullish back in August of 2020.
| Oct-26-2021 | OI | OI-Index | Spec-Net | Spec-Index | Com-Net | COM-Index | Smalls-Net | Smalls-Index |
|---|---|---|---|---|---|---|---|---|
| WTI Crude | 2,144,359 | 33 | 423,718 | 47 | -472,412 | 41 | 48,694 | 84 |
| Gold | 509,794 | 28 | 214,560 | 62 | -239,654 | 38 | 25,094 | 41 |
| Silver | 141,581 | 8 | 37,532 | 60 | -51,504 | 48 | 13,972 | 21 |
| Copper | 222,927 | 43 | 37,279 | 69 | -45,870 | 28 | 8,591 | 75 |
| Palladium | 10,205 | 17 | -2,954 | 2 | 2,962 | 97 | -8 | 44 |
| Platinum | 58,161 | 19 | 14,902 | 24 | -21,280 | 79 | 6,378 | 51 |
| Natural Gas | 1,295,271 | 42 | -138,188 | 37 | 96,361 | 61 | 41,827 | 85 |
| Brent | 200,768 | 40 | -17,810 | 98 | 12,648 | 1 | 5,162 | 81 |
| Heating Oil | 423,143 | 63 | 25,791 | 80 | -49,635 | 18 | 23,844 | 81 |
| Soybeans | 658,960 | 12 | 43,230 | 41 | -10,177 | 63 | -33,053 | 17 |
| Corn | 1,438,930 | 11 | 307,810 | 69 | -252,059 | 36 | -55,751 | 11 |
| Coffee | 307,195 | 64 | 67,593 | 98 | -71,916 | 3 | 4,323 | 18 |
| Sugar | 874,742 | 21 | 198,607 | 77 | -244,341 | 22 | 45,734 | 64 |
| Wheat | 405,625 | 33 | 763 | 48 | 8,753 | 49 | -9,516 | 56 |
CORN Futures:
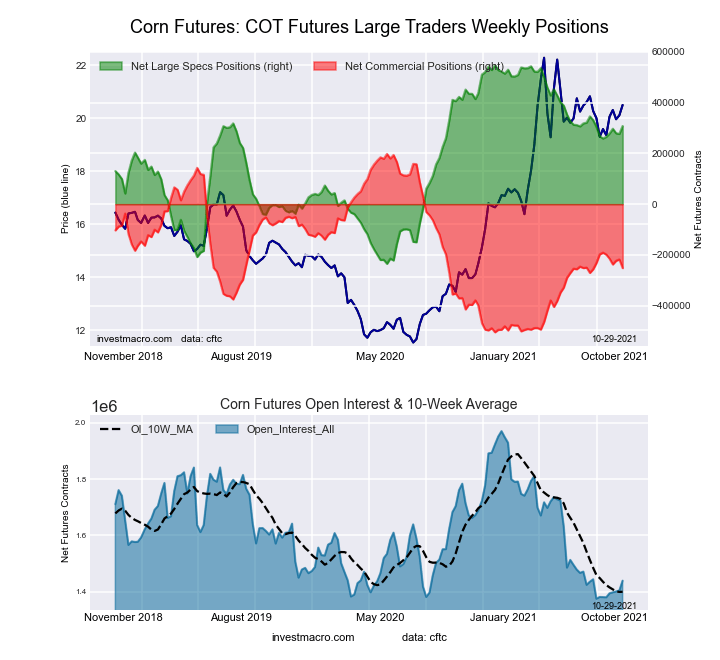 The CORN large speculator standing this week totaled a net position of 307,810 contracts in the data reported through Tuesday. This was a weekly rise of 30,781 contracts from the previous week which had a total of 277,029 net contracts.
Free Reports:
 Download Our Metatrader 4 Indicators – Put Our Free MetaTrader 4 Custom Indicators on your charts when you join our Weekly Newsletter
 Get our Weekly Commitment of Traders Reports - See where the biggest traders (Hedge Funds and Commercial Hedgers) are positioned in the futures markets on a weekly basis.
This week’s current strength score (the trader positioning range over the past three years, measured from 0 to 100) shows the speculators are currently Bullish with a score of 69.4 percent. The commercials are Bearish with a score of 36.0 percent and the small traders (not shown in chart) are Bearish-Extreme with a score of 11.0 percent.
| CORN Futures Statistics | SPECULATORS | COMMERCIALS | SMALL TRADERS |
| – Percent of Open Interest Longs: | 28.1 | 48.5 | 9.2 |
| – Percent of Open Interest Shorts: | 6.7 | 66.1 | 13.1 |
| – Net Position: | 307,810 | -252,059 | -55,751 |
| – Gross Longs: | 404,890 | 698,417 | 132,371 |
| – Gross Shorts: | 97,080 | 950,476 | 188,122 |
| – Long to Short Ratio: | 4.2 to 1 | 0.7 to 1 | 0.7 to 1 |
| NET POSITION TREND: | |||
| – COT Index Score (3 Year Range Pct): | 69.4 | 36.0 | 11.0 |
| – COT Index Reading (3 Year Range): | Bullish | Bearish | Bearish-Extreme |
| NET POSITION MOVEMENT INDEX: | |||
| – 6-Week Change in Strength Index: | 6.3 | -8.6 | 6.6 |
SUGAR Futures:
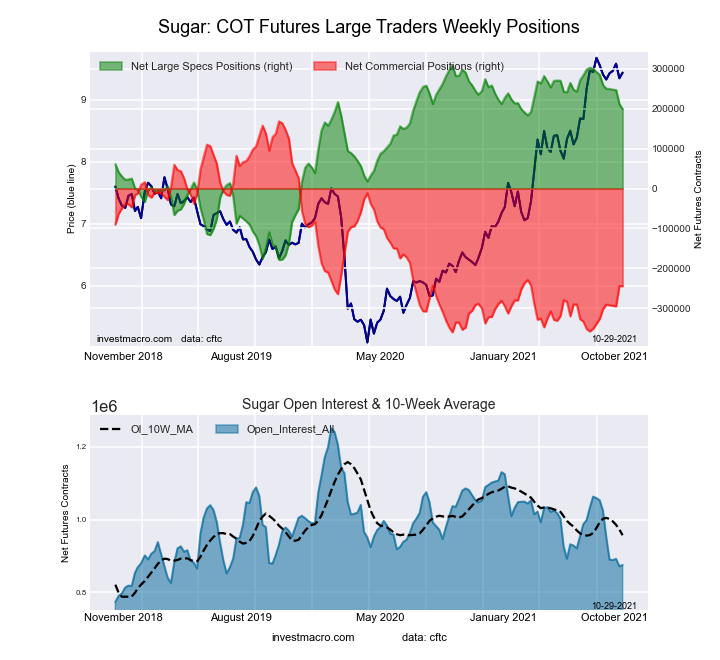 The SUGAR large speculator standing this week totaled a net position of 198,607 contracts in the data reported through Tuesday. This was a weekly fall of -12,943 contracts from the previous week which had a total of 211,550 net contracts.
This week’s current strength score (the trader positioning range over the past three years, measured from 0 to 100) shows the speculators are currently Bullish with a score of 77.4 percent. The commercials are Bearish with a score of 21.8 percent and the small traders (not shown in chart) are Bullish with a score of 64.4 percent.
| SUGAR Futures Statistics | SPECULATORS | COMMERCIALS | SMALL TRADERS |
| – Percent of Open Interest Longs: | 29.6 | 44.9 | 10.9 |
| – Percent of Open Interest Shorts: | 6.9 | 72.8 | 5.6 |
| – Net Position: | 198,607 | -244,341 | 45,734 |
| – Gross Longs: | 258,776 | 392,733 | 94,957 |
| – Gross Shorts: | 60,169 | 637,074 | 49,223 |
| – Long to Short Ratio: | 4.3 to 1 | 0.6 to 1 | 1.9 to 1 |
| NET POSITION TREND: | |||
| – COT Index Score (3 Year Range Pct): | 77.4 | 21.8 | 64.4 |
| – COT Index Reading (3 Year Range): | Bullish | Bearish | Bullish |
| NET POSITION MOVEMENT INDEX: | |||
| – 6-Week Change in Strength Index: | -12.4 | 10.9 | 3.6 |
COFFEE Futures:
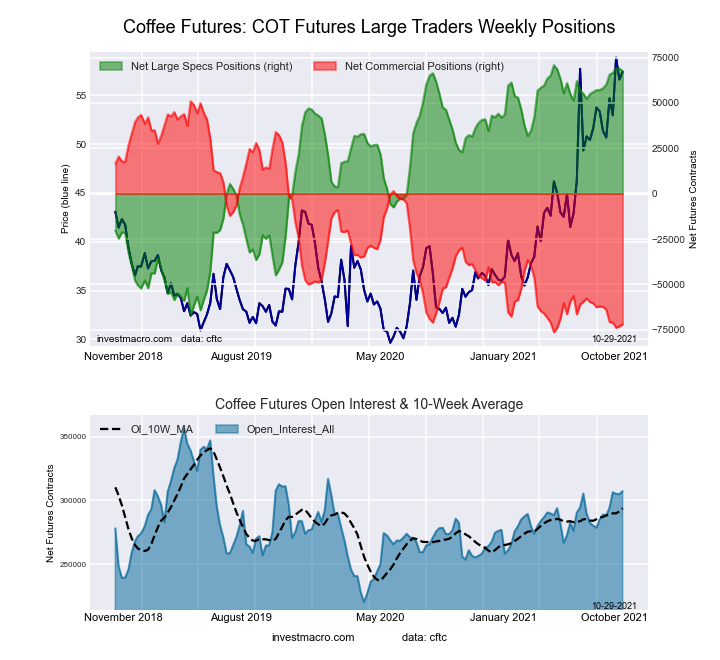 The COFFEE large speculator standing this week totaled a net position of 67,593 contracts in the data reported through Tuesday. This was a weekly fall of -1,296 contracts from the previous week which had a total of 68,889 net contracts.
This week’s current strength score (the trader positioning range over the past three years, measured from 0 to 100) shows the speculators are currently Bullish-Extreme with a score of 97.7 percent. The commercials are Bearish-Extreme with a score of 3.5 percent and the small traders (not shown in chart) are Bearish-Extreme with a score of 18.2 percent.
| COFFEE Futures Statistics | SPECULATORS | COMMERCIALS | SMALL TRADERS |
| – Percent of Open Interest Longs: | 27.6 | 40.9 | 3.6 |
| – Percent of Open Interest Shorts: | 5.6 | 64.3 | 2.2 |
| – Net Position: | 67,593 | -71,916 | 4,323 |
| – Gross Longs: | 84,760 | 125,632 | 11,211 |
| – Gross Shorts: | 17,167 | 197,548 | 6,888 |
| – Long to Short Ratio: | 4.9 to 1 | 0.6 to 1 | 1.6 to 1 |
| NET POSITION TREND: | |||
| – COT Index Score (3 Year Range Pct): | 97.7 | 3.5 | 18.2 |
| – COT Index Reading (3 Year Range): | Bullish-Extreme | Bearish-Extreme | Bearish-Extreme |
| NET POSITION MOVEMENT INDEX: | |||
| – 6-Week Change in Strength Index: | 6.9 | -7.5 | 0.3 |
SOYBEANS Futures:
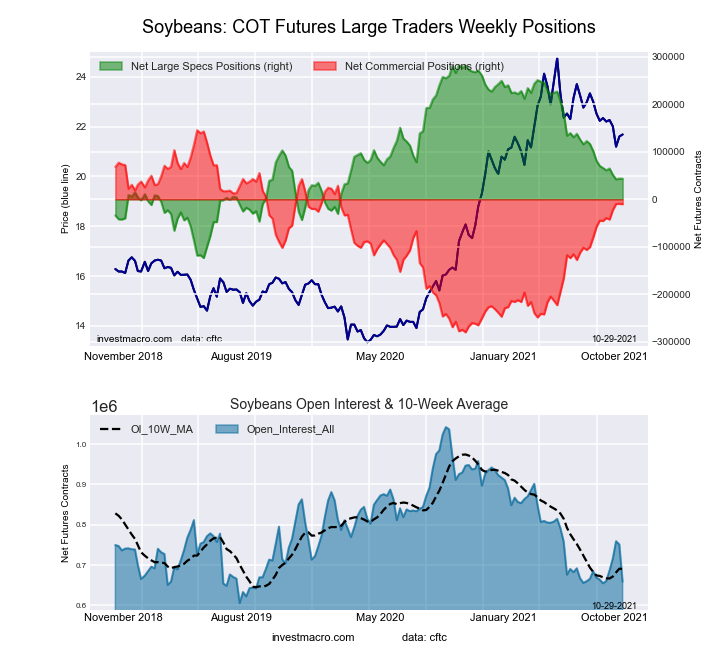 The SOYBEANS large speculator standing this week totaled a net position of 43,230 contracts in the data reported through Tuesday. This was a weekly reduction of -311 contracts from the previous week which had a total of 43,541 net contracts.
This week’s current strength score (the trader positioning range over the past three years, measured from 0 to 100) shows the speculators are currently Bearish with a score of 41.1 percent. The commercials are Bullish with a score of 63.4 percent and the small traders (not shown in chart) are Bearish-Extreme with a score of 16.8 percent.
| SOYBEANS Futures Statistics | SPECULATORS | COMMERCIALS | SMALL TRADERS |
| – Percent of Open Interest Longs: | 19.1 | 57.3 | 8.0 |
| – Percent of Open Interest Shorts: | 12.6 | 58.9 | 13.1 |
| – Net Position: | 43,230 | -10,177 | -33,053 |
| – Gross Longs: | 126,049 | 377,732 | 53,042 |
| – Gross Shorts: | 82,819 | 387,909 | 86,095 |
| – Long to Short Ratio: | 1.5 to 1 | 1.0 to 1 | 0.6 to 1 |
| NET POSITION TREND: | |||
| – COT Index Score (3 Year Range Pct): | 41.1 | 63.4 | 16.8 |
| – COT Index Reading (3 Year Range): | Bearish | Bullish | Bearish-Extreme |
| NET POSITION MOVEMENT INDEX: | |||
| – 6-Week Change in Strength Index: | -5.6 | 8.3 | -21.4 |
SOYBEAN MEAL Futures:
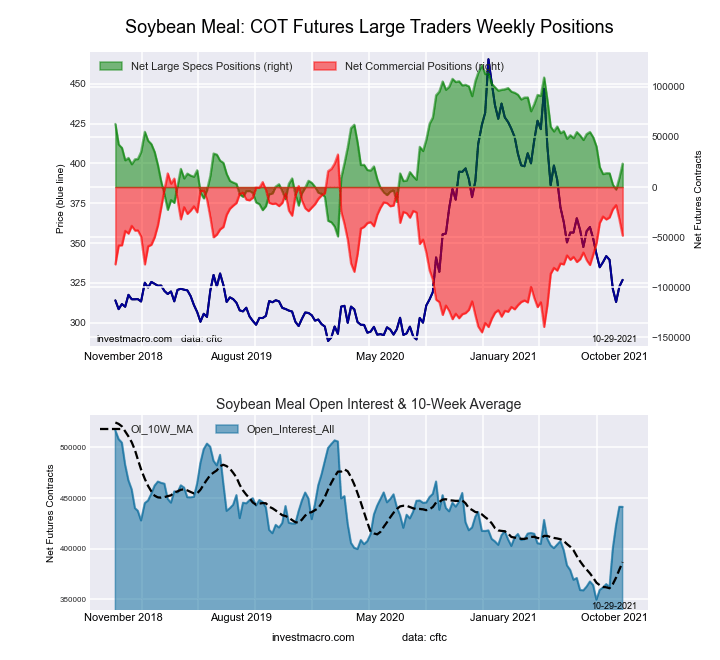 The SOYBEAN MEAL large speculator standing this week totaled a net position of 23,419 contracts in the data reported through Tuesday. This was a weekly boost of 14,305 contracts from the previous week which had a total of 9,114 net contracts.
This week’s current strength score (the trader positioning range over the past three years, measured from 0 to 100) shows the speculators are currently Bearish with a score of 42.5 percent. The commercials are Bullish with a score of 54.4 percent and the small traders (not shown in chart) are Bullish with a score of 71.2 percent.
| SOYBEAN MEAL Futures Statistics | SPECULATORS | COMMERCIALS | SMALL TRADERS |
| – Percent of Open Interest Longs: | 20.4 | 47.7 | 12.6 |
| – Percent of Open Interest Shorts: | 15.1 | 58.7 | 6.9 |
| – Net Position: | 23,419 | -48,521 | 25,102 |
| – Gross Longs: | 90,211 | 210,364 | 55,643 |
| – Gross Shorts: | 66,792 | 258,885 | 30,541 |
| – Long to Short Ratio: | 1.4 to 1 | 0.8 to 1 | 1.8 to 1 |
| NET POSITION TREND: | |||
| – COT Index Score (3 Year Range Pct): | 42.5 | 54.4 | 71.2 |
| – COT Index Reading (3 Year Range): | Bearish | Bullish | Bullish |
| NET POSITION MOVEMENT INDEX: | |||
| – 6-Week Change in Strength Index: | 6.1 | -10.7 | 34.5 |
LIVE CATTLE Futures:
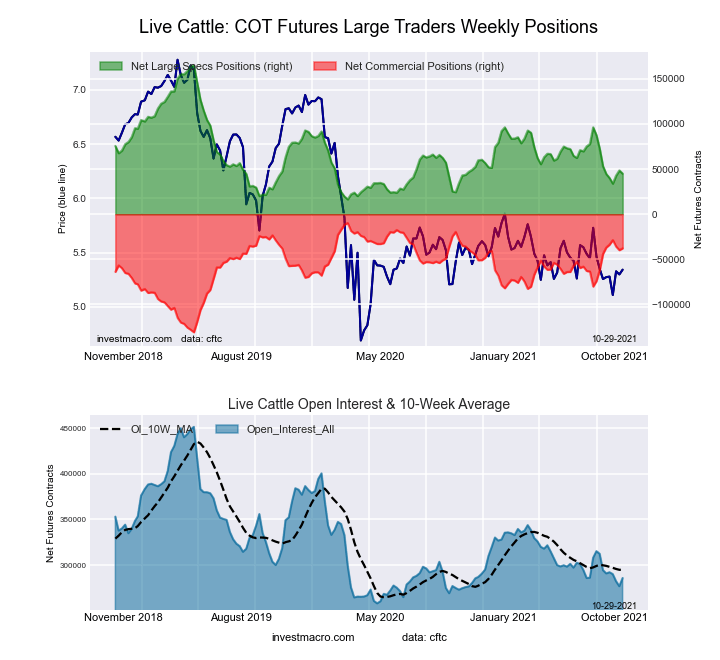 The LIVE CATTLE large speculator standing this week totaled a net position of 44,978 contracts in the data reported through Tuesday. This was a weekly fall of -3,513 contracts from the previous week which had a total of 48,491 net contracts.
This week’s current strength score (the trader positioning range over the past three years, measured from 0 to 100) shows the speculators are currently Bearish-Extreme with a score of 19.2 percent. The commercials are Bullish with a score of 76.8 percent and the small traders (not shown in chart) are Bullish with a score of 69.9 percent.
| LIVE CATTLE Futures Statistics | SPECULATORS | COMMERCIALS | SMALL TRADERS |
| – Percent of Open Interest Longs: | 32.6 | 41.7 | 10.4 |
| – Percent of Open Interest Shorts: | 16.8 | 54.9 | 12.9 |
| – Net Position: | 44,978 | -37,895 | -7,083 |
| – Gross Longs: | 93,043 | 119,063 | 29,714 |
| – Gross Shorts: | 48,065 | 156,958 | 36,797 |
| – Long to Short Ratio: | 1.9 to 1 | 0.8 to 1 | 0.8 to 1 |
| NET POSITION TREND: | |||
| – COT Index Score (3 Year Range Pct): | 19.2 | 76.8 | 69.9 |
| – COT Index Reading (3 Year Range): | Bearish-Extreme | Bullish | Bullish |
| NET POSITION MOVEMENT INDEX: | |||
| – 6-Week Change in Strength Index: | -5.5 | 5.1 | 5.0 |
LEAN HOGS Futures:
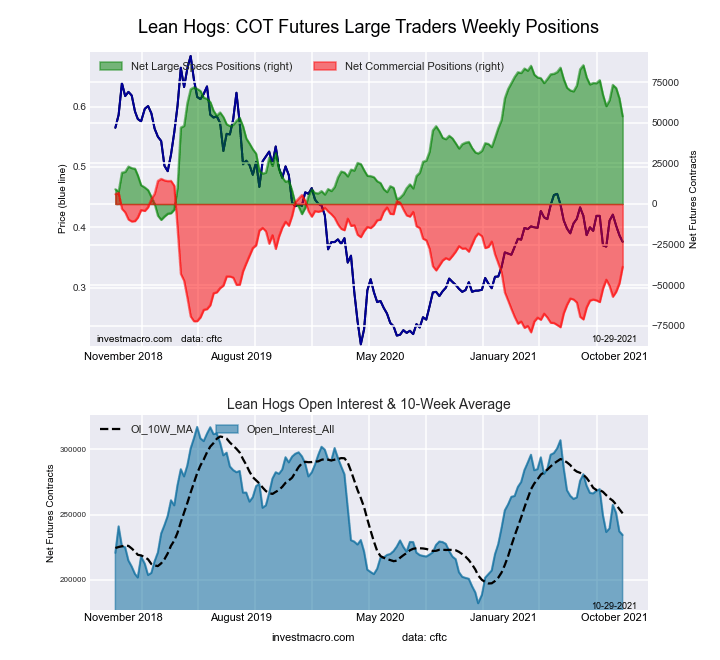 The LEAN HOGS large speculator standing this week totaled a net position of 54,057 contracts in the data reported through Tuesday. This was a weekly decline of -11,125 contracts from the previous week which had a total of 65,182 net contracts.
This week’s current strength score (the trader positioning range over the past three years, measured from 0 to 100) shows the speculators are currently Bullish with a score of 66.9 percent. The commercials are Bearish with a score of 42.6 percent and the small traders (not shown in chart) are Bearish-Extreme with a score of 9.5 percent.
| LEAN HOGS Futures Statistics | SPECULATORS | COMMERCIALS | SMALL TRADERS |
| – Percent of Open Interest Longs: | 39.8 | 32.7 | 7.5 |
| – Percent of Open Interest Shorts: | 16.8 | 49.2 | 14.0 |
| – Net Position: | 54,057 | -38,763 | -15,294 |
| – Gross Longs: | 93,406 | 76,620 | 17,605 |
| – Gross Shorts: | 39,349 | 115,383 | 32,899 |
| – Long to Short Ratio: | 2.4 to 1 | 0.7 to 1 | 0.5 to 1 |
| NET POSITION TREND: | |||
| – COT Index Score (3 Year Range Pct): | 66.9 | 42.6 | 9.5 |
| – COT Index Reading (3 Year Range): | Bullish | Bearish | Bearish-Extreme |
| NET POSITION MOVEMENT INDEX: | |||
| – 6-Week Change in Strength Index: | -13.8 | 14.1 | -0.6 |
COTTON Futures:
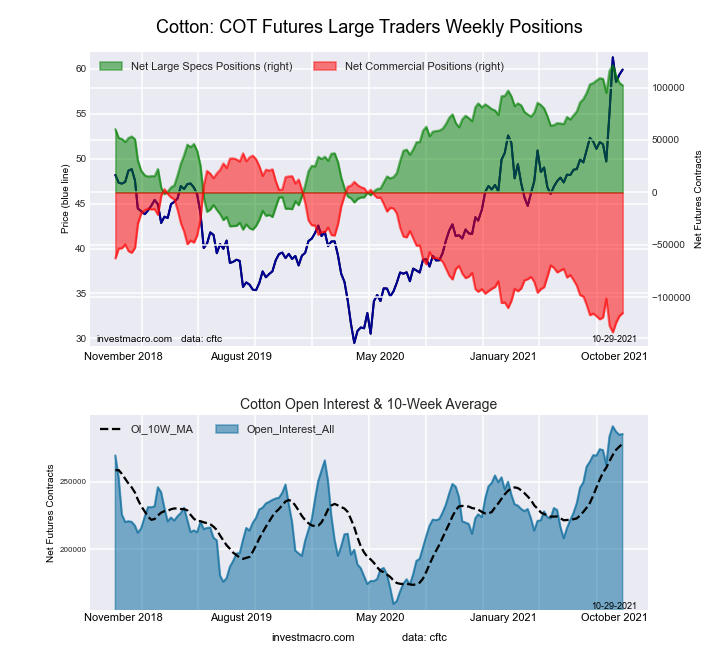 The COTTON large speculator standing this week totaled a net position of 102,069 contracts in the data reported through Tuesday. This was a weekly decline of -2,354 contracts from the previous week which had a total of 104,423 net contracts.
This week’s current strength score (the trader positioning range over the past three years, measured from 0 to 100) shows the speculators are currently Bullish-Extreme with a score of 87.7 percent. The commercials are Bearish-Extreme with a score of 10.7 percent and the small traders (not shown in chart) are Bullish-Extreme with a score of 94.1 percent.
| COTTON Futures Statistics | SPECULATORS | COMMERCIALS | SMALL TRADERS |
| – Percent of Open Interest Longs: | 39.7 | 38.2 | 7.9 |
| – Percent of Open Interest Shorts: | 3.9 | 78.5 | 3.4 |
| – Net Position: | 102,069 | -114,970 | 12,901 |
| – Gross Longs: | 113,246 | 108,979 | 22,564 |
| – Gross Shorts: | 11,177 | 223,949 | 9,663 |
| – Long to Short Ratio: | 10.1 to 1 | 0.5 to 1 | 2.3 to 1 |
| NET POSITION TREND: | |||
| – COT Index Score (3 Year Range Pct): | 87.7 | 10.7 | 94.1 |
| – COT Index Reading (3 Year Range): | Bullish-Extreme | Bearish-Extreme | Bullish-Extreme |
| NET POSITION MOVEMENT INDEX: | |||
| – 6-Week Change in Strength Index: | -3.9 | 2.4 | 12.9 |
COCOA Futures:
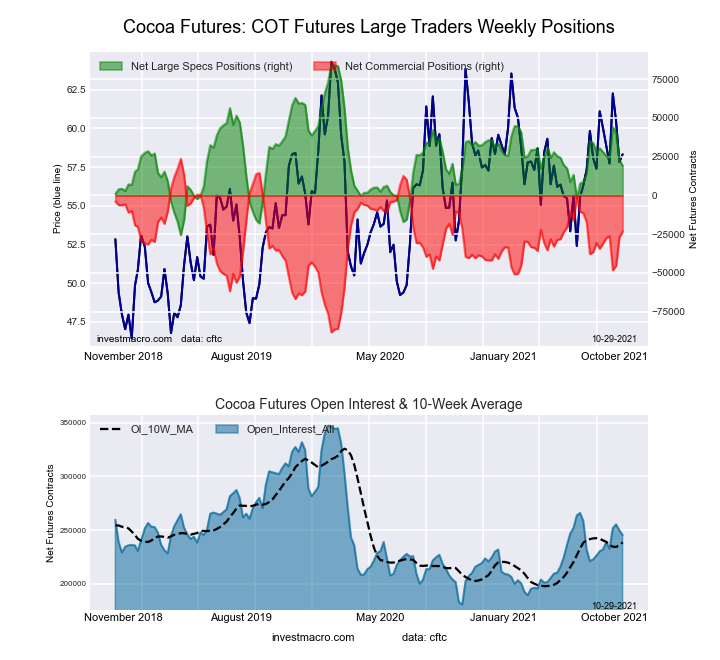 The COCOA large speculator standing this week totaled a net position of 19,198 contracts in the data reported through Tuesday. This was a weekly lowering of -3,623 contracts from the previous week which had a total of 22,821 net contracts.
This week’s current strength score (the trader positioning range over the past three years, measured from 0 to 100) shows the speculators are currently Bearish with a score of 40.8 percent. The commercials are Bullish with a score of 58.1 percent and the small traders (not shown in chart) are Bullish with a score of 54.6 percent.
| COCOA Futures Statistics | SPECULATORS | COMMERCIALS | SMALL TRADERS |
| – Percent of Open Interest Longs: | 25.2 | 52.4 | 4.8 |
| – Percent of Open Interest Shorts: | 17.4 | 61.9 | 3.1 |
| – Net Position: | 19,198 | -23,256 | 4,058 |
| – Gross Longs: | 61,920 | 128,637 | 11,662 |
| – Gross Shorts: | 42,722 | 151,893 | 7,604 |
| – Long to Short Ratio: | 1.4 to 1 | 0.8 to 1 | 1.5 to 1 |
| NET POSITION TREND: | |||
| – COT Index Score (3 Year Range Pct): | 40.8 | 58.1 | 54.6 |
| – COT Index Reading (3 Year Range): | Bearish | Bullish | Bullish |
| NET POSITION MOVEMENT INDEX: | |||
| – 6-Week Change in Strength Index: | -8.1 | 6.9 | 12.7 |
WHEAT Futures:
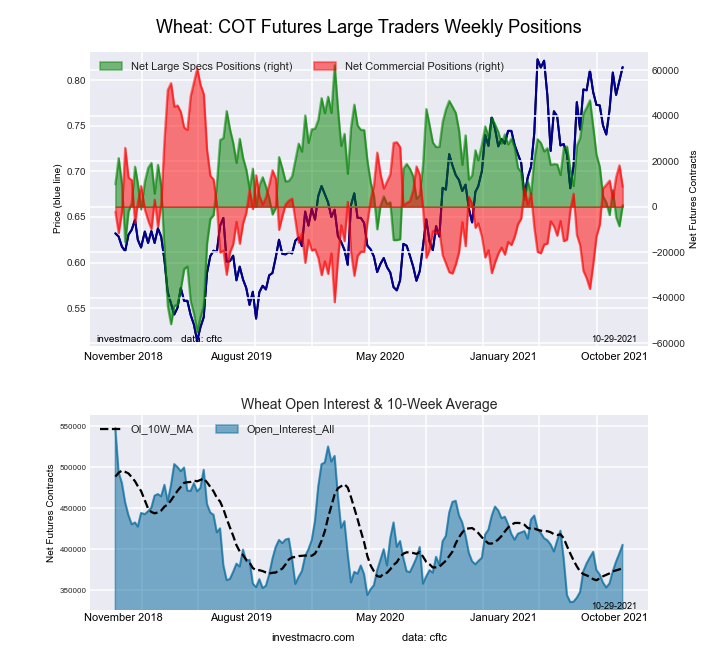 The WHEAT large speculator standing this week totaled a net position of 763 contracts in the data reported through Tuesday. This was a weekly lift of 9,329 contracts from the previous week which had a total of -8,566 net contracts.
This week’s current strength score (the trader positioning range over the past three years, measured from 0 to 100) shows the speculators are currently Bearish with a score of 47.7 percent. The commercials are Bearish with a score of 49.4 percent and the small traders (not shown in chart) are Bullish with a score of 56.1 percent.
| WHEAT Futures Statistics | SPECULATORS | COMMERCIALS | SMALL TRADERS |
| – Percent of Open Interest Longs: | 25.2 | 38.8 | 7.8 |
| – Percent of Open Interest Shorts: | 25.0 | 36.6 | 10.2 |
| – Net Position: | 763 | 8,753 | -9,516 |
| – Gross Longs: | 102,322 | 157,392 | 31,777 |
| – Gross Shorts: | 101,559 | 148,639 | 41,293 |
| – Long to Short Ratio: | 1.0 to 1 | 1.1 to 1 | 0.8 to 1 |
| NET POSITION TREND: | |||
| – COT Index Score (3 Year Range Pct): | 47.7 | 49.4 | 56.1 |
| – COT Index Reading (3 Year Range): | Bearish | Bearish | Bullish |
| NET POSITION MOVEMENT INDEX: | |||
| – 6-Week Change in Strength Index: | -3.2 | 0.7 | 14.9 |
Article By InvestMacro.com – Receive our weekly COT Reports by Email
*COT Report: The COT data, released weekly to the public each Friday, is updated through the most recent Tuesday (data is 3 days old) and shows a quick view of how large speculators or non-commercials (for-profit traders) were positioned in the futures markets.
The CFTC categorizes trader positions according to commercial hedgers (traders who use futures contracts for hedging as part of the business), non-commercials (large traders who speculate to realize trading profits) and nonreportable traders (usually small traders/speculators).
Find CFTC criteria here: (http://www.cftc.gov/MarketReports/CommitmentsofTraders/ExplanatoryNotes/index.htm).

- Oil prices jumped 4% amid a new wave of escalation between the US and Iran Jul 13, 2026
- EUR/USD: US Inflation Will Determine Everything Jul 13, 2026
- COT Metals Charts: Weekly Speculator Bets see small gains for Silver & Gold Jul 12, 2026
- COT Bonds Charts: Speculator Bets led by SOFR 3-Months & 2-Year Bonds Jul 12, 2026
- COT Energy Charts: Weekly Speculator Changes led by Brent Oil Jul 12, 2026
- COT Soft Commodities Charts: Weekly Speculator Changes led by Sugar, Corn & Soybeans Jul 12, 2026
- The US and European stock indices are rising again amid renewed investor interest in the AI industry. Jul 10, 2026
- USD/JPY Falls as Yen Recovers Weekly Losses Jul 10, 2026
- Crude oil prices surged sharply by 7% in reaction to the rapid escalation of the conflict in the Middle East Jul 9, 2026
- Middle East Tensions Weigh on Gold Jul 9, 2026