
By InvestMacro.com COT Home | Data Tables | Data Downloads | Newsletter
Here are the latest charts and statistics for the Commitment of Traders (COT) data published by the Commodities Futures Trading Commission (CFTC).
The latest COT data is updated through Tuesday October 26th 2021 and shows a quick view of how large traders (for-profit speculators and commercial entities) were positioned in the futures markets.
Highlighting this week’s COT metals data is the speculator’s bullishness in gold. The gold speculative position jumped by over +21,000 contracts this week which marked the biggest one-week jump of the past ten weeks. This brought the overall bullish position back above the +200,000 net contract level for the first time in six weeks and to the second highest bullish standing since May 25th. Gold positions have now been in a continuous bullish position all the way back to November 13th of 2018 when positions dipped to a total of -9,247 contracts.
| Oct-26-2021 | OI | OI-Index | Spec-Net | Spec-Index | Com-Net | COM-Index | Smalls-Net | Smalls-Index |
|---|---|---|---|---|---|---|---|---|
| WTI Crude | 2,144,359 | 33 | 423,718 | 47 | -472,412 | 41 | 48,694 | 84 |
| Gold | 509,794 | 28 | 214,560 | 62 | -239,654 | 38 | 25,094 | 41 |
| Silver | 141,581 | 8 | 37,532 | 60 | -51,504 | 48 | 13,972 | 21 |
| Copper | 222,927 | 43 | 37,279 | 69 | -45,870 | 28 | 8,591 | 75 |
| Palladium | 10,205 | 17 | -2,954 | 2 | 2,962 | 97 | -8 | 44 |
| Platinum | 58,161 | 19 | 14,902 | 24 | -21,280 | 79 | 6,378 | 51 |
| Natural Gas | 1,295,271 | 42 | -138,188 | 37 | 96,361 | 61 | 41,827 | 85 |
| Brent | 200,768 | 40 | -17,810 | 98 | 12,648 | 1 | 5,162 | 81 |
| Heating Oil | 423,143 | 63 | 25,791 | 80 | -49,635 | 18 | 23,844 | 81 |
| Soybeans | 658,960 | 12 | 43,230 | 41 | -10,177 | 63 | -33,053 | 17 |
| Corn | 1,438,930 | 11 | 307,810 | 69 | -252,059 | 36 | -55,751 | 11 |
| Coffee | 307,195 | 64 | 67,593 | 98 | -71,916 | 3 | 4,323 | 18 |
| Sugar | 874,742 | 21 | 198,607 | 77 | -244,341 | 22 | 45,734 | 64 |
| Wheat | 405,625 | 33 | 763 | 48 | 8,753 | 49 | -9,516 | 56 |
Gold Comex Futures:
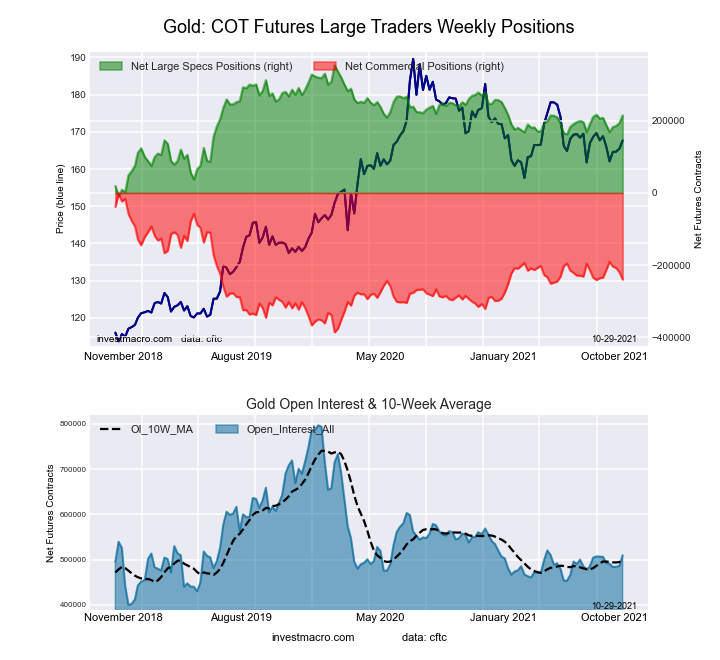 The Gold Comex Futures large speculator standing this week reached a net position of 214,560 contracts in the data reported through Tuesday. This was a weekly gain of 21,211 contracts from the previous week which had a total of 193,349 net contracts.
Free Reports:
 Get our Weekly Commitment of Traders Reports - See where the biggest traders (Hedge Funds and Commercial Hedgers) are positioned in the futures markets on a weekly basis.
 Sign Up for Our Stock Market Newsletter – Get updated on News, Charts & Rankings of Public Companies when you join our Stocks Newsletter
This week’s current strength score (the trader positioning range over the past three years, measured from 0 to 100) shows the speculators are currently Bullish with a score of 61.7 percent. The commercials are Bearish with a score of 38.0 percent and the small traders (not shown in chart) are Bearish with a score of 41.1 percent.
| Gold Futures Statistics | SPECULATORS | COMMERCIALS | SMALL TRADERS |
| – Percent of Open Interest Longs: | 61.5 | 20.3 | 9.4 |
| – Percent of Open Interest Shorts: | 19.4 | 67.3 | 4.4 |
| – Net Position: | 214,560 | -239,654 | 25,094 |
| – Gross Longs: | 313,646 | 103,423 | 47,707 |
| – Gross Shorts: | 99,086 | 343,077 | 22,613 |
| – Long to Short Ratio: | 3.2 to 1 | 0.3 to 1 | 2.1 to 1 |
| NET POSITION TREND: | |||
| – COT Index Score (3 Year Range Pct): | 61.7 | 38.0 | 41.1 |
| – COT Index Reading (3 Year Range): | Bullish | Bearish | Bearish |
| NET POSITION MOVEMENT INDEX: | |||
| – 6-Week Change in Strength Index: | 1.9 | -1.4 | -3.6 |
Silver Comex Futures:
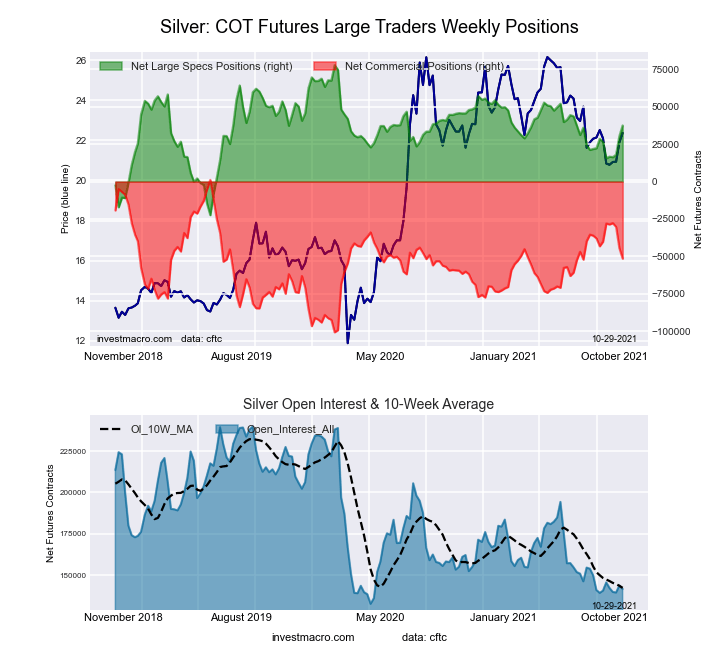 The Silver Comex Futures large speculator standing this week reached a net position of 37,532 contracts in the data reported through Tuesday. This was a weekly lift of 7,176 contracts from the previous week which had a total of 30,356 net contracts.
This week’s current strength score (the trader positioning range over the past three years, measured from 0 to 100) shows the speculators are currently Bullish with a score of 59.8 percent. The commercials are Bearish with a score of 48.4 percent and the small traders (not shown in chart) are Bearish with a score of 21.4 percent.
| Silver Futures Statistics | SPECULATORS | COMMERCIALS | SMALL TRADERS |
| – Percent of Open Interest Longs: | 47.1 | 27.8 | 18.6 |
| – Percent of Open Interest Shorts: | 20.6 | 64.1 | 8.8 |
| – Net Position: | 37,532 | -51,504 | 13,972 |
| – Gross Longs: | 66,677 | 39,289 | 26,376 |
| – Gross Shorts: | 29,145 | 90,793 | 12,404 |
| – Long to Short Ratio: | 2.3 to 1 | 0.4 to 1 | 2.1 to 1 |
| NET POSITION TREND: | |||
| – COT Index Score (3 Year Range Pct): | 59.8 | 48.4 | 21.4 |
| – COT Index Reading (3 Year Range): | Bullish | Bearish | Bearish |
| NET POSITION MOVEMENT INDEX: | |||
| – 6-Week Change in Strength Index: | 10.8 | -11.1 | 3.0 |
Copper Grade #1 Futures:
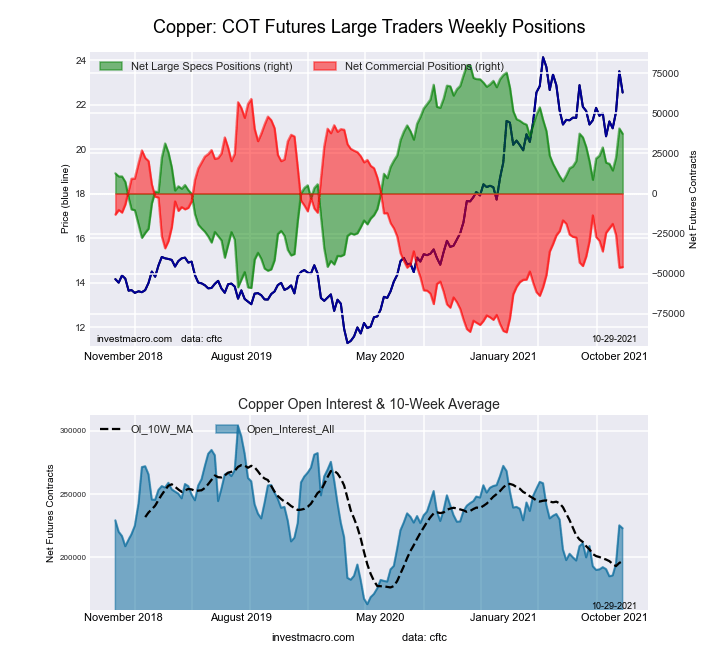 The Copper Grade #1 Futures large speculator standing this week reached a net position of 37,279 contracts in the data reported through Tuesday. This was a weekly decline of -3,305 contracts from the previous week which had a total of 40,584 net contracts.
This week’s current strength score (the trader positioning range over the past three years, measured from 0 to 100) shows the speculators are currently Bullish with a score of 69.2 percent. The commercials are Bearish with a score of 27.9 percent and the small traders (not shown in chart) are Bullish with a score of 75.0 percent.
| Copper Futures Statistics | SPECULATORS | COMMERCIALS | SMALL TRADERS |
| – Percent of Open Interest Longs: | 44.1 | 36.0 | 9.0 |
| – Percent of Open Interest Shorts: | 27.3 | 56.5 | 5.1 |
| – Net Position: | 37,279 | -45,870 | 8,591 |
| – Gross Longs: | 98,232 | 80,168 | 20,017 |
| – Gross Shorts: | 60,953 | 126,038 | 11,426 |
| – Long to Short Ratio: | 1.6 to 1 | 0.6 to 1 | 1.8 to 1 |
| NET POSITION TREND: | |||
| – COT Index Score (3 Year Range Pct): | 69.2 | 27.9 | 75.0 |
| – COT Index Reading (3 Year Range): | Bullish | Bearish | Bullish |
| NET POSITION MOVEMENT INDEX: | |||
| – 6-Week Change in Strength Index: | 6.1 | -6.7 | 7.3 |
Platinum Futures:
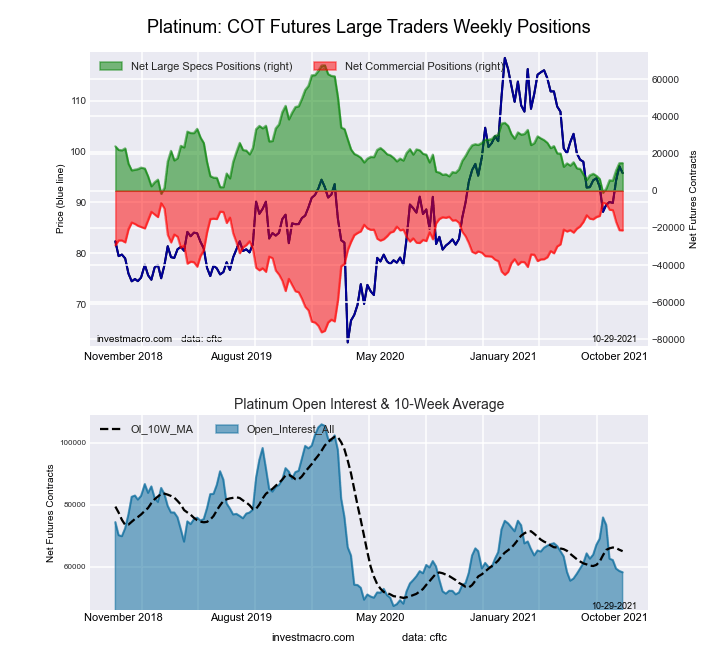 The Platinum Futures large speculator standing this week reached a net position of 14,902 contracts in the data reported through Tuesday. This was a weekly increase of 58 contracts from the previous week which had a total of 14,844 net contracts.
This week’s current strength score (the trader positioning range over the past three years, measured from 0 to 100) shows the speculators are currently Bearish with a score of 23.9 percent. The commercials are Bullish with a score of 78.6 percent and the small traders (not shown in chart) are Bullish with a score of 51.0 percent.
| Platinum Futures Statistics | SPECULATORS | COMMERCIALS | SMALL TRADERS |
| – Percent of Open Interest Longs: | 50.6 | 29.7 | 15.8 |
| – Percent of Open Interest Shorts: | 25.0 | 66.3 | 4.8 |
| – Net Position: | 14,902 | -21,280 | 6,378 |
| – Gross Longs: | 29,445 | 17,265 | 9,174 |
| – Gross Shorts: | 14,543 | 38,545 | 2,796 |
| – Long to Short Ratio: | 2.0 to 1 | 0.4 to 1 | 3.3 to 1 |
| NET POSITION TREND: | |||
| – COT Index Score (3 Year Range Pct): | 23.9 | 78.6 | 51.0 |
| – COT Index Reading (3 Year Range): | Bearish | Bullish | Bullish |
| NET POSITION MOVEMENT INDEX: | |||
| – 6-Week Change in Strength Index: | 23.1 | -21.4 | -14.5 |
Palladium Futures:
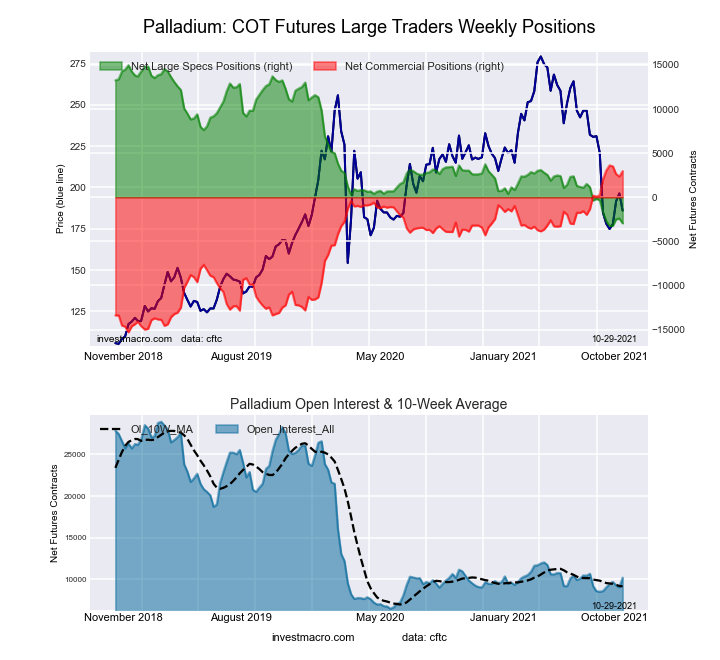 The Palladium Futures large speculator standing this week reached a net position of -2,954 contracts in the data reported through Tuesday. This was a weekly reduction of -538 contracts from the previous week which had a total of -2,416 net contracts.
This week’s current strength score (the trader positioning range over the past three years, measured from 0 to 100) shows the speculators are currently Bearish-Extreme with a score of 1.6 percent. The commercials are Bullish-Extreme with a score of 96.6 percent and the small traders (not shown in chart) are Bearish with a score of 44.2 percent.
| Palladium Futures Statistics | SPECULATORS | COMMERCIALS | SMALL TRADERS |
| – Percent of Open Interest Longs: | 26.4 | 51.8 | 14.1 |
| – Percent of Open Interest Shorts: | 55.3 | 22.8 | 14.2 |
| – Net Position: | -2,954 | 2,962 | -8 |
| – Gross Longs: | 2,691 | 5,285 | 1,437 |
| – Gross Shorts: | 5,645 | 2,323 | 1,445 |
| – Long to Short Ratio: | 0.5 to 1 | 2.3 to 1 | 1.0 to 1 |
| NET POSITION TREND: | |||
| – COT Index Score (3 Year Range Pct): | 1.6 | 96.6 | 44.2 |
| – COT Index Reading (3 Year Range): | Bearish-Extreme | Bullish-Extreme | Bearish |
| NET POSITION MOVEMENT INDEX: | |||
| – 6-Week Change in Strength Index: | -6.7 | 4.8 | 19.1 |
Article By InvestMacro.com – Receive our weekly COT Reports by Email
*COT Report: The COT data, released weekly to the public each Friday, is updated through the most recent Tuesday (data is 3 days old) and shows a quick view of how large speculators or non-commercials (for-profit traders) were positioned in the futures markets.
The CFTC categorizes trader positions according to commercial hedgers (traders who use futures contracts for hedging as part of the business), non-commercials (large traders who speculate to realize trading profits) and nonreportable traders (usually small traders/speculators).
Find CFTC criteria here: (http://www.cftc.gov/MarketReports/CommitmentsofTraders/ExplanatoryNotes/index.htm).

- Oil prices jumped 4% amid a new wave of escalation between the US and Iran Jul 13, 2026
- EUR/USD: US Inflation Will Determine Everything Jul 13, 2026
- COT Metals Charts: Weekly Speculator Bets see small gains for Silver & Gold Jul 12, 2026
- COT Bonds Charts: Speculator Bets led by SOFR 3-Months & 2-Year Bonds Jul 12, 2026
- COT Energy Charts: Weekly Speculator Changes led by Brent Oil Jul 12, 2026
- COT Soft Commodities Charts: Weekly Speculator Changes led by Sugar, Corn & Soybeans Jul 12, 2026
- The US and European stock indices are rising again amid renewed investor interest in the AI industry. Jul 10, 2026
- USD/JPY Falls as Yen Recovers Weekly Losses Jul 10, 2026
- Crude oil prices surged sharply by 7% in reaction to the rapid escalation of the conflict in the Middle East Jul 9, 2026
- Middle East Tensions Weigh on Gold Jul 9, 2026