
By InvestMacro | COT | Data Tables | COT Leaders | Downloads | COT Newsletter
Here are the latest charts and statistics for the Commitment of Traders (COT) data published by the Commodities Futures Trading Commission (CFTC).
The latest COT data is updated through Tuesday November 2nd 2021 and shows a quick view of how large traders (for-profit speculators and commercial entities) were positioned in the futures markets.
Highlighting this week’s COT Energy data is once again the Brent Oil (Last Day) contracts which have reached their best speculator position in the past one-hundred and fifty-nine weeks, dating back to October 23rd of 2018. The Brent speculative position has climbed higher for five straight weeks and for eight out the past nine weeks as well. The speculative position for Brent have continually remained in a bearish overall standing since 2013 but have been trending closer to a neutral zone lately. The strength index score (the speculative level compared to the past 3-years and used to show extremes) has risen to a score of 100 percent, showing that speculator bets are 3-year high.
| Nov-02-2021 | OI | OI-Index | Spec-Net | Spec-Index | Com-Net | COM-Index | Smalls-Net | Smalls-Index |
|---|---|---|---|---|---|---|---|---|
| WTI Crude | 2,121,461 | 29 | 419,293 | 46 | -461,516 | 44 | 42,223 | 75 |
| Gold | 507,616 | 27 | 215,129 | 62 | -239,877 | 38 | 24,748 | 40 |
| Silver | 141,394 | 8 | 33,115 | 55 | -48,860 | 51 | 15,745 | 32 |
| Copper | 217,216 | 39 | 32,335 | 66 | -41,294 | 31 | 8,959 | 77 |
| Palladium | 10,926 | 20 | -3,391 | 0 | 3,574 | 100 | -183 | 34 |
| Platinum | 56,508 | 16 | 15,364 | 25 | -21,964 | 78 | 6,600 | 54 |
| Natural Gas | 1,267,227 | 35 | -137,713 | 37 | 93,517 | 60 | 44,196 | 91 |
| Brent | 183,766 | 27 | -12,714 | 100 | 7,688 | 0 | 5,026 | 79 |
| Heating Oil | 426,636 | 66 | 22,384 | 75 | -45,844 | 22 | 23,460 | 80 |
| Soybeans | 620,172 | 3 | 58,756 | 45 | -19,885 | 61 | -38,871 | 7 |
| Corn | 1,506,602 | 22 | 383,109 | 79 | -320,385 | 26 | -62,724 | 7 |
| Coffee | 310,931 | 66 | 64,353 | 95 | -69,264 | 6 | 4,911 | 22 |
| Sugar | 884,507 | 21 | 209,061 | 80 | -250,849 | 21 | 41,788 | 60 |
| Wheat | 409,137 | 39 | 17,896 | 62 | -11,141 | 30 | -6,755 | 69 |
WTI Crude Oil Futures:
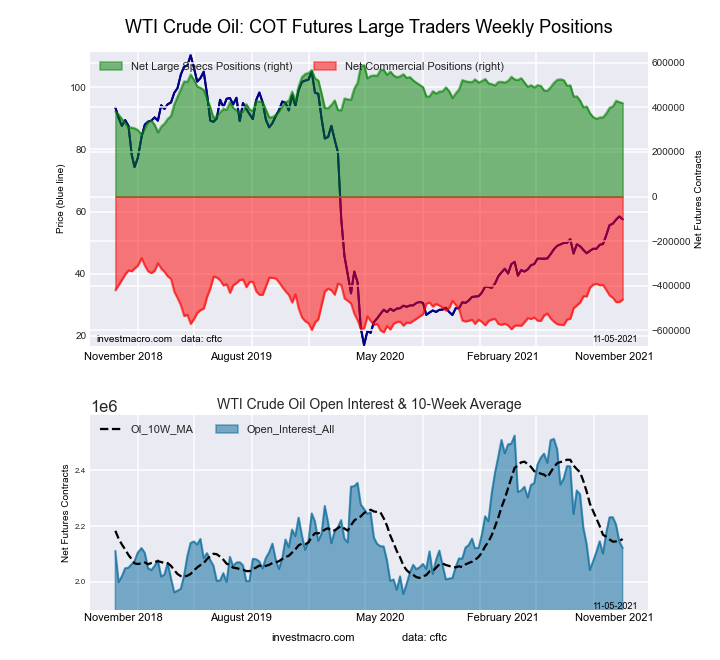 The WTI Crude Oil Futures large speculator standing this week resulted in a net position of 419,293 contracts in the data reported through Tuesday. This was a weekly reduction of -4,425 contracts from the previous week which had a total of 423,718 net contracts.
Free Reports:
 Download Our Metatrader 4 Indicators – Put Our Free MetaTrader 4 Custom Indicators on your charts when you join our Weekly Newsletter
 Get our Weekly Commitment of Traders Reports - See where the biggest traders (Hedge Funds and Commercial Hedgers) are positioned in the futures markets on a weekly basis.
This week’s current strength score (the trader positioning range over the past three years, measured from 0 to 100) shows the speculators are currently Bearish with a score of 45.5 percent. The commercials are Bearish with a score of 44.1 percent and the small traders (not shown in chart) are Bullish with a score of 74.5 percent.
| WTI Crude Oil Futures Statistics | SPECULATORS | COMMERCIALS | SMALL TRADERS |
| – Percent of Open Interest Longs: | 25.9 | 33.2 | 4.5 |
| – Percent of Open Interest Shorts: | 6.1 | 55.0 | 2.5 |
| – Net Position: | 419,293 | -461,516 | 42,223 |
| – Gross Longs: | 548,631 | 705,007 | 94,536 |
| – Gross Shorts: | 129,338 | 1,166,523 | 52,313 |
| – Long to Short Ratio: | 4.2 to 1 | 0.6 to 1 | 1.8 to 1 |
| NET POSITION TREND: | |||
| – COT Index Score (3 Year Range Pct): | 45.5 | 44.1 | 74.5 |
| – COT Index Reading (3 Year Range): | Bearish | Bearish | Bullish |
| NET POSITION MOVEMENT INDEX: | |||
| – 6-Week Change in Strength Index: | 20.3 | -19.6 | 2.9 |
Brent Crude Oil Futures:
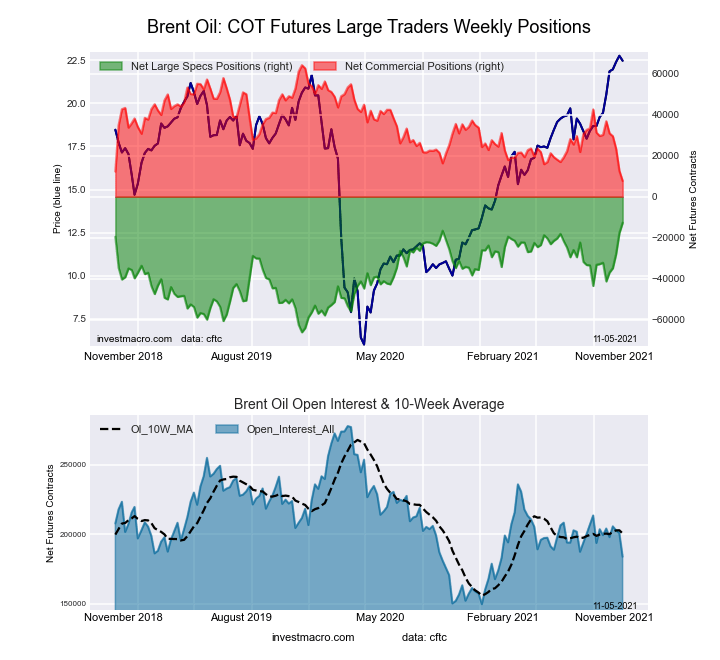 The Brent Crude Oil Futures large speculator standing this week resulted in a net position of -12,714 contracts in the data reported through Tuesday. This was a weekly advance of 5,096 contracts from the previous week which had a total of -17,810 net contracts.
This week’s current strength score (the trader positioning range over the past three years, measured from 0 to 100) shows the speculators are currently Bullish-Extreme with a score of 100.0 percent. The commercials are Bearish-Extreme with a score of 0.0 percent and the small traders (not shown in chart) are Bullish with a score of 79.5 percent.
| Brent Crude Oil Futures Statistics | SPECULATORS | COMMERCIALS | SMALL TRADERS |
| – Percent of Open Interest Longs: | 25.2 | 39.6 | 4.7 |
| – Percent of Open Interest Shorts: | 32.1 | 35.4 | 2.0 |
| – Net Position: | -12,714 | 7,688 | 5,026 |
| – Gross Longs: | 46,286 | 72,705 | 8,677 |
| – Gross Shorts: | 59,000 | 65,017 | 3,651 |
| – Long to Short Ratio: | 0.8 to 1 | 1.1 to 1 | 2.4 to 1 |
| NET POSITION TREND: | |||
| – COT Index Score (3 Year Range Pct): | 100.0 | 0.0 | 79.5 |
| – COT Index Reading (3 Year Range): | Bullish-Extreme | Bearish-Extreme | Bullish |
| NET POSITION MOVEMENT INDEX: | |||
| – 6-Week Change in Strength Index: | 36.5 | -39.8 | 25.8 |
Natural Gas Futures:
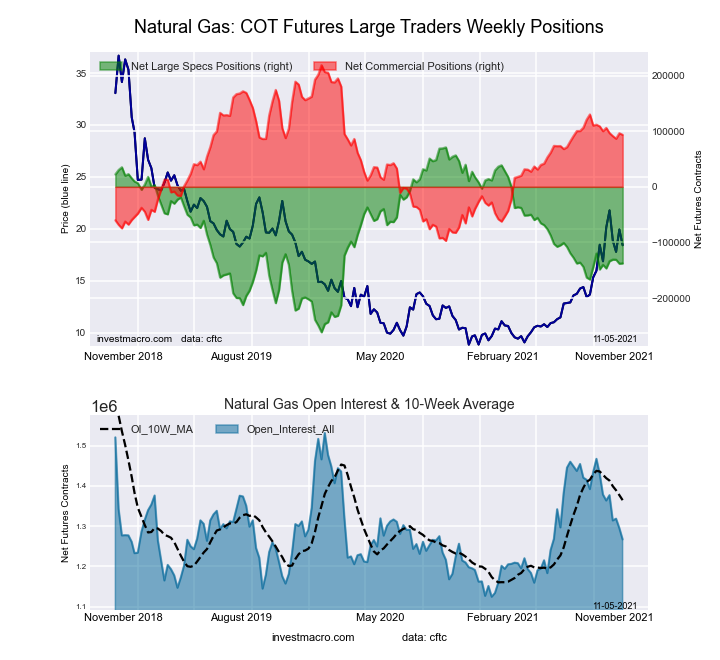 The Natural Gas Futures large speculator standing this week resulted in a net position of -137,713 contracts in the data reported through Tuesday. This was a weekly boost of 475 contracts from the previous week which had a total of -138,188 net contracts.
This week’s current strength score (the trader positioning range over the past three years, measured from 0 to 100) shows the speculators are currently Bearish with a score of 37.2 percent. The commercials are Bullish with a score of 60.3 percent and the small traders (not shown in chart) are Bullish-Extreme with a score of 90.9 percent.
| Natural Gas Futures Statistics | SPECULATORS | COMMERCIALS | SMALL TRADERS |
| – Percent of Open Interest Longs: | 19.9 | 44.6 | 5.3 |
| – Percent of Open Interest Shorts: | 30.8 | 37.2 | 1.8 |
| – Net Position: | -137,713 | 93,517 | 44,196 |
| – Gross Longs: | 252,244 | 565,097 | 66,820 |
| – Gross Shorts: | 389,957 | 471,580 | 22,624 |
| – Long to Short Ratio: | 0.6 to 1 | 1.2 to 1 | 3.0 to 1 |
| NET POSITION TREND: | |||
| – COT Index Score (3 Year Range Pct): | 37.2 | 60.3 | 90.9 |
| – COT Index Reading (3 Year Range): | Bearish | Bullish | Bullish-Extreme |
| NET POSITION MOVEMENT INDEX: | |||
| – 6-Week Change in Strength Index: | 0.8 | -2.1 | 10.2 |
Gasoline Blendstock Futures:
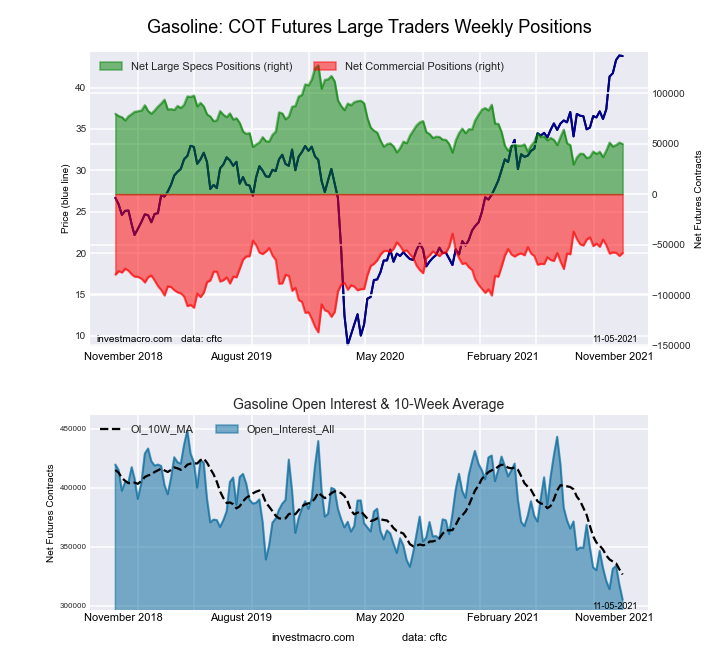 The Gasoline Blendstock Futures large speculator standing this week resulted in a net position of 49,697 contracts in the data reported through Tuesday. This was a weekly decrease of -1,348 contracts from the previous week which had a total of 51,045 net contracts.
This week’s current strength score (the trader positioning range over the past three years, measured from 0 to 100) shows the speculators are currently Bearish with a score of 20.7 percent. The commercials are Bullish with a score of 78.7 percent and the small traders (not shown in chart) are Bullish with a score of 62.9 percent.
| Nasdaq Mini Futures Statistics | SPECULATORS | COMMERCIALS | SMALL TRADERS |
| – Percent of Open Interest Longs: | 35.2 | 42.1 | 6.6 |
| – Percent of Open Interest Shorts: | 19.0 | 61.2 | 3.8 |
| – Net Position: | 49,697 | -58,294 | 8,597 |
| – Gross Longs: | 107,573 | 128,541 | 20,227 |
| – Gross Shorts: | 57,876 | 186,835 | 11,630 |
| – Long to Short Ratio: | 1.9 to 1 | 0.7 to 1 | 1.7 to 1 |
| NET POSITION TREND: | |||
| – COT Index Score (3 Year Range Pct): | 20.7 | 78.7 | 62.9 |
| – COT Index Reading (3 Year Range): | Bearish | Bullish | Bullish |
| NET POSITION MOVEMENT INDEX: | |||
| – 6-Week Change in Strength Index: | 13.2 | -13.4 | 2.0 |
#2 Heating Oil NY-Harbor Futures:
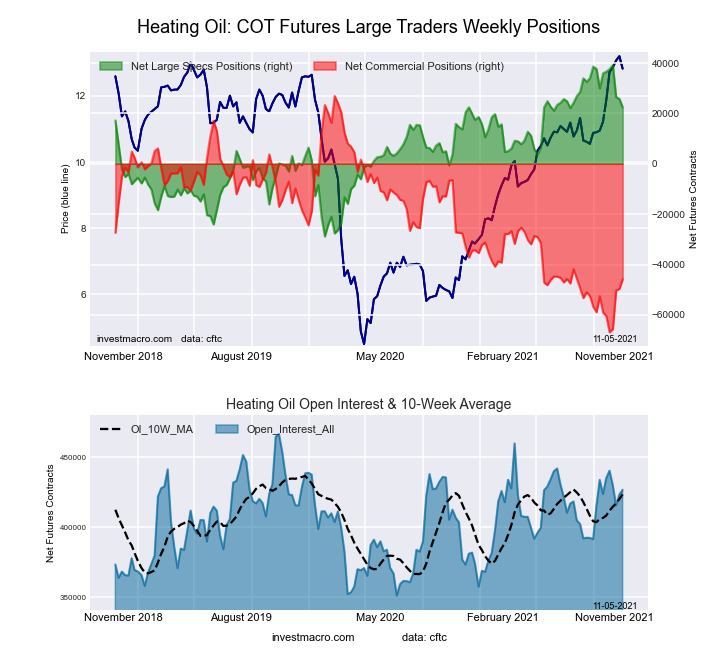 The #2 Heating Oil NY-Harbor Futures large speculator standing this week resulted in a net position of 22,384 contracts in the data reported through Tuesday. This was a weekly lowering of -3,407 contracts from the previous week which had a total of 25,791 net contracts.
This week’s current strength score (the trader positioning range over the past three years, measured from 0 to 100) shows the speculators are currently Bullish with a score of 75.4 percent. The commercials are Bearish with a score of 22.4 percent and the small traders (not shown in chart) are Bullish with a score of 79.6 percent.
| Heating Oil Futures Statistics | SPECULATORS | COMMERCIALS | SMALL TRADERS |
| – Percent of Open Interest Longs: | 14.6 | 52.2 | 11.2 |
| – Percent of Open Interest Shorts: | 9.3 | 62.9 | 5.7 |
| – Net Position: | 22,384 | -45,844 | 23,460 |
| – Gross Longs: | 62,233 | 222,565 | 47,794 |
| – Gross Shorts: | 39,849 | 268,409 | 24,334 |
| – Long to Short Ratio: | 1.6 to 1 | 0.8 to 1 | 2.0 to 1 |
| NET POSITION TREND: | |||
| – COT Index Score (3 Year Range Pct): | 75.4 | 22.4 | 79.6 |
| – COT Index Reading (3 Year Range): | Bullish | Bearish | Bullish |
| NET POSITION MOVEMENT INDEX: | |||
| – 6-Week Change in Strength Index: | -19.9 | 14.1 | 1.0 |
Bloomberg Commodity Index Futures:
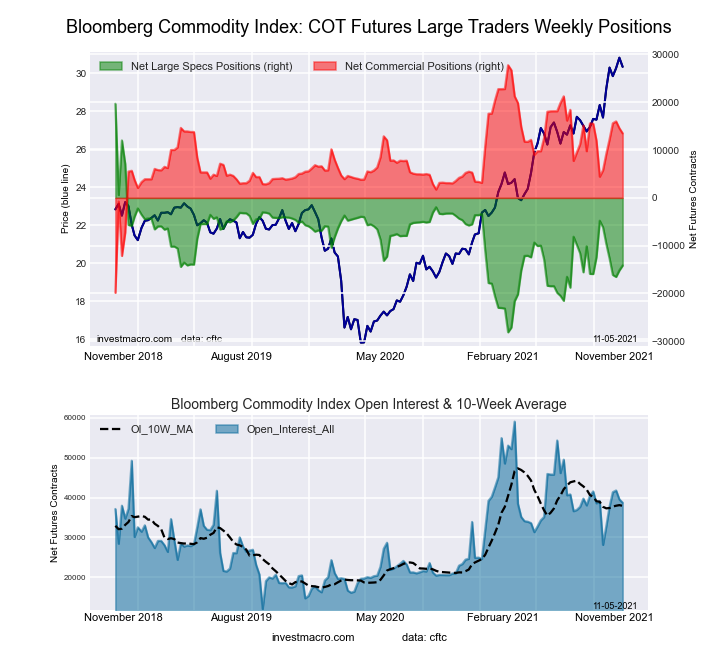 The Bloomberg Commodity Index Futures large speculator standing this week resulted in a net position of -14,146 contracts in the data reported through Tuesday. This was a weekly advance of 1,028 contracts from the previous week which had a total of -15,174 net contracts.
This week’s current strength score (the trader positioning range over the past three years, measured from 0 to 100) shows the speculators are currently Bearish with a score of 29.2 percent. The commercials are Bullish with a score of 70.1 percent and the small traders (not shown in chart) are Bullish with a score of 53.1 percent.
| Bloomberg Index Futures Statistics | SPECULATORS | COMMERCIALS | SMALL TRADERS |
| – Percent of Open Interest Longs: | 53.5 | 40.0 | 1.9 |
| – Percent of Open Interest Shorts: | 90.0 | 5.2 | 0.2 |
| – Net Position: | -14,146 | 13,490 | 656 |
| – Gross Longs: | 20,704 | 15,506 | 746 |
| – Gross Shorts: | 34,850 | 2,016 | 90 |
| – Long to Short Ratio: | 0.6 to 1 | 7.7 to 1 | 8.3 to 1 |
| NET POSITION TREND: | |||
| – COT Index Score (3 Year Range Pct): | 29.2 | 70.1 | 53.1 |
| – COT Index Reading (3 Year Range): | Bearish | Bullish | Bullish |
| NET POSITION MOVEMENT INDEX: | |||
| – 6-Week Change in Strength Index: | -16.7 | 16.2 | 12.5 |
Article By InvestMacro – Receive our weekly COT Reports by Email
*COT Report: The COT data, released weekly to the public each Friday, is updated through the most recent Tuesday (data is 3 days old) and shows a quick view of how large speculators or non-commercials (for-profit traders) were positioned in the futures markets.
The CFTC categorizes trader positions according to commercial hedgers (traders who use futures contracts for hedging as part of the business), non-commercials (large traders who speculate to realize trading profits) and nonreportable traders (usually small traders/speculators) as well as their open interest (contracts open in the market at time of reporting).See CFTC criteria here.

- COT Metals Charts: Weekly Speculator Bets led by Copper & Steel Jul 18, 2026
- COT Bonds Charts: Weekly Speculator Bets led by 2-Year, SOFR 3M & 5-Year Bonds Jul 18, 2026
- COT Energy Charts: Weekly Speculator Bets led by Brent Oil & Heating Oil Jul 18, 2026
- COT Soft Commodities Charts: Weekly Speculator Bets led by Wheat, Corn & Soybean Meal Jul 18, 2026
- The Bank of Canada kept its interest rate unchanged. Platinum prices reached a three‑week high Jul 16, 2026
- Stock indices rose after the release of US inflation data. China’s GDP slowed sharply Jul 15, 2026
- GBP/USD Awaits Political News: What Will Happen Next Jul 15, 2026
- USD/JPY Holds at Highs: Pressure Lingers on Yen Jul 14, 2026
- Oil prices jumped 4% amid a new wave of escalation between the US and Iran Jul 13, 2026
- EUR/USD: US Inflation Will Determine Everything Jul 13, 2026