
By InvestMacro
Here are the latest charts and statistics for the Commitment of Traders (COT) reports data published by the Commodities Futures Trading Commission (CFTC).
The latest COT data is updated through Tuesday November 15th and shows a quick view of how large traders (for-profit speculators and commercial entities) were positioned in the futures markets.
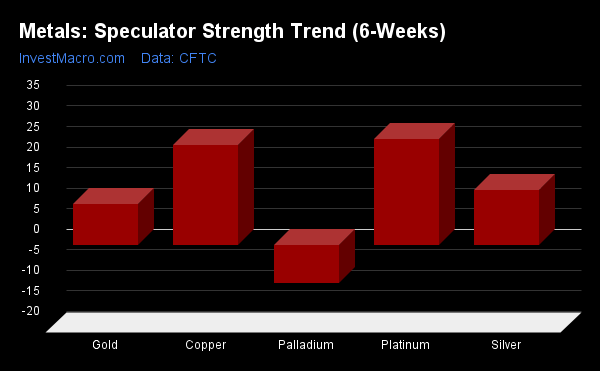
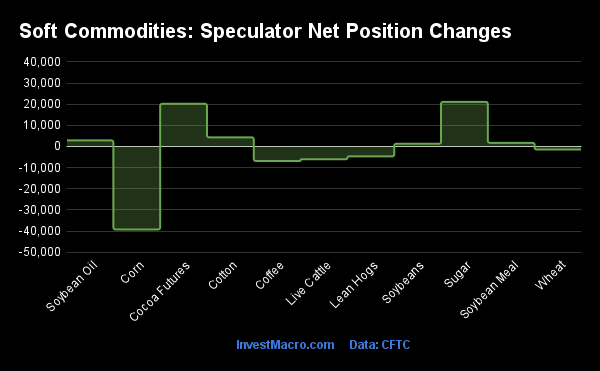
Sugar & Cocoa top Weekly Speculator Changes
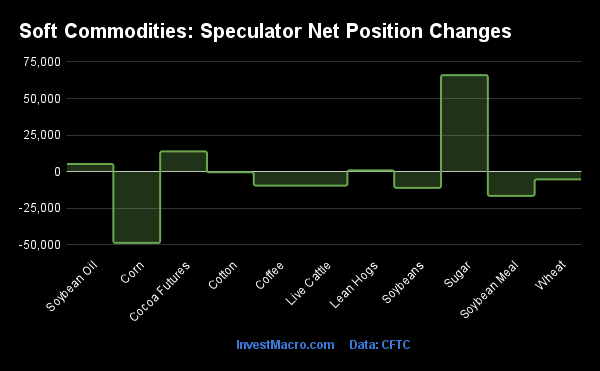
The COT soft commodities speculator bets were lower overall this week as four out of the eleven soft commodities markets we cover had higher positioning this week while the other seven markets had decreases in contracts.
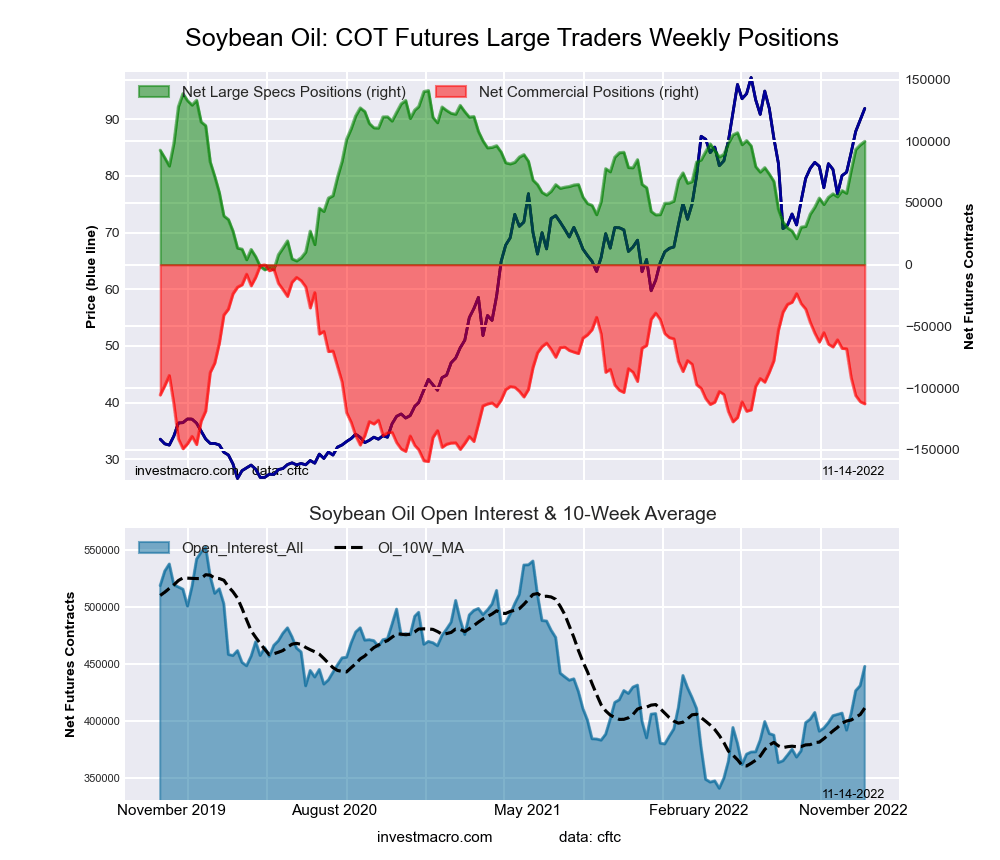
Leading the gains for soft commodities markets was Sugar (66,012 contracts) with Cocoa (13,895 contracts), Soybean Oil (5,282 contracts) and Lean Hogs (897 contracts) also showing positive weeks.
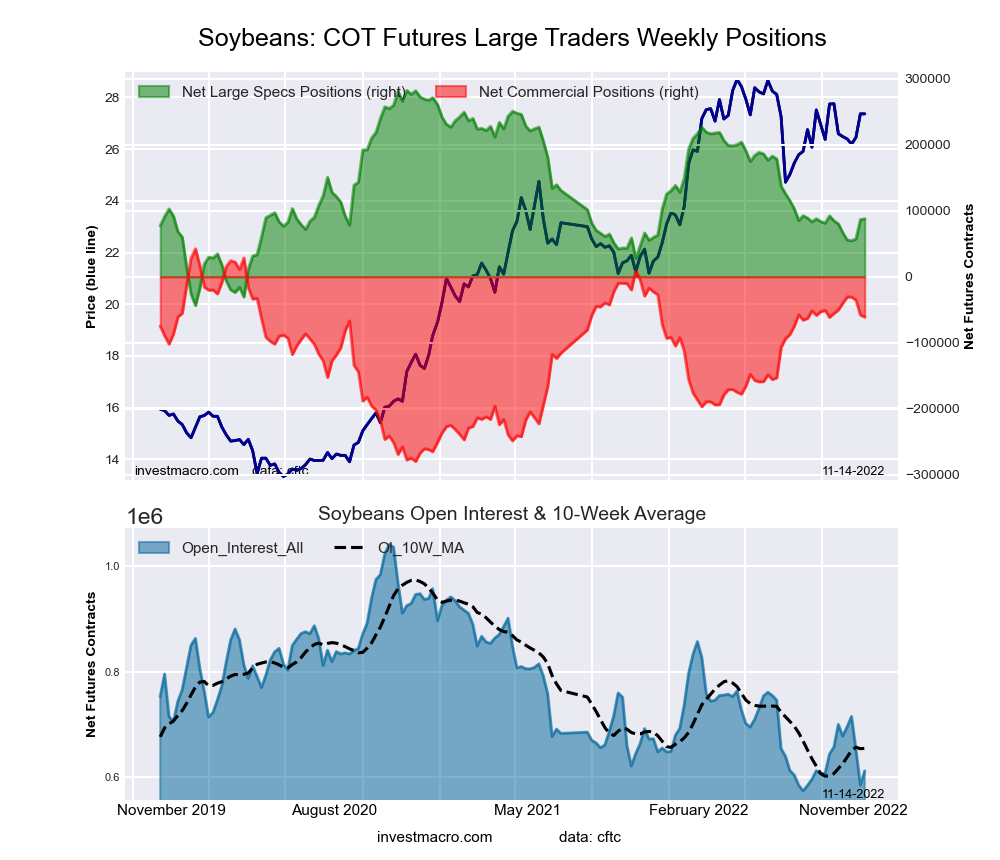
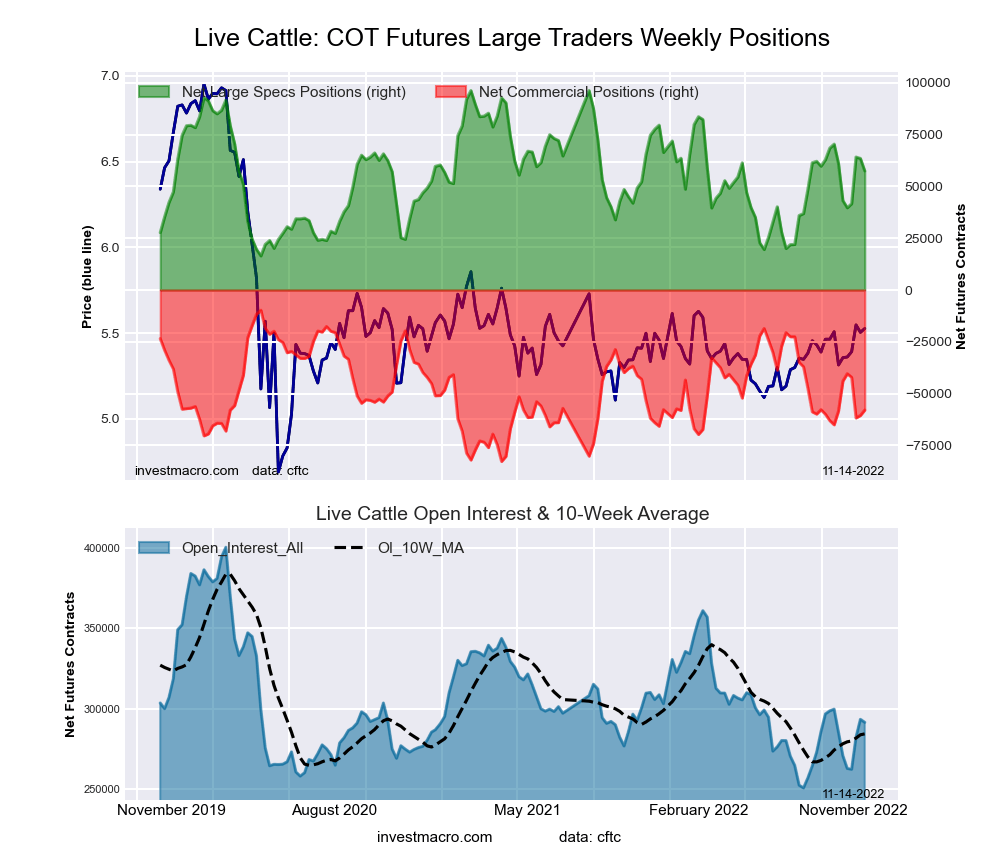
The softs market leading the declines in speculator bets this week was Corn (-48,646 contracts) with Soybean Meal (-16,485 contracts), Soybeans (-11,005 contracts), Live Cattle (-9,513 contracts), Coffee (-9,471 contracts), Wheat (-5,267 contracts) and Cotton (-364 contracts) also registering lower bets on the week.
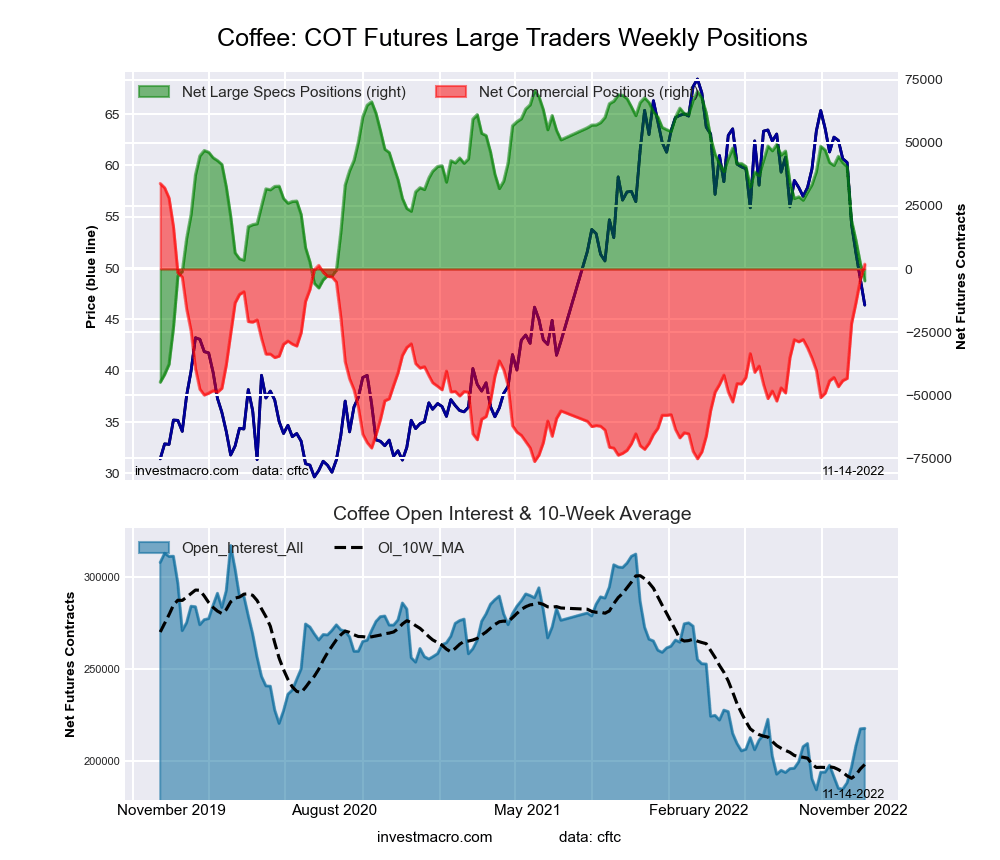
A highlight of this week’s COT soft commodities data is the continued decline of the Coffee futures positioning that have hit their first net bearish positions since July of 2020. Large speculators dropped their weekly bets for Coffee for the seventh straight week this week and for the tenth time out of the past eleven weeks. Coffee bets have now fallen by a total of -58,834 contracts over just these past seven weeks and are in an overall bearish position for the second straight week.
The decline in spec bets has happened very rapidly as bullish positions were as high as +40,000 contracts on November 1st while the position leveled at a total net position of -14,154 contracts through Tuesday. This week’s net position marks the lowest speculator standing since November 5th of 2019, a span of 158 weeks.
Coffee prices have been on a steep drop as well with futures prices falling by over -35 percent since late-August. Helping put a dent in prices is an improved outlook for production out of Brazil that is seen as positive for the coffee harvest.
| Nov-15-2022 | OI | OI-Index | Spec-Net | Spec-Index | Com-Net | COM-Index | Smalls-Net | Smalls-Index |
|---|---|---|---|---|---|---|---|---|
| WTI Crude | 1,469,437 | 3 | 278,267 | 18 | -307,395 | 81 | 29,128 | 48 |
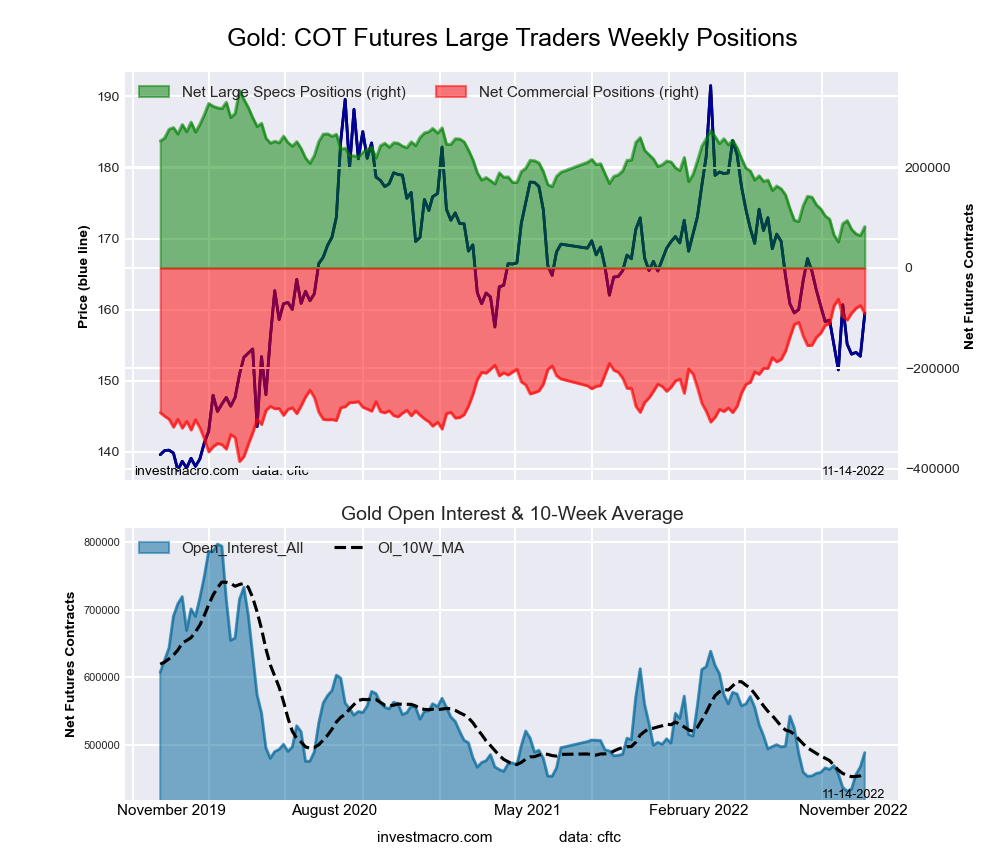
| Gold | 495,171 | 17 | 126,269 | 25 | -134,308 | 78 | 8,039 | 0 |
| Silver | 141,623 | 14 | 17,607 | 34 | -29,424 | 67 | 11,817 | 27 |
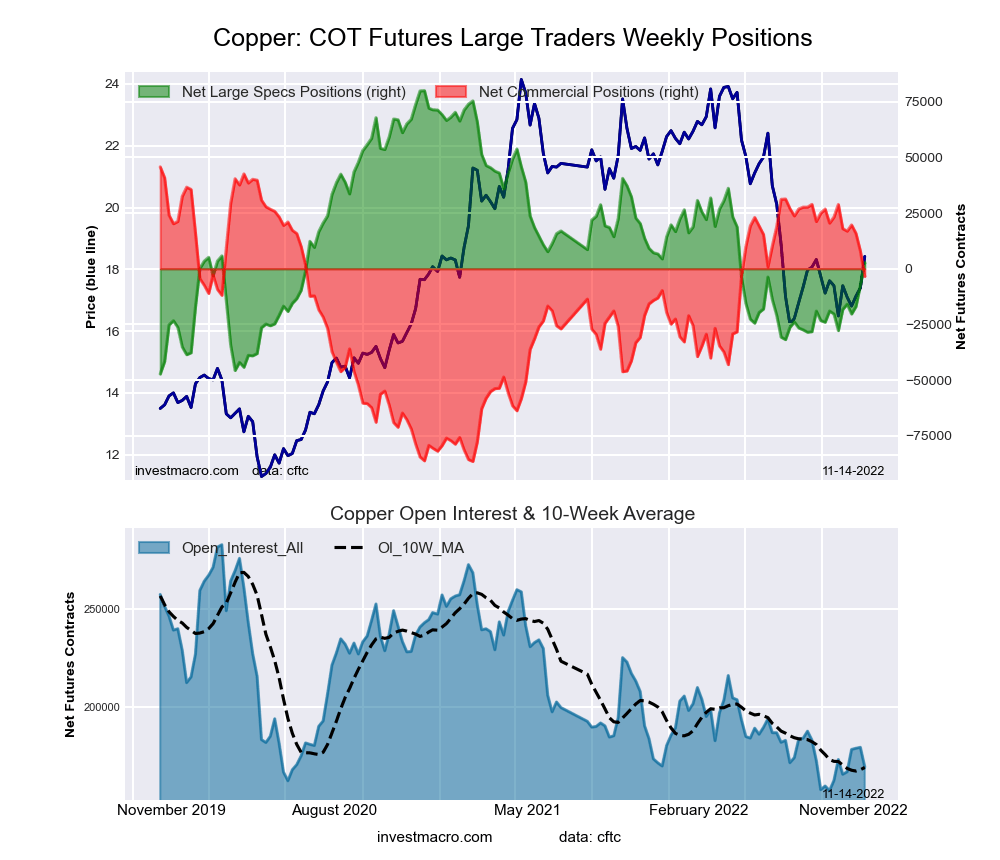
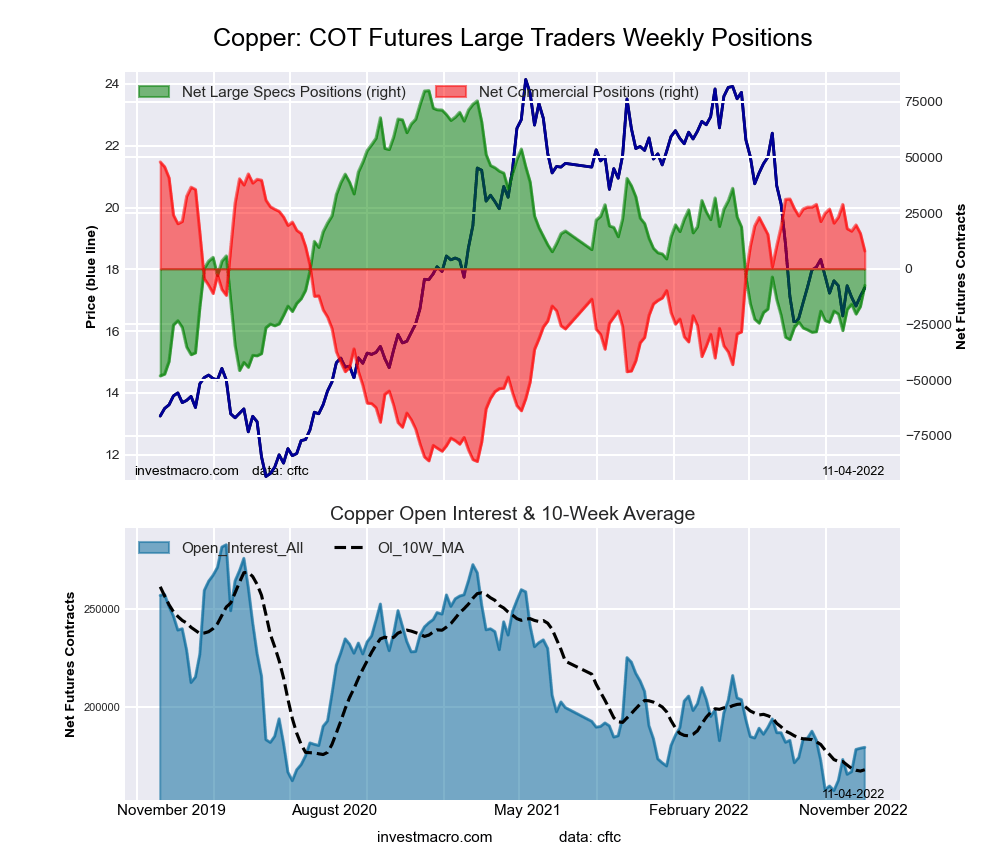
| Copper | 168,962 | 9 | 9,821 | 44 | -13,583 | 56 | 3,762 | 47 |
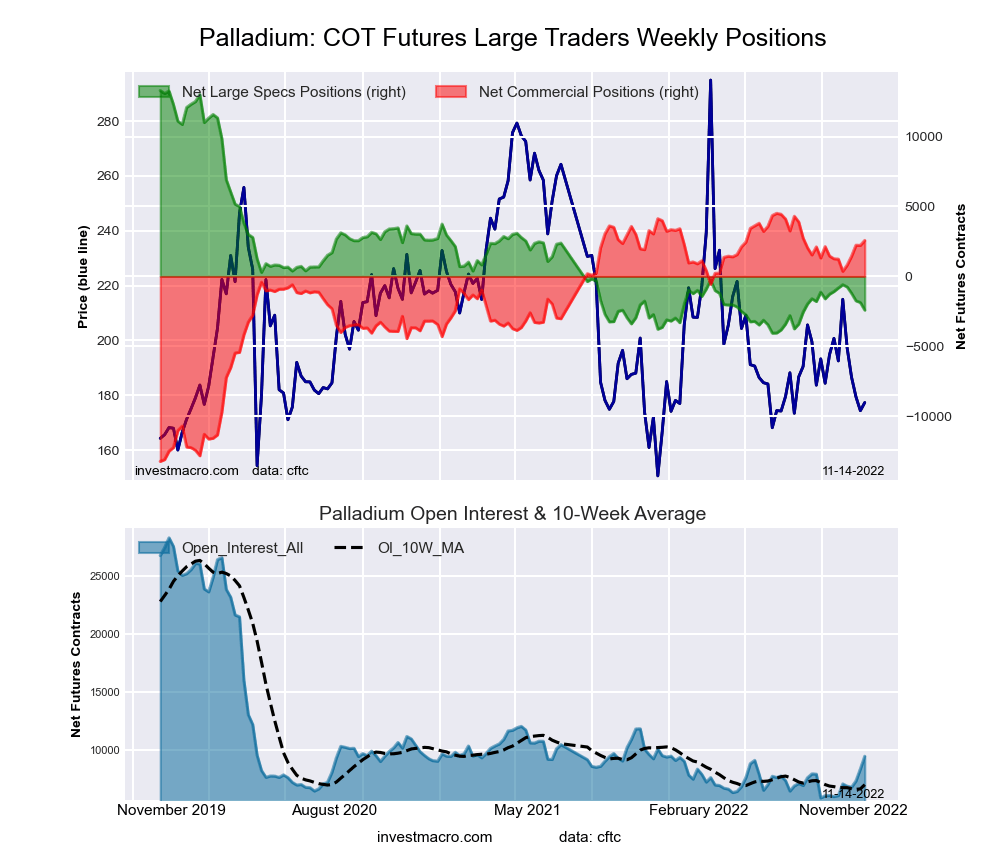
| Palladium | 8,793 | 14 | -1,072 | 17 | 1,231 | 81 | -159 | 32 |
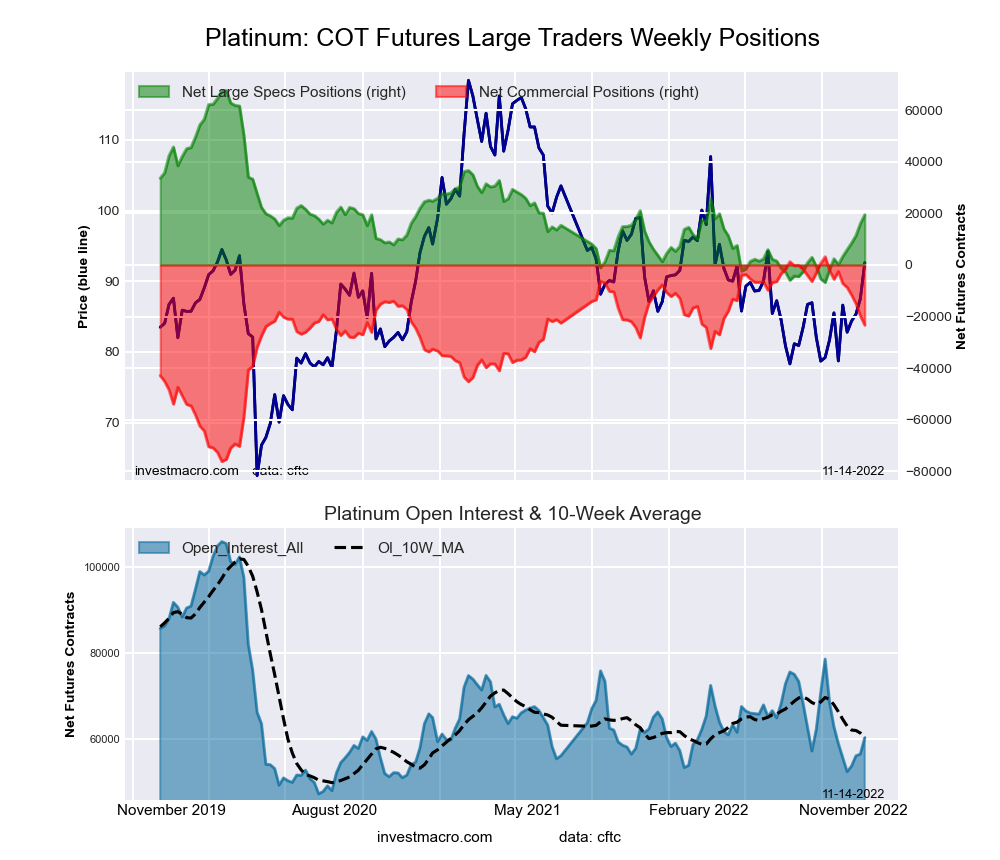
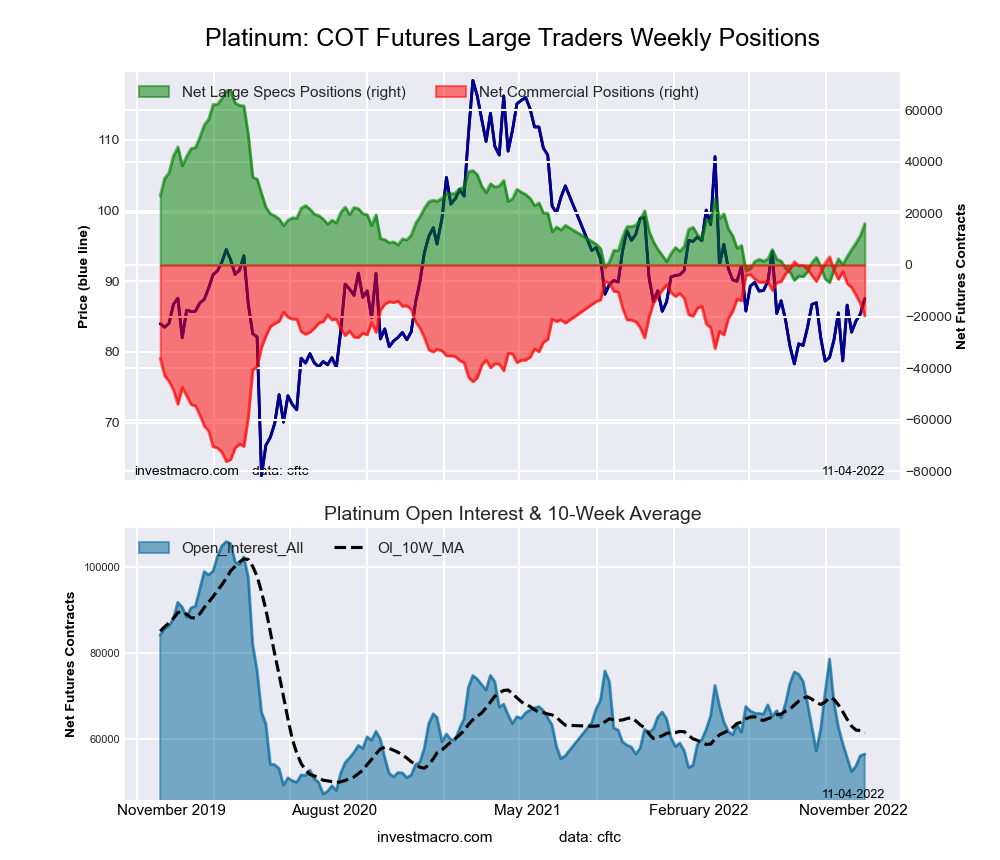
| Platinum | 63,391 | 27 | 22,544 | 39 | -27,037 | 62 | 4,493 | 28 |
| Natural Gas | 978,425 | 6 | -152,114 | 33 | 120,830 | 69 | 31,284 | 54 |
| Brent | 139,080 | 4 | -25,194 | 69 | 20,782 | 28 | 4,412 | 69 |
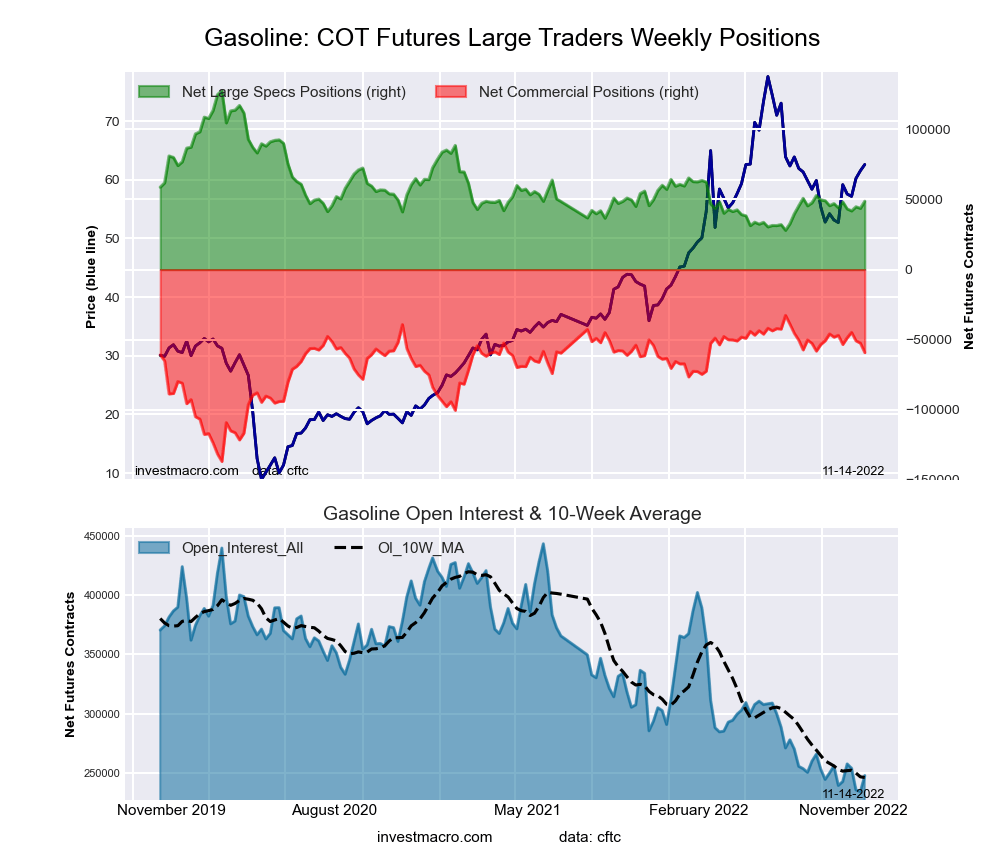
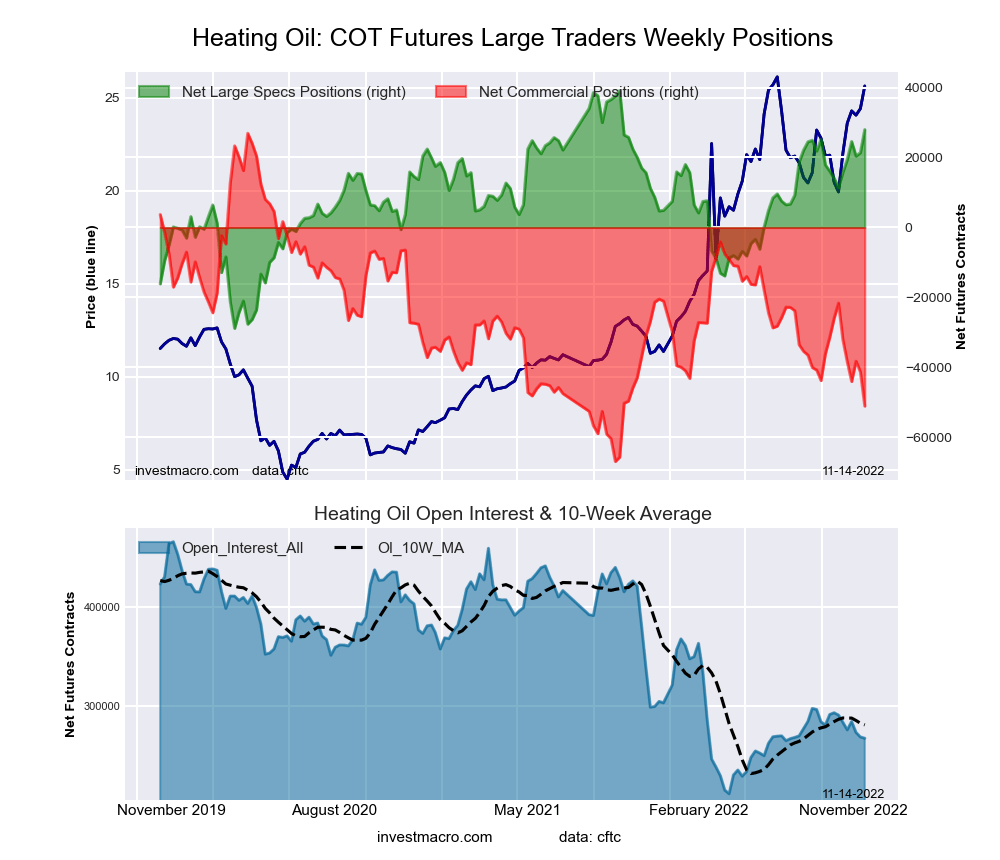
| Heating Oil | 275,254 | 26 | 25,660 | 80 | -46,933 | 21 | 21,273 | 72 |
| Soybeans | 616,094 | 9 | 76,804 | 37 | -49,046 | 72 | -27,758 | 24 |
| Corn | 1,421,555 | 22 | 252,908 | 62 | -211,862 | 42 | -41,046 | 19 |
| Coffee | 191,743 | 6 | -14,154 | 0 | 11,840 | 100 | 2,314 | 32 |
| Sugar | 832,522 | 26 | 156,194 | 59 | -201,779 | 39 | 45,585 | 64 |
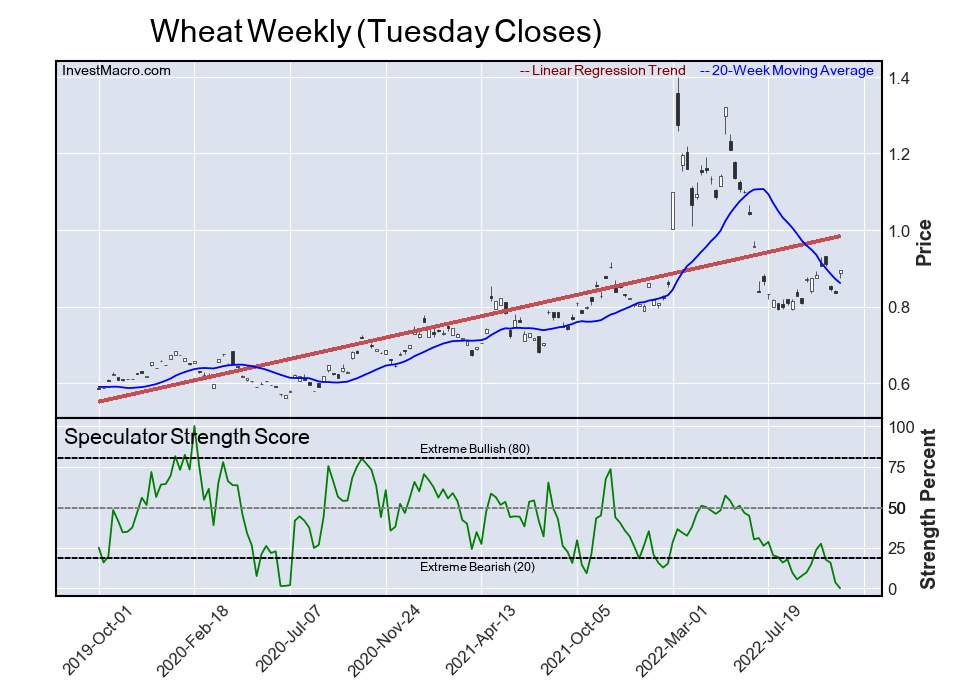
| Wheat | 350,091 | 27 | -22,481 | 0 | 29,310 | 100 | -6,829 | 75 |
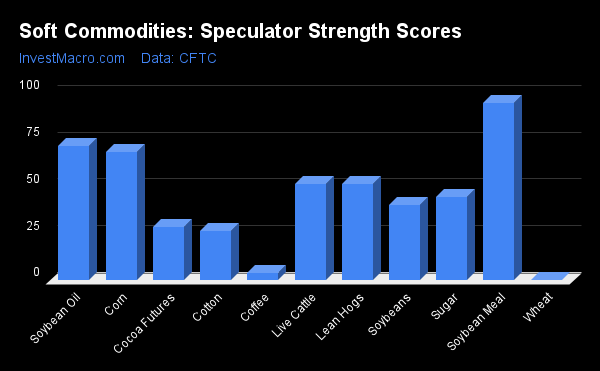
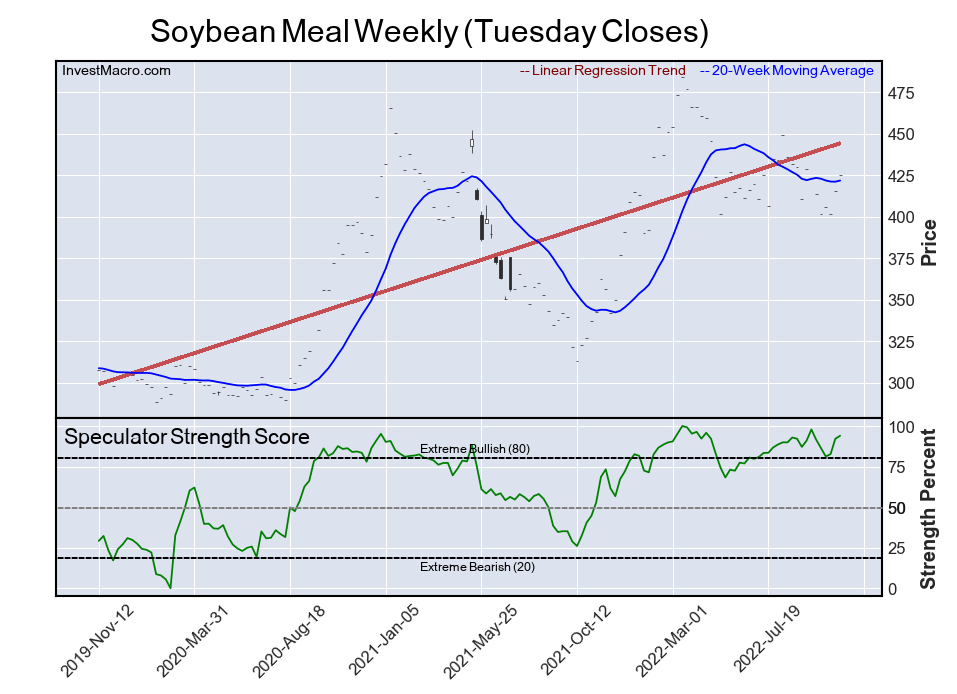
Soybean Meal & Soybean Oil lead the Strength Scores
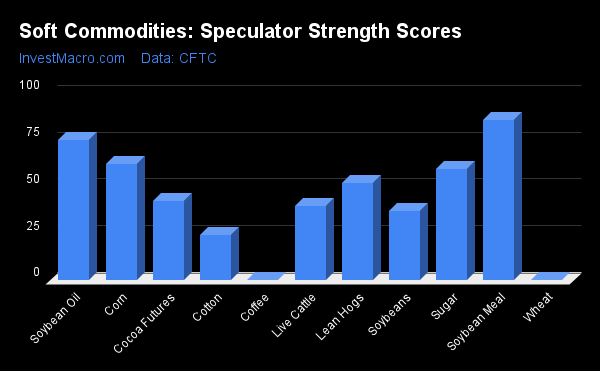
Strength Scores (a normalized measure of Speculator positions over a 3-Year range, from 0 to 100 where above 80 is extreme bullish and below 20 is extreme bearish) showed that Soybean Meal (85.8 percent) continues to lead the soft commodity markets and is in a bullish extreme position with a score above 80 percent. Soybean Oil (75.3 percent) comes in as the next highest soft commodity markets in strength scores followed by Corn (62.3 percent) and Sugar (59.4 percent).
On the downside, Coffee (0.0 percent) joins Wheat (0.0 percent) at the lowest strength levels currently and are both in bearish extreme positions (below 20 percent).
Strength Statistics:
Corn (62.3 percent) vs Corn previous week (68.6 percent)
Sugar (59.4 percent) vs Sugar previous week (41.7 percent)
Coffee (0.0 percent) vs Coffee previous week (11.2 percent)
Soybeans (37.0 percent) vs Soybeans previous week (40.3 percent)
Soybean Oil (75.3 percent) vs Soybean Oil previous week (71.7 percent)
Soybean Meal (85.8 percent) vs Soybean Meal previous week (95.0 percent)
Live Cattle (39.5 percent) vs Live Cattle previous week (51.4 percent)
Lean Hogs (52.2 percent) vs Lean Hogs previous week (51.3 percent)
Cotton (24.2 percent) vs Cotton previous week (24.4 percent)
Cocoa (42.4 percent) vs Cocoa previous week (28.7 percent)
Wheat (0.0 percent) vs Wheat previous week (6.2 percent)
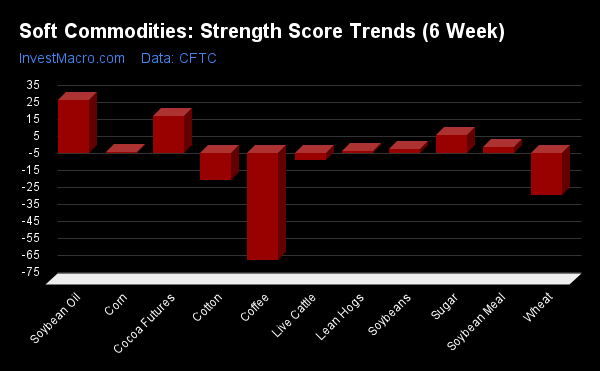
Strength Trends led by Soybean Oil, Sugar & Cocoa
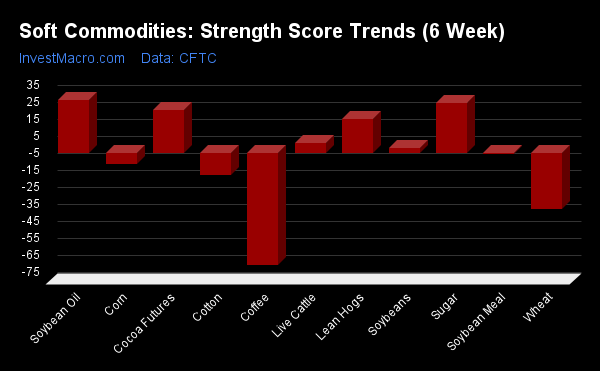
Strength Score Trends (or move index, calculates the 6-week changes in strength scores) show that Soybean Oil (31.1 percent) leads the past six weeks trends for soft commodity markets this week. Sugar (29.1 percent), Cocoa (25.4 percent) and Lean Hogs (19.8 percent) fill out the next top movers in the latest trends data.
Coffee (-66.3 percent) leads the downside trend scores currently while the next market with lower trend scores was Wheat (-33.2 percent) followed by Cotton (-13.0 percent).
Strength Trend Statistics:
Corn (-6.7 percent) vs Corn previous week (0.6 percent)
Sugar (29.1 percent) vs Sugar previous week (11.1 percent)
Coffee (-66.3 percent) vs Coffee previous week (-58.1 percent)
Soybeans (3.1 percent) vs Soybeans previous week (2.4 percent)
Soybean Oil (31.1 percent) vs Soybean Oil previous week (31.0 percent)
Soybean Meal (-0.7 percent) vs Soybean Meal previous week (3.4 percent)
Live Cattle (6.0 percent) vs Live Cattle previous week (-4.4 percent)
Lean Hogs (19.8 percent) vs Lean Hogs previous week (1.3 percent)
Cotton (-13.0 percent) vs Cotton previous week (-16.2 percent)
Cocoa (25.4 percent) vs Cocoa previous week (21.5 percent)
Wheat (-33.2 percent) vs Wheat previous week (-23.6 percent)
Individual Soft Commodities Markets:
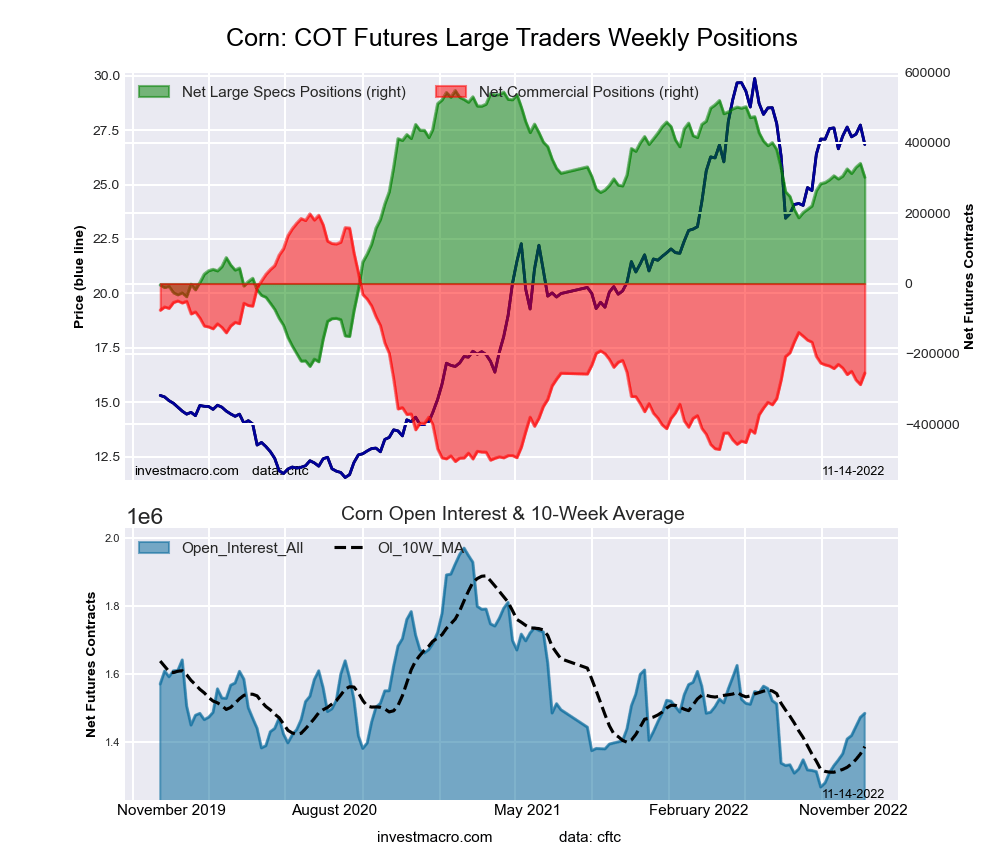
CORN Futures:
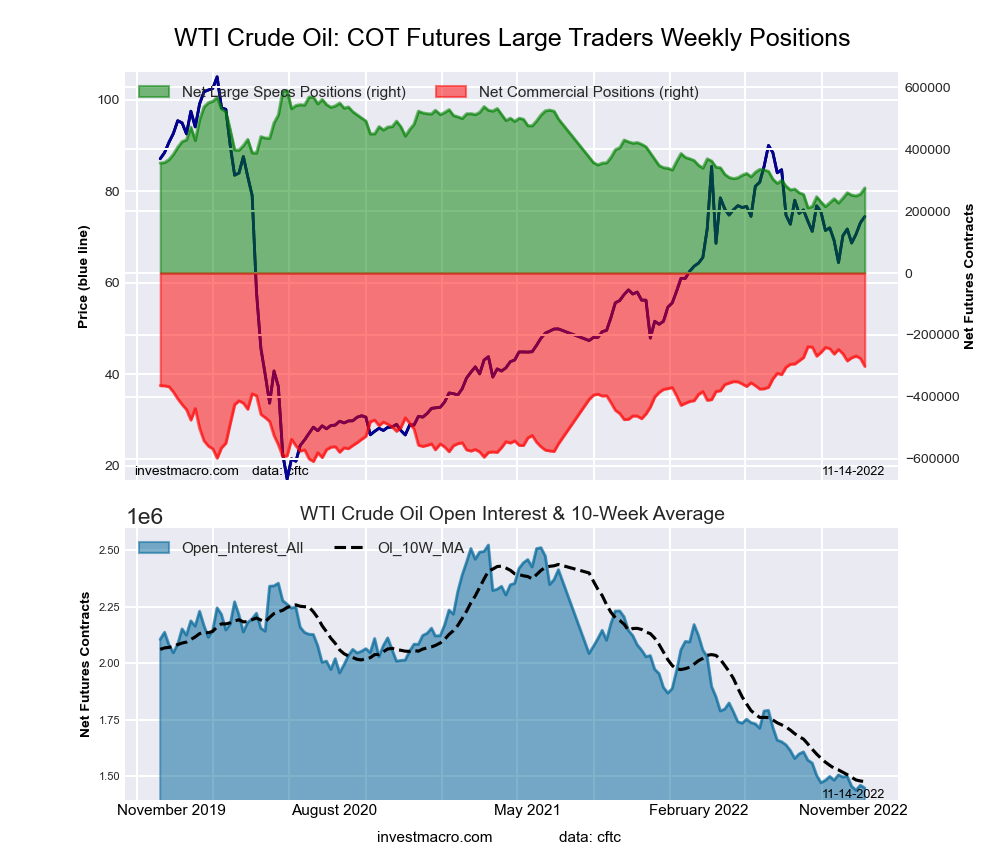
 The CORN large speculator standing this week came in at a net position of 252,908 contracts in the data reported through Tuesday. This was a weekly decline of -48,646 contracts from the previous week which had a total of 301,554 net contracts.
This week’s current strength score (the trader positioning range over the past three years, measured from 0 to 100) shows the speculators are currently Bullish with a score of 62.3 percent. The commercials are Bearish with a score of 41.7 percent and the small traders (not shown in chart) are Bearish-Extreme with a score of 19.5 percent.
| CORN Futures Statistics | SPECULATORS | COMMERCIALS | SMALL TRADERS |
| – Percent of Open Interest Longs: | 27.2 | 46.9 | 9.4 |
| – Percent of Open Interest Shorts: | 9.4 | 61.8 | 12.2 |
| – Net Position: | 252,908 | -211,862 | -41,046 |
| – Gross Longs: | 386,487 | 667,033 | 133,045 |
| – Gross Shorts: | 133,579 | 878,895 | 174,091 |
| – Long to Short Ratio: | 2.9 to 1 | 0.8 to 1 | 0.8 to 1 |
| NET POSITION TREND: | |||
| – Strength Index Score (3 Year Range Pct): | 62.3 | 41.7 | 19.5 |
| – Strength Index Reading (3 Year Range): | Bullish | Bearish | Bearish-Extreme |
| NET POSITION MOVEMENT INDEX: | |||
| – 6-Week Change in Strength Index: | -6.7 | 4.0 | 13.8 |
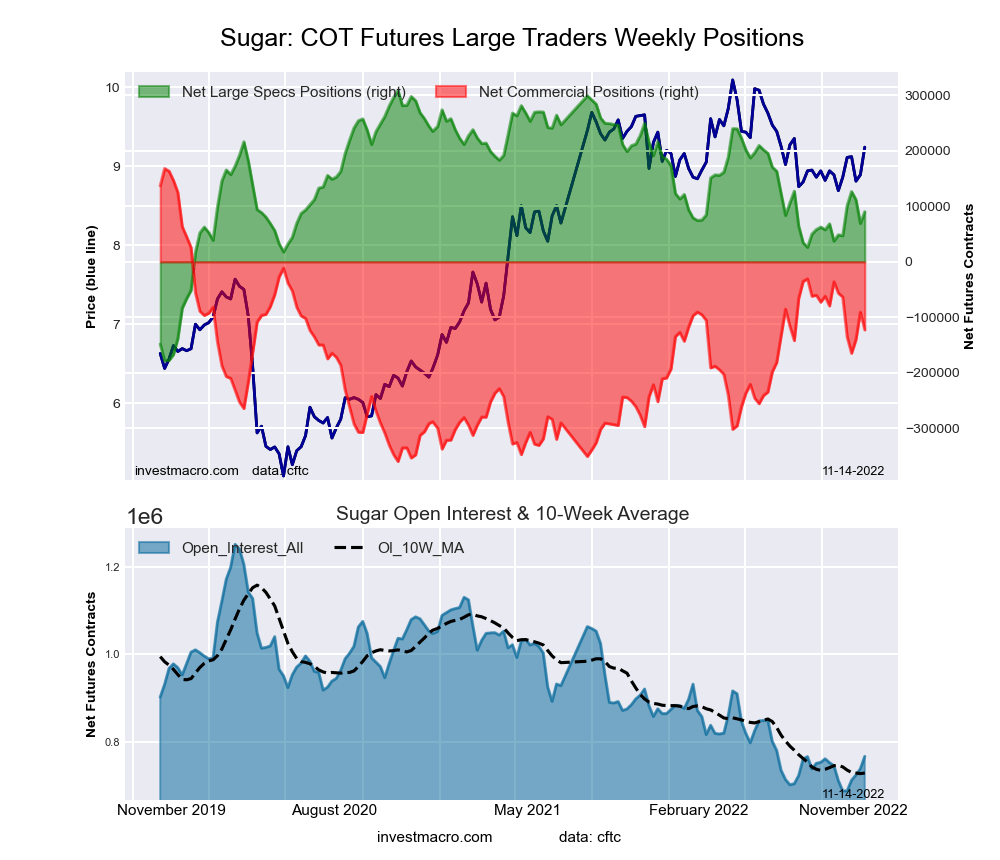
SUGAR Futures:
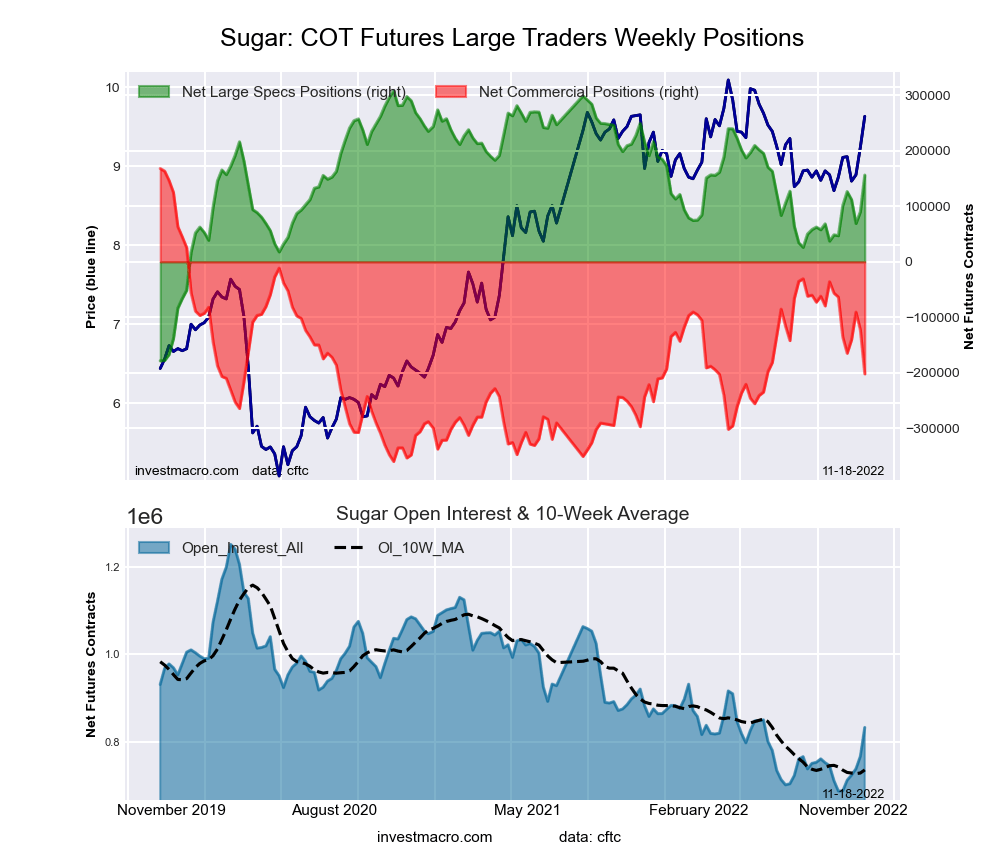 The SUGAR large speculator standing this week came in at a net position of 156,194 contracts in the data reported through Tuesday. This was a weekly rise of 66,012 contracts from the previous week which had a total of 90,182 net contracts.
This week’s current strength score (the trader positioning range over the past three years, measured from 0 to 100) shows the speculators are currently Bullish with a score of 59.4 percent. The commercials are Bearish with a score of 39.0 percent and the small traders (not shown in chart) are Bullish with a score of 64.2 percent.
| SUGAR Futures Statistics | SPECULATORS | COMMERCIALS | SMALL TRADERS |
| – Percent of Open Interest Longs: | 30.3 | 47.0 | 11.5 |
| – Percent of Open Interest Shorts: | 11.5 | 71.2 | 6.0 |
| – Net Position: | 156,194 | -201,779 | 45,585 |
| – Gross Longs: | 251,928 | 391,034 | 95,587 |
| – Gross Shorts: | 95,734 | 592,813 | 50,002 |
| – Long to Short Ratio: | 2.6 to 1 | 0.7 to 1 | 1.9 to 1 |
| NET POSITION TREND: | |||
| – Strength Index Score (3 Year Range Pct): | 59.4 | 39.0 | 64.2 |
| – Strength Index Reading (3 Year Range): | Bullish | Bearish | Bullish |
| NET POSITION MOVEMENT INDEX: | |||
| – 6-Week Change in Strength Index: | 29.1 | -34.2 | 36.2 |
COFFEE Futures:
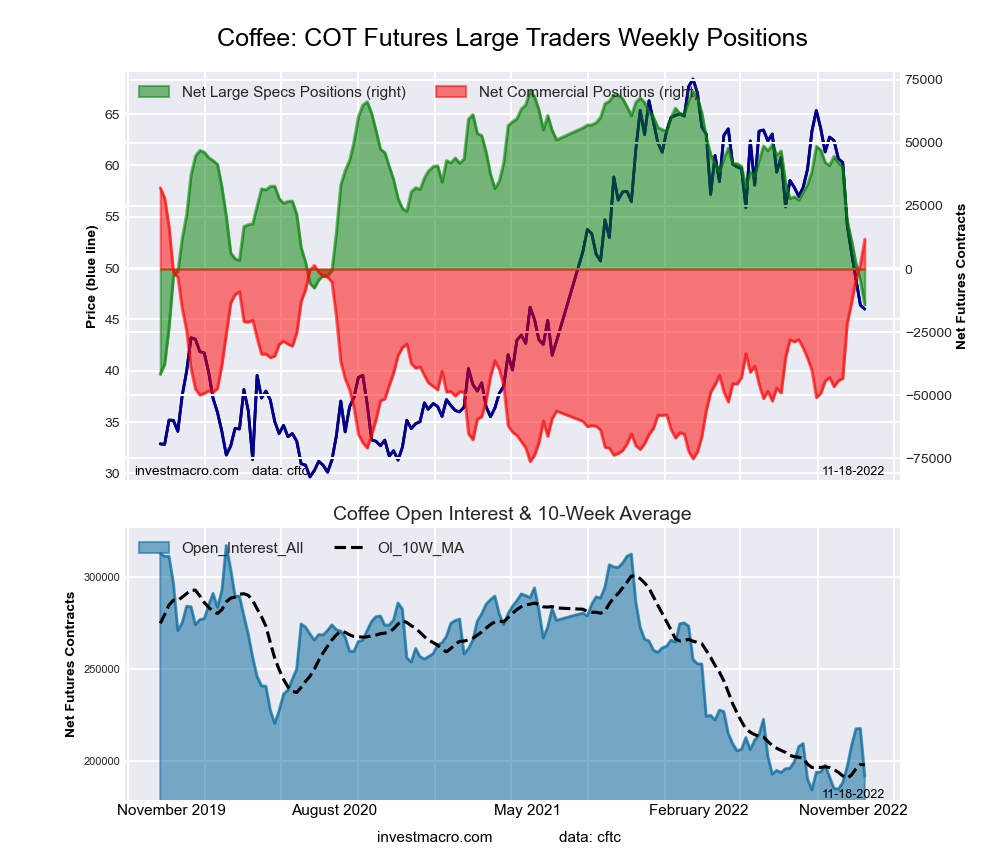 The COFFEE large speculator standing this week came in at a net position of -14,154 contracts in the data reported through Tuesday. This was a weekly decline of -9,471 contracts from the previous week which had a total of -4,683 net contracts.
This week’s current strength score (the trader positioning range over the past three years, measured from 0 to 100) shows the speculators are currently Bearish-Extreme with a score of 0.0 percent. The commercials are Bullish-Extreme with a score of 100.0 percent and the small traders (not shown in chart) are Bearish with a score of 31.6 percent.
| COFFEE Futures Statistics | SPECULATORS | COMMERCIALS | SMALL TRADERS |
| – Percent of Open Interest Longs: | 19.5 | 54.0 | 5.3 |
| – Percent of Open Interest Shorts: | 26.9 | 47.8 | 4.1 |
| – Net Position: | -14,154 | 11,840 | 2,314 |
| – Gross Longs: | 37,332 | 103,544 | 10,167 |
| – Gross Shorts: | 51,486 | 91,704 | 7,853 |
| – Long to Short Ratio: | 0.7 to 1 | 1.1 to 1 | 1.3 to 1 |
| NET POSITION TREND: | |||
| – Strength Index Score (3 Year Range Pct): | 0.0 | 100.0 | 31.6 |
| – Strength Index Reading (3 Year Range): | Bearish-Extreme | Bullish-Extreme | Bearish |
| NET POSITION MOVEMENT INDEX: | |||
| – 6-Week Change in Strength Index: | -66.3 | 63.6 | 2.8 |
SOYBEANS Futures:
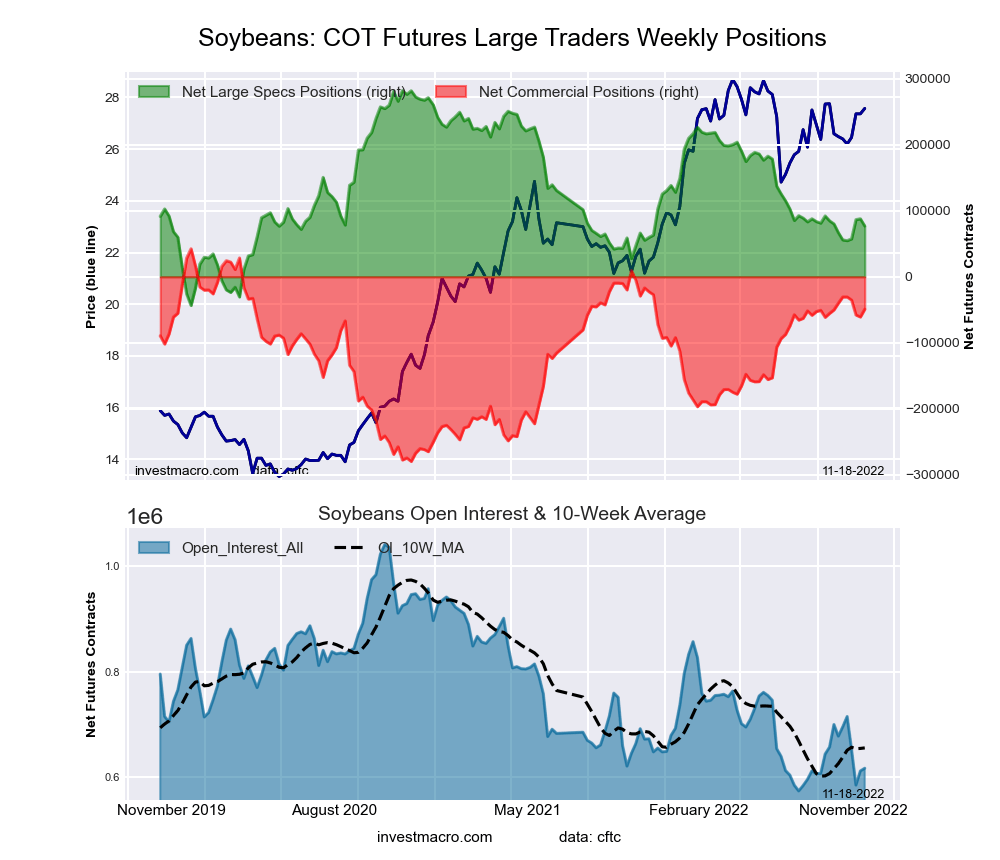 The SOYBEANS large speculator standing this week came in at a net position of 76,804 contracts in the data reported through Tuesday. This was a weekly reduction of -11,005 contracts from the previous week which had a total of 87,809 net contracts.
This week’s current strength score (the trader positioning range over the past three years, measured from 0 to 100) shows the speculators are currently Bearish with a score of 37.0 percent. The commercials are Bullish with a score of 71.6 percent and the small traders (not shown in chart) are Bearish with a score of 24.1 percent.
| SOYBEANS Futures Statistics | SPECULATORS | COMMERCIALS | SMALL TRADERS |
| – Percent of Open Interest Longs: | 23.2 | 52.8 | 7.6 |
| – Percent of Open Interest Shorts: | 10.8 | 60.7 | 12.1 |
| – Net Position: | 76,804 | -49,046 | -27,758 |
| – Gross Longs: | 143,181 | 325,093 | 46,855 |
| – Gross Shorts: | 66,377 | 374,139 | 74,613 |
| – Long to Short Ratio: | 2.2 to 1 | 0.9 to 1 | 0.6 to 1 |
| NET POSITION TREND: | |||
| – Strength Index Score (3 Year Range Pct): | 37.0 | 71.6 | 24.1 |
| – Strength Index Reading (3 Year Range): | Bearish | Bullish | Bearish |
| NET POSITION MOVEMENT INDEX: | |||
| – 6-Week Change in Strength Index: | 3.1 | -2.8 | -1.8 |
SOYBEAN OIL Futures:
 The SOYBEAN OIL large speculator standing this week came in at a net position of 105,263 contracts in the data reported through Tuesday. This was a weekly boost of 5,282 contracts from the previous week which had a total of 99,981 net contracts.
This week’s current strength score (the trader positioning range over the past three years, measured from 0 to 100) shows the speculators are currently Bullish with a score of 75.3 percent. The commercials are Bearish with a score of 24.3 percent and the small traders (not shown in chart) are Bullish with a score of 71.3 percent.
| SOYBEAN OIL Futures Statistics | SPECULATORS | COMMERCIALS | SMALL TRADERS |
| – Percent of Open Interest Longs: | 30.0 | 42.8 | 8.9 |
| – Percent of Open Interest Shorts: | 7.3 | 68.8 | 5.6 |
| – Net Position: | 105,263 | -120,768 | 15,505 |
| – Gross Longs: | 138,838 | 198,013 | 41,274 |
| – Gross Shorts: | 33,575 | 318,781 | 25,769 |
| – Long to Short Ratio: | 4.1 to 1 | 0.6 to 1 | 1.6 to 1 |
| NET POSITION TREND: | |||
| – Strength Index Score (3 Year Range Pct): | 75.3 | 24.3 | 71.3 |
| – Strength Index Reading (3 Year Range): | Bullish | Bearish | Bullish |
| NET POSITION MOVEMENT INDEX: | |||
| – 6-Week Change in Strength Index: | 31.1 | -33.2 | 28.7 |
SOYBEAN MEAL Futures:
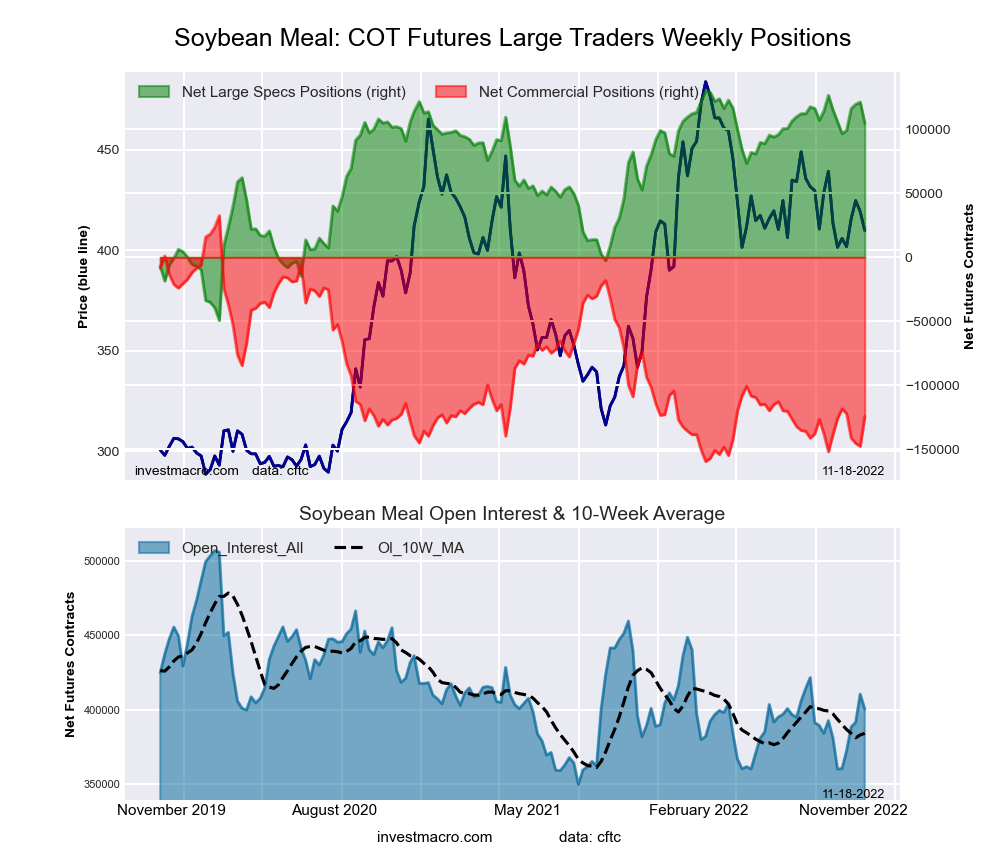 The SOYBEAN MEAL large speculator standing this week came in at a net position of 104,749 contracts in the data reported through Tuesday. This was a weekly reduction of -16,485 contracts from the previous week which had a total of 121,234 net contracts.
This week’s current strength score (the trader positioning range over the past three years, measured from 0 to 100) shows the speculators are currently Bullish-Extreme with a score of 85.8 percent. The commercials are Bearish-Extreme with a score of 18.3 percent and the small traders (not shown in chart) are Bearish with a score of 34.2 percent.
| SOYBEAN MEAL Futures Statistics | SPECULATORS | COMMERCIALS | SMALL TRADERS |
| – Percent of Open Interest Longs: | 31.3 | 41.8 | 11.7 |
| – Percent of Open Interest Shorts: | 5.1 | 72.9 | 6.8 |
| – Net Position: | 104,749 | -124,282 | 19,533 |
| – Gross Longs: | 125,175 | 167,387 | 46,718 |
| – Gross Shorts: | 20,426 | 291,669 | 27,185 |
| – Long to Short Ratio: | 6.1 to 1 | 0.6 to 1 | 1.7 to 1 |
| NET POSITION TREND: | |||
| – Strength Index Score (3 Year Range Pct): | 85.8 | 18.3 | 34.2 |
| – Strength Index Reading (3 Year Range): | Bullish-Extreme | Bearish-Extreme | Bearish |
| NET POSITION MOVEMENT INDEX: | |||
| – 6-Week Change in Strength Index: | -0.7 | 0.9 | -2.6 |
LIVE CATTLE Futures:
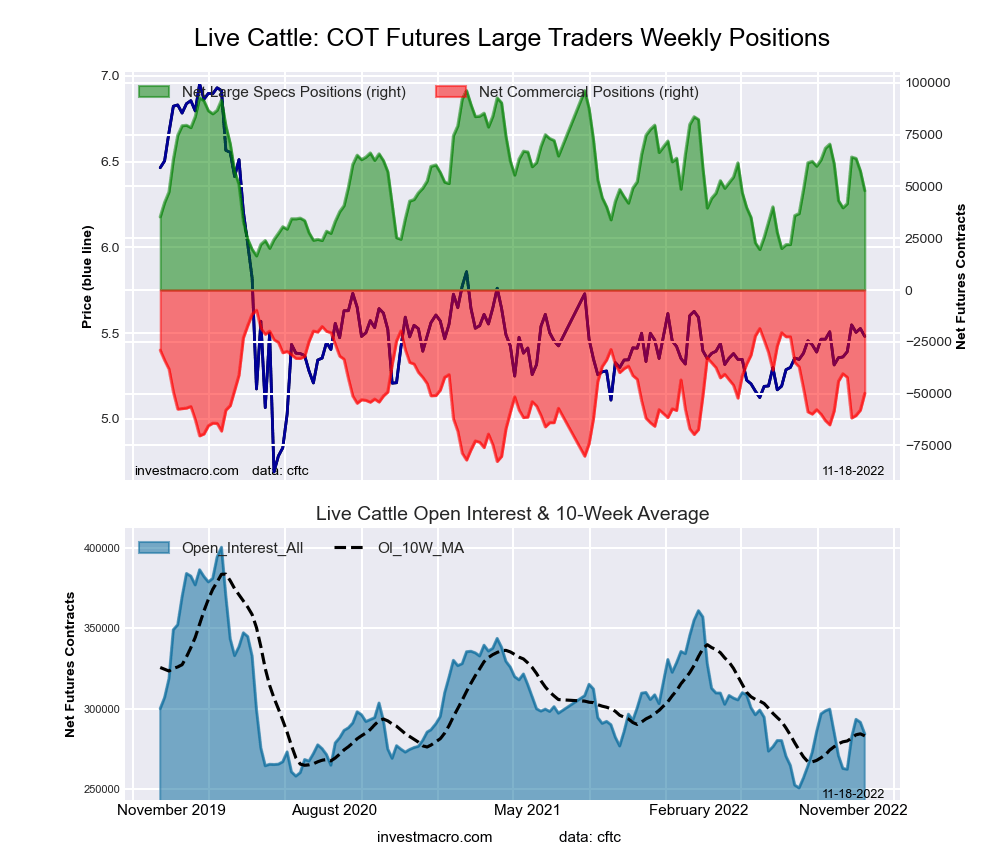 The LIVE CATTLE large speculator standing this week came in at a net position of 47,916 contracts in the data reported through Tuesday. This was a weekly decrease of -9,513 contracts from the previous week which had a total of 57,429 net contracts.
This week’s current strength score (the trader positioning range over the past three years, measured from 0 to 100) shows the speculators are currently Bearish with a score of 39.5 percent. The commercials are Bearish with a score of 45.0 percent and the small traders (not shown in chart) are Bullish-Extreme with a score of 100.0 percent.
| LIVE CATTLE Futures Statistics | SPECULATORS | COMMERCIALS | SMALL TRADERS |
| – Percent of Open Interest Longs: | 34.6 | 34.5 | 12.4 |
| – Percent of Open Interest Shorts: | 17.7 | 52.0 | 11.7 |
| – Net Position: | 47,916 | -49,845 | 1,929 |
| – Gross Longs: | 98,274 | 98,081 | 35,307 |
| – Gross Shorts: | 50,358 | 147,926 | 33,378 |
| – Long to Short Ratio: | 2.0 to 1 | 0.7 to 1 | 1.1 to 1 |
| NET POSITION TREND: | |||
| – Strength Index Score (3 Year Range Pct): | 39.5 | 45.0 | 100.0 |
| – Strength Index Reading (3 Year Range): | Bearish | Bearish | Bullish-Extreme |
| NET POSITION MOVEMENT INDEX: | |||
| – 6-Week Change in Strength Index: | 6.0 | -8.1 | 4.3 |
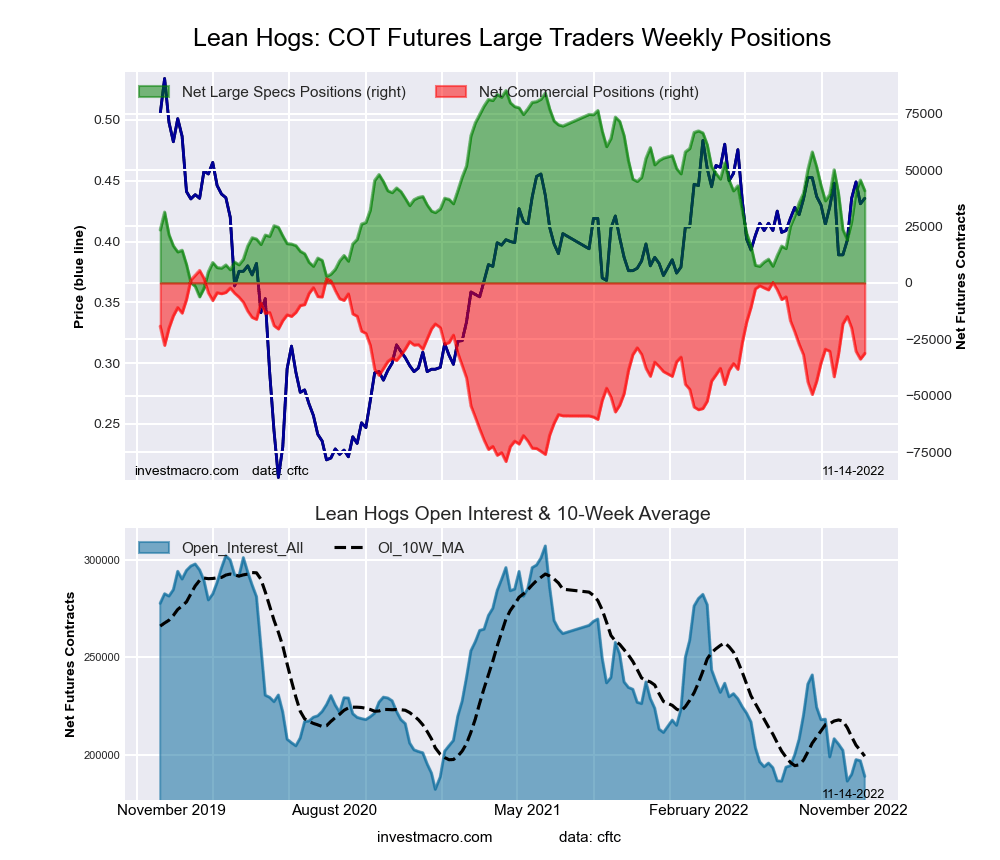
LEAN HOGS Futures:
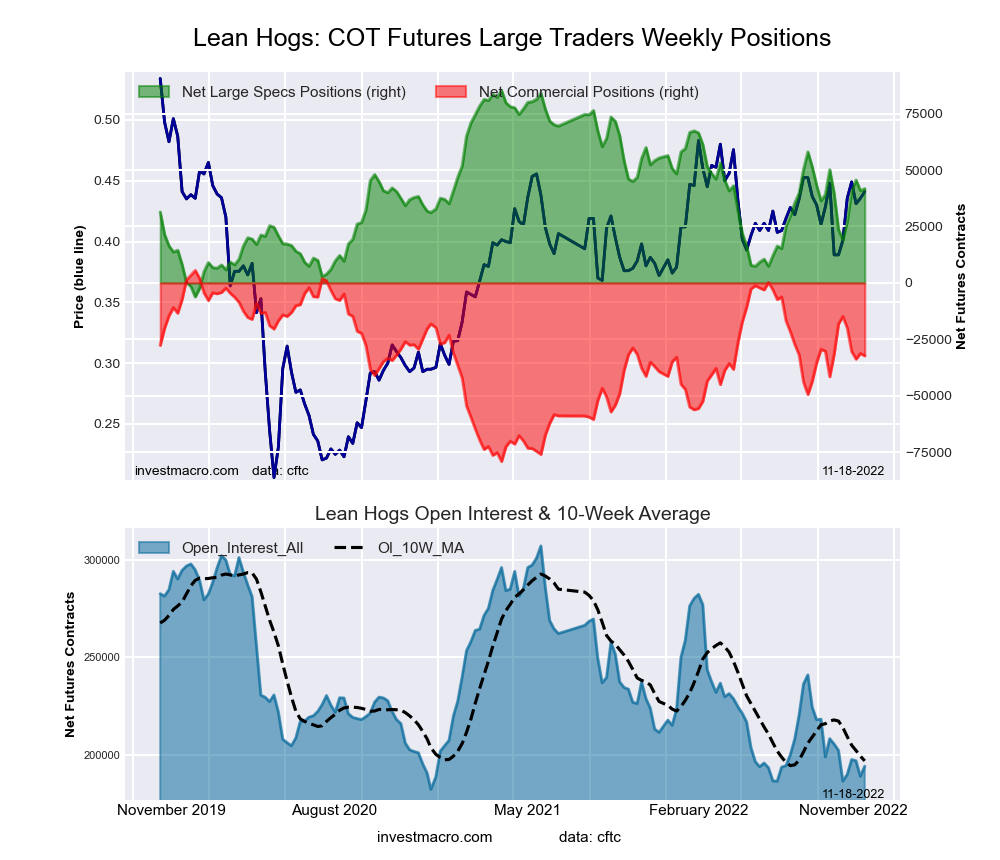 The LEAN HOGS large speculator standing this week came in at a net position of 41,759 contracts in the data reported through Tuesday. This was a weekly rise of 897 contracts from the previous week which had a total of 40,862 net contracts.
This week’s current strength score (the trader positioning range over the past three years, measured from 0 to 100) shows the speculators are currently Bullish with a score of 52.2 percent. The commercials are Bullish with a score of 55.3 percent and the small traders (not shown in chart) are Bearish with a score of 47.4 percent.
| LEAN HOGS Futures Statistics | SPECULATORS | COMMERCIALS | SMALL TRADERS |
| – Percent of Open Interest Longs: | 40.1 | 34.8 | 9.0 |
| – Percent of Open Interest Shorts: | 18.6 | 51.4 | 13.9 |
| – Net Position: | 41,759 | -32,298 | -9,461 |
| – Gross Longs: | 77,835 | 67,502 | 17,551 |
| – Gross Shorts: | 36,076 | 99,800 | 27,012 |
| – Long to Short Ratio: | 2.2 to 1 | 0.7 to 1 | 0.6 to 1 |
| NET POSITION TREND: | |||
| – Strength Index Score (3 Year Range Pct): | 52.2 | 55.3 | 47.4 |
| – Strength Index Reading (3 Year Range): | Bullish | Bullish | Bearish |
| NET POSITION MOVEMENT INDEX: | |||
| – 6-Week Change in Strength Index: | 19.8 | -16.7 | -20.9 |
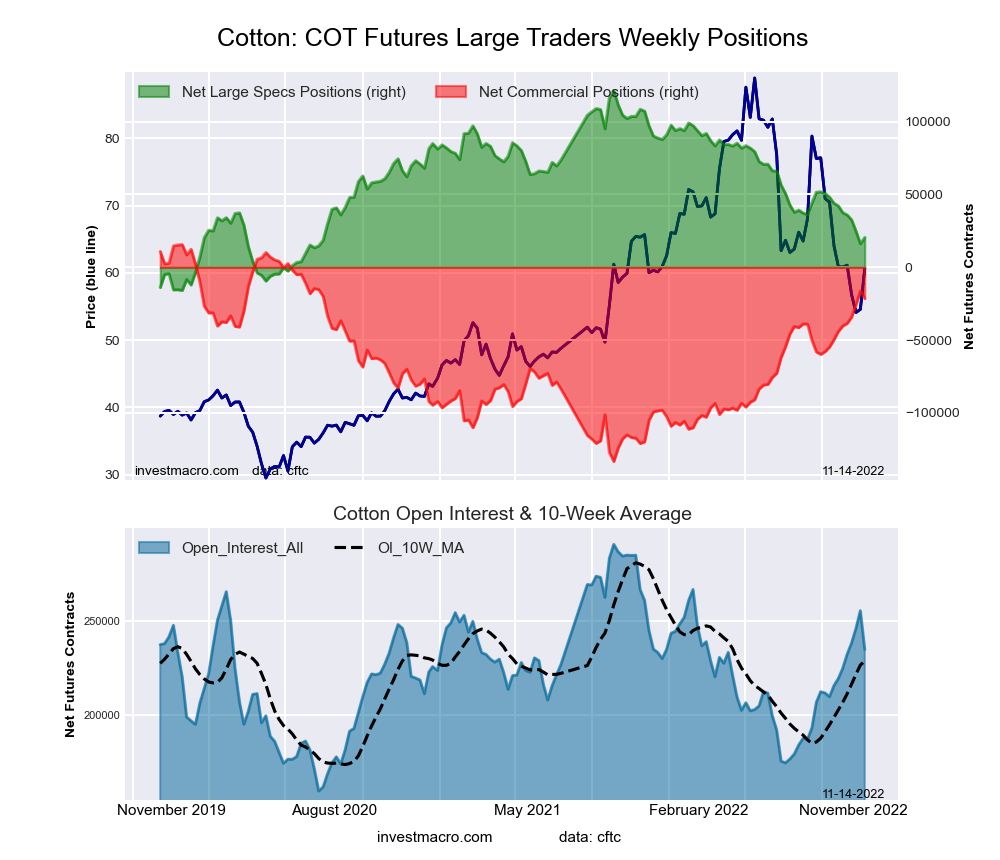
COTTON Futures:
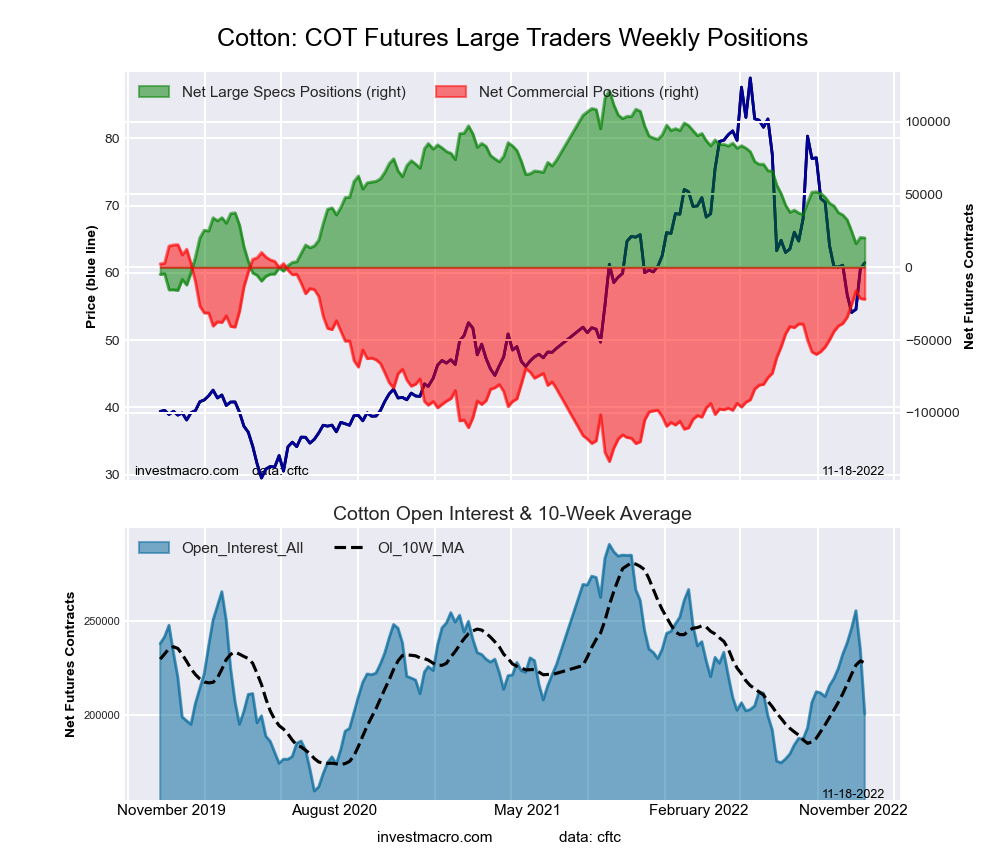 The COTTON large speculator standing this week came in at a net position of 20,113 contracts in the data reported through Tuesday. This was a weekly decline of -364 contracts from the previous week which had a total of 20,477 net contracts.
This week’s current strength score (the trader positioning range over the past three years, measured from 0 to 100) shows the speculators are currently Bearish with a score of 24.2 percent. The commercials are Bullish with a score of 76.5 percent and the small traders (not shown in chart) are Bearish with a score of 21.9 percent.
| COTTON Futures Statistics | SPECULATORS | COMMERCIALS | SMALL TRADERS |
| – Percent of Open Interest Longs: | 33.1 | 47.2 | 6.9 |
| – Percent of Open Interest Shorts: | 23.1 | 58.1 | 6.0 |
| – Net Position: | 20,113 | -21,900 | 1,787 |
| – Gross Longs: | 66,427 | 94,503 | 13,814 |
| – Gross Shorts: | 46,314 | 116,403 | 12,027 |
| – Long to Short Ratio: | 1.4 to 1 | 0.8 to 1 | 1.1 to 1 |
| NET POSITION TREND: | |||
| – Strength Index Score (3 Year Range Pct): | 24.2 | 76.5 | 21.9 |
| – Strength Index Reading (3 Year Range): | Bearish | Bullish | Bearish |
| NET POSITION MOVEMENT INDEX: | |||
| – 6-Week Change in Strength Index: | -13.0 | 12.6 | -6.5 |
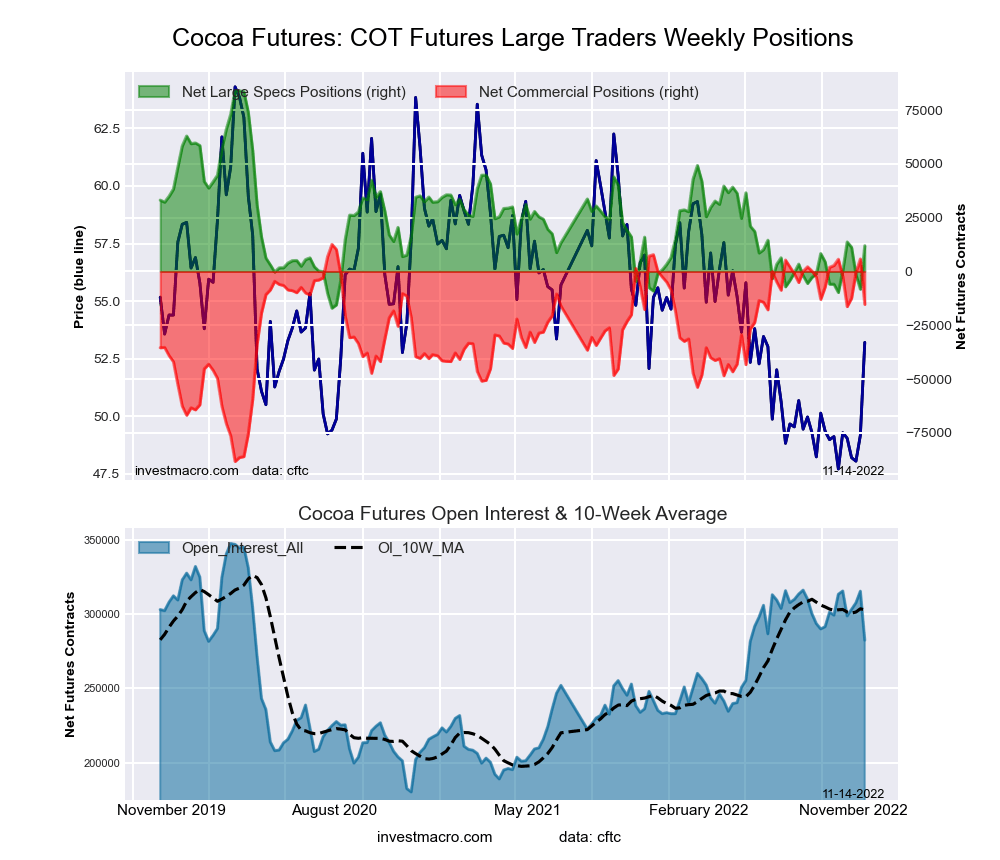
COCOA Futures:
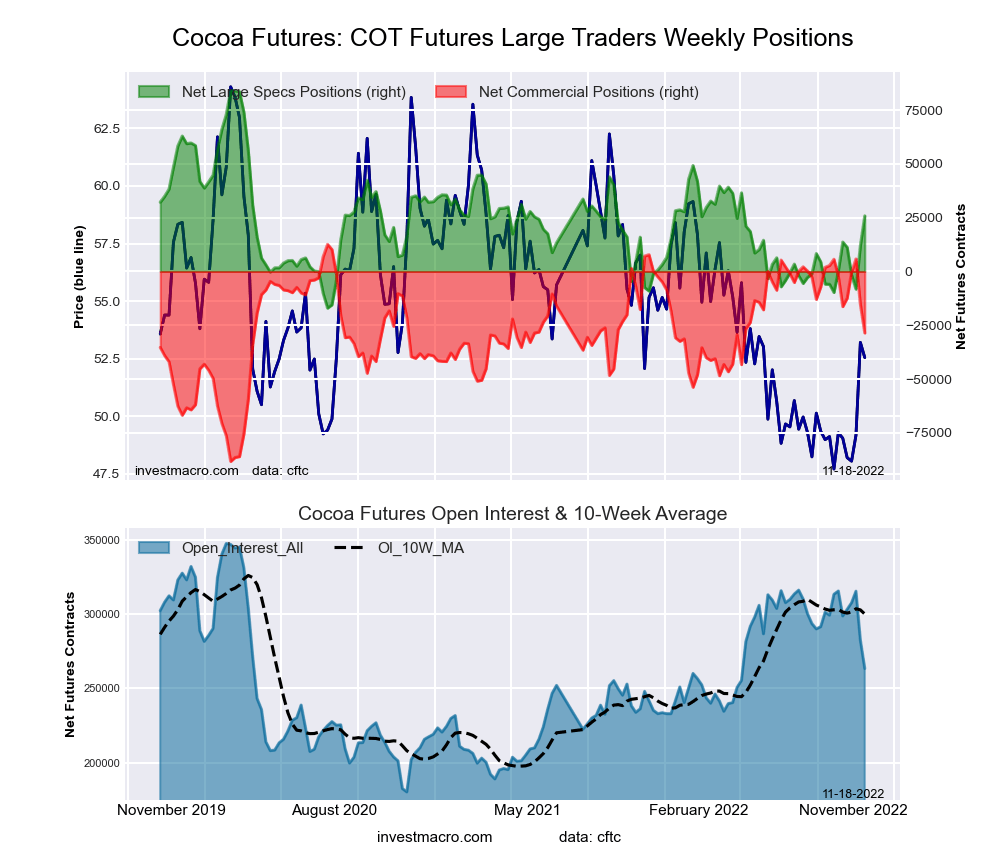 The COCOA large speculator standing this week came in at a net position of 25,843 contracts in the data reported through Tuesday. This was a weekly advance of 13,895 contracts from the previous week which had a total of 11,948 net contracts.
This week’s current strength score (the trader positioning range over the past three years, measured from 0 to 100) shows the speculators are currently Bearish with a score of 42.4 percent. The commercials are Bullish with a score of 59.2 percent and the small traders (not shown in chart) are Bearish with a score of 24.1 percent.
| COCOA Futures Statistics | SPECULATORS | COMMERCIALS | SMALL TRADERS |
| – Percent of Open Interest Longs: | 32.3 | 45.9 | 4.5 |
| – Percent of Open Interest Shorts: | 22.5 | 56.8 | 3.4 |
| – Net Position: | 25,843 | -28,597 | 2,754 |
| – Gross Longs: | 85,052 | 120,925 | 11,816 |
| – Gross Shorts: | 59,209 | 149,522 | 9,062 |
| – Long to Short Ratio: | 1.4 to 1 | 0.8 to 1 | 1.3 to 1 |
| NET POSITION TREND: | |||
| – Strength Index Score (3 Year Range Pct): | 42.4 | 59.2 | 24.1 |
| – Strength Index Reading (3 Year Range): | Bearish | Bullish | Bearish |
| NET POSITION MOVEMENT INDEX: | |||
| – 6-Week Change in Strength Index: | 25.4 | -26.2 | 7.1 |
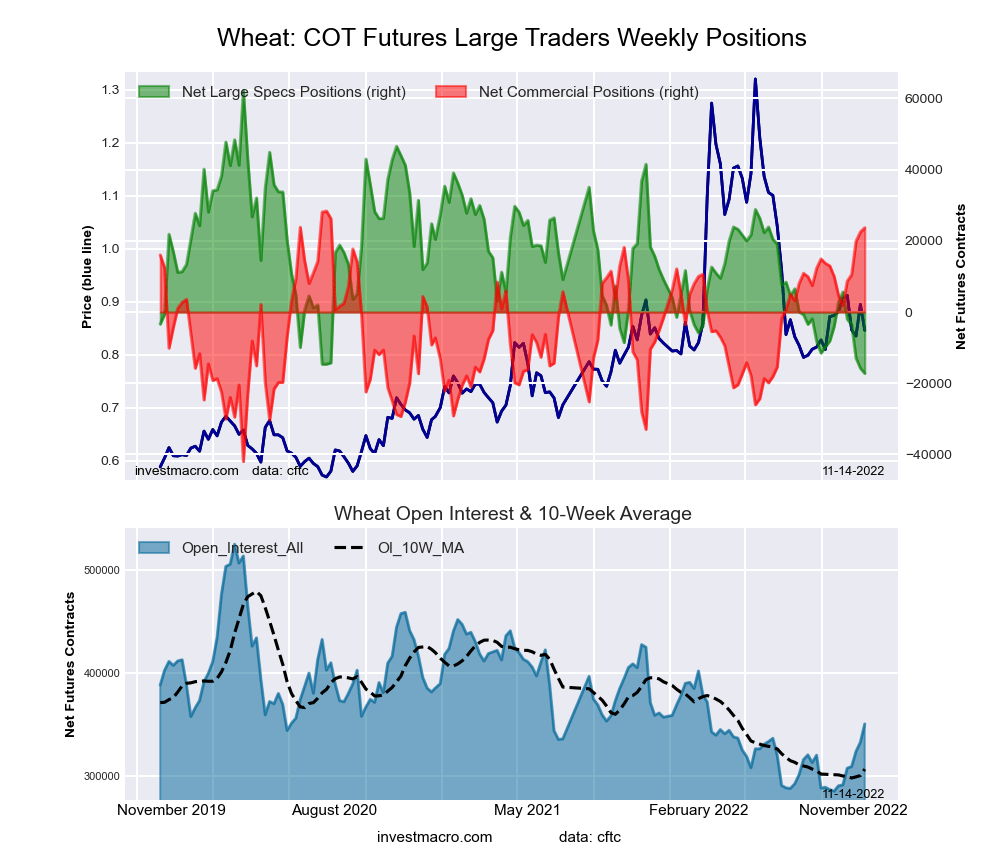
WHEAT Futures:
 The WHEAT large speculator standing this week came in at a net position of -22,481 contracts in the data reported through Tuesday. This was a weekly decline of -5,267 contracts from the previous week which had a total of -17,214 net contracts.
This week’s current strength score (the trader positioning range over the past three years, measured from 0 to 100) shows the speculators are currently Bearish-Extreme with a score of 0.0 percent. The commercials are Bullish-Extreme with a score of 100.0 percent and the small traders (not shown in chart) are Bullish with a score of 75.0 percent.
| WHEAT Futures Statistics | SPECULATORS | COMMERCIALS | SMALL TRADERS |
| – Percent of Open Interest Longs: | 25.8 | 39.6 | 9.4 |
| – Percent of Open Interest Shorts: | 32.2 | 31.2 | 11.3 |
| – Net Position: | -22,481 | 29,310 | -6,829 |
| – Gross Longs: | 90,194 | 138,565 | 32,837 |
| – Gross Shorts: | 112,675 | 109,255 | 39,666 |
| – Long to Short Ratio: | 0.8 to 1 | 1.3 to 1 | 0.8 to 1 |
| NET POSITION TREND: | |||
| – Strength Index Score (3 Year Range Pct): | 0.0 | 100.0 | 75.0 |
| – Strength Index Reading (3 Year Range): | Bearish-Extreme | Bullish-Extreme | Bullish |
| NET POSITION MOVEMENT INDEX: | |||
| – 6-Week Change in Strength Index: | -33.2 | 38.5 | 3.6 |
Article By InvestMacro – Receive our weekly COT Newsletter
*COT Report: The COT data, released weekly to the public each Friday, is updated through the most recent Tuesday (data is 3 days old) and shows a quick view of how large speculators or non-commercials (for-profit traders) were positioned in the futures markets.
The CFTC categorizes trader positions according to commercial hedgers (traders who use futures contracts for hedging as part of the business), non-commercials (large traders who speculate to realize trading profits) and nonreportable traders (usually small traders/speculators) as well as their open interest (contracts open in the market at time of reporting). See CFTC criteria here.


