By InvestMacro
Here are the latest charts and statistics for the Commitment of Traders (COT) data published by the Commodities Futures Trading Commission (CFTC).
The latest COT data is updated through Tuesday November 1st and shows a quick view of how large traders (for-profit speculators and commercial entities) were positioned in the futures markets.
Copper & Platinum lead Weekly Speculator Changes
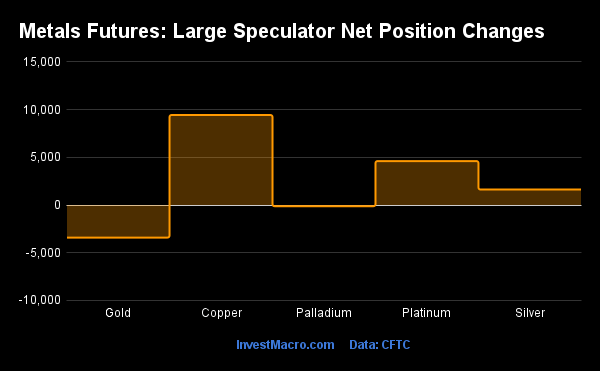
The COT precious metals speculator bets were slightly higher this week as three out of the five metals markets we cover had higher positioning this week while two markets had lower contracts.
Free Reports:
 Sign Up for Our Stock Market Newsletter – Get updated on News, Charts & Rankings of Public Companies when you join our Stocks Newsletter
 Get our Weekly Commitment of Traders Reports - See where the biggest traders (Hedge Funds and Commercial Hedgers) are positioned in the futures markets on a weekly basis.
Leading the gains for the precious metals markets was Copper (9,435 contracts) with Platinum (4,606 contracts) and Silver (1,625 contracts) also showing a positive week.
The metals markets leading the declines in speculator bets this week was Gold (-3,409 contracts) with Palladium (-122 contracts) also registering lower bets on the week.
Highlighting the COT metals data this week is the improvement in the Copper speculators positioning over the past few months. The large speculators raised their Copper bets for the second straight week this week and for the fourth time out of the past five weeks. Copper spec positions have been in an overall bearish standing since April (currently in a 28-week streak of bearish contracts) with the lowest level of -31,796 contracts coming in July. However, the bearish bets have been lightening up of late and this week’s total of -7,484 contracts marks the least bearish level of the past twenty-one weeks, dating back to June 7th.
Copper prices were sharply on the rise this week as well with gains for the week climbing by over 7.50 percent. Helping Copper prices go higher this week were the rumors that China will potentially ease their COVID-related restrictions as well as some supply issues out of South America.
| Nov-01-2022 | OI | OI-Index | Spec-Net | Spec-Index | Com-Net | COM-Index | Smalls-Net | Smalls-Index |
|---|---|---|---|---|---|---|---|---|
| WTI Crude | 1,459,052 | 2 | 254,809 | 12 | -275,761 | 90 | 20,952 | 35 |
| Gold | 467,276 | 10 | 64,623 | 4 | -74,782 | 96 | 10,159 | 5 |
| Silver | 138,875 | 12 | 1,524 | 16 | -10,363 | 85 | 8,839 | 13 |
| Copper | 179,801 | 18 | -7,484 | 30 | 7,998 | 73 | -514 | 22 |
| Palladium | 8,372 | 12 | -1,867 | 13 | 2,221 | 87 | -354 | 20 |
| Platinum | 56,534 | 16 | 15,987 | 31 | -19,690 | 71 | 3,703 | 18 |
| Natural Gas | 986,116 | 7 | -148,653 | 34 | 127,501 | 71 | 21,152 | 30 |
| Brent | 134,010 | 0 | -21,908 | 74 | 17,423 | 22 | 4,485 | 70 |
| Heating Oil | 268,025 | 23 | 21,380 | 74 | -41,295 | 27 | 19,915 | 67 |
| Soybeans | 584,073 | 2 | 86,522 | 40 | -57,886 | 69 | -28,636 | 23 |
| Corn | 1,472,517 | 29 | 340,788 | 74 | -286,790 | 31 | -53,998 | 12 |
| Coffee | 217,400 | 25 | 2,183 | 12 | -4,162 | 93 | 1,979 | 27 |
| Sugar | 737,846 | 9 | 69,093 | 46 | -90,576 | 56 | 21,483 | 34 |
| Wheat | 333,061 | 20 | -15,766 | 0 | 22,493 | 92 | -6,727 | 75 |
Strength Scores led by Copper & Platinum
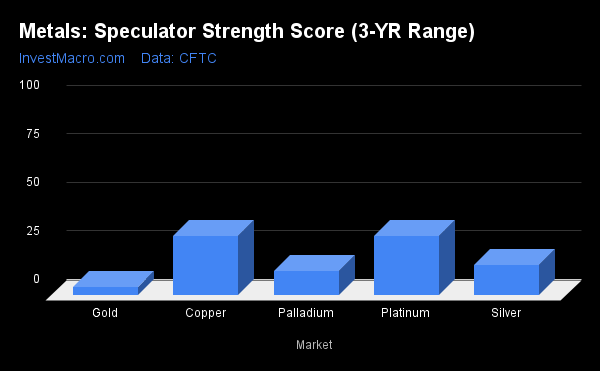
Strength scores (a measure of the 3-Year range of Speculator positions, from 0 to 100 where above 80 is extreme bullish and below 20 is extreme bearish) showed that Platinum (30.6 percent) and Copper (30.4 percent) lead the metals category.
On the downside, Gold (4.2 percent) continues to be at the lowest strength level currently and is followed by Palladium (12.8 percent) and Silver (15.8 percent). All three of these markets remain in a bearish extreme position with scores below 20 percent.
Strength Statistics:
Gold (4.2 percent) vs Gold previous week (5.3 percent)
Silver (15.8 percent) vs Silver previous week (14.0 percent)
Copper (30.4 percent) vs Copper previous week (22.9 percent)
Platinum (30.6 percent) vs Platinum previous week (24.4 percent)
Palladium (12.8 percent) vs Palladium previous week (13.6 percent)
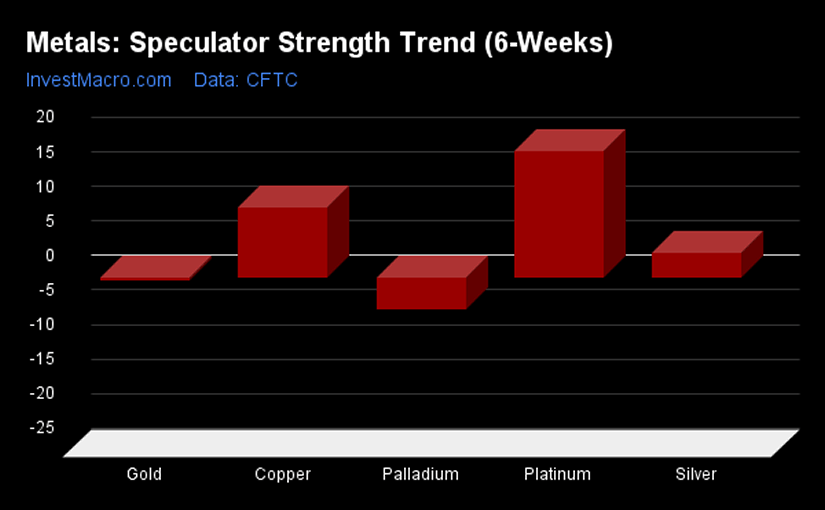
Strength Trends topped by Platinum

Strength Score Trends (or move index, calculates the 6-week changes in strength scores) show that Platinum (18.3 percent) leads the past six weeks trends for metals this week. Copper (10.2 percent) and Silver (3.5 percent) fill out the other positive movers in the latest trends data.
Palladium (-4.6 percent) leads the downside trend scores currently while the next market with lower trend scores was Gold (-0.4 percent).
Move Statistics:
Gold (-0.4 percent) vs Gold previous week (-9.7 percent)
Silver (3.5 percent) vs Silver previous week (5.0 percent)
Copper (10.2 percent) vs Copper previous week (1.6 percent)
Platinum (18.3 percent) vs Platinum previous week (17.8 percent)
Palladium (-4.6 percent) vs Palladium previous week (-2.8 percent)
Individual Markets:
Gold Comex Futures:
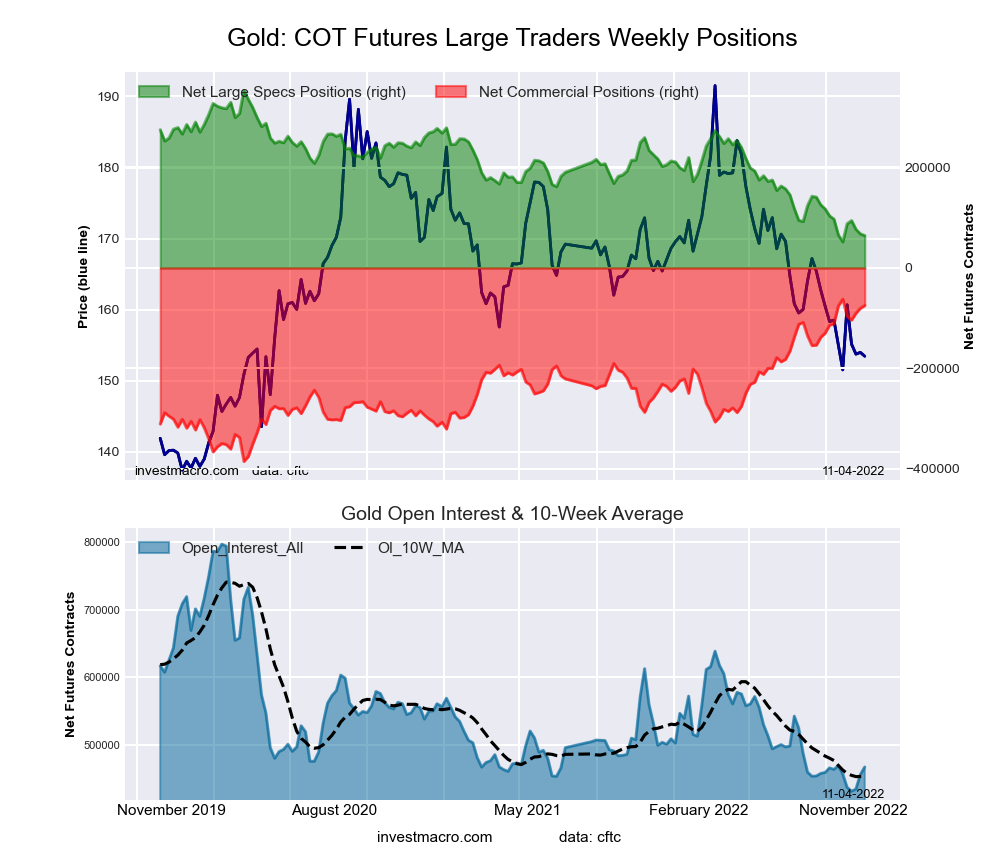 The Gold Comex Futures large speculator standing this week equaled a net position of 64,623 contracts in the data reported through Tuesday. This was a weekly reduction of -3,409 contracts from the previous week which had a total of 68,032 net contracts.
This week’s current strength score (the trader positioning range over the past three years, measured from 0 to 100) shows the speculators are currently Bearish-Extreme with a score of 4.2 percent. The commercials are Bullish-Extreme with a score of 96.1 percent and the small traders (not shown in chart) are Bearish-Extreme with a score of 5.0 percent.
| Gold Futures Statistics | SPECULATORS | COMMERCIALS | SMALL TRADERS |
| – Percent of Open Interest Longs: | 46.3 | 26.9 | 8.3 |
| – Percent of Open Interest Shorts: | 32.5 | 42.9 | 6.1 |
| – Net Position: | 64,623 | -74,782 | 10,159 |
| – Gross Longs: | 216,341 | 125,689 | 38,559 |
| – Gross Shorts: | 151,718 | 200,471 | 28,400 |
| – Long to Short Ratio: | 1.4 to 1 | 0.6 to 1 | 1.4 to 1 |
| NET POSITION TREND: | |||
| – Strength Index Score (3 Year Range Pct): | 4.2 | 96.1 | 5.0 |
| – Strength Index Reading (3 Year Range): | Bearish-Extreme | Bullish-Extreme | Bearish-Extreme |
| NET POSITION MOVEMENT INDEX: | |||
| – 6-Week Change in Strength Index: | -0.4 | 0.2 | 1.1 |
Silver Comex Futures:
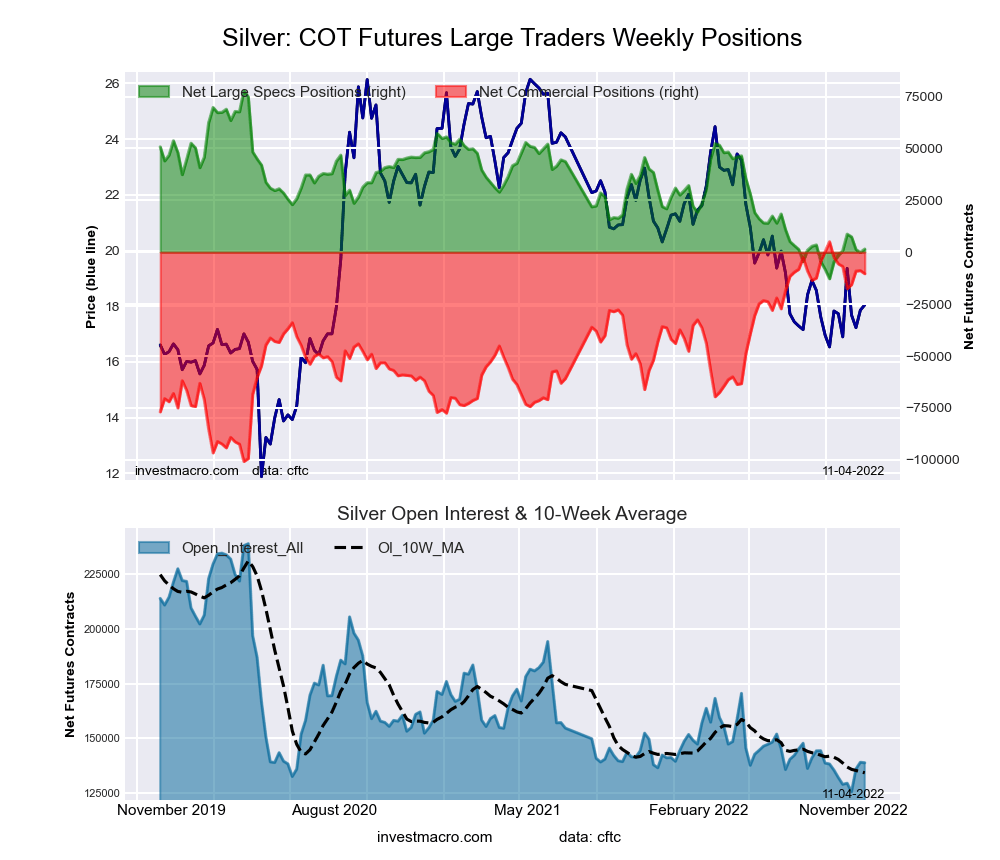 The Silver Comex Futures large speculator standing this week equaled a net position of 1,524 contracts in the data reported through Tuesday. This was a weekly boost of 1,625 contracts from the previous week which had a total of -101 net contracts.
This week’s current strength score (the trader positioning range over the past three years, measured from 0 to 100) shows the speculators are currently Bearish-Extreme with a score of 15.8 percent. The commercials are Bullish-Extreme with a score of 85.4 percent and the small traders (not shown in chart) are Bearish-Extreme with a score of 13.1 percent.
| Silver Futures Statistics | SPECULATORS | COMMERCIALS | SMALL TRADERS |
| – Percent of Open Interest Longs: | 36.9 | 37.3 | 15.9 |
| – Percent of Open Interest Shorts: | 35.8 | 44.8 | 9.5 |
| – Net Position: | 1,524 | -10,363 | 8,839 |
| – Gross Longs: | 51,286 | 51,802 | 22,076 |
| – Gross Shorts: | 49,762 | 62,165 | 13,237 |
| – Long to Short Ratio: | 1.0 to 1 | 0.8 to 1 | 1.7 to 1 |
| NET POSITION TREND: | |||
| – Strength Index Score (3 Year Range Pct): | 15.8 | 85.4 | 13.1 |
| – Strength Index Reading (3 Year Range): | Bearish-Extreme | Bullish-Extreme | Bearish-Extreme |
| NET POSITION MOVEMENT INDEX: | |||
| – 6-Week Change in Strength Index: | 3.5 | -4.5 | 7.5 |
Copper Grade #1 Futures:
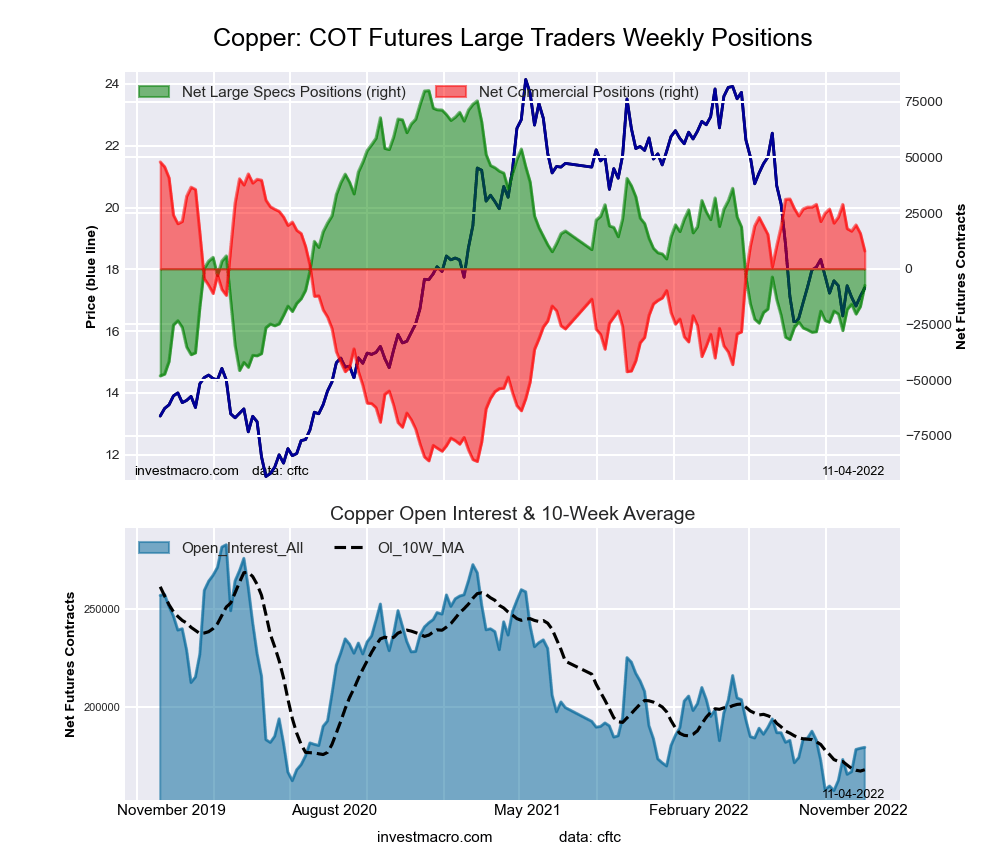 The Copper Grade #1 Futures large speculator standing this week equaled a net position of -7,484 contracts in the data reported through Tuesday. This was a weekly lift of 9,435 contracts from the previous week which had a total of -16,919 net contracts.
This week’s current strength score (the trader positioning range over the past three years, measured from 0 to 100) shows the speculators are currently Bearish with a score of 30.4 percent. The commercials are Bullish with a score of 73.2 percent and the small traders (not shown in chart) are Bearish with a score of 22.3 percent.
| Copper Futures Statistics | SPECULATORS | COMMERCIALS | SMALL TRADERS |
| – Percent of Open Interest Longs: | 28.2 | 42.5 | 7.8 |
| – Percent of Open Interest Shorts: | 32.4 | 38.0 | 8.1 |
| – Net Position: | -7,484 | 7,998 | -514 |
| – Gross Longs: | 50,738 | 76,394 | 14,103 |
| – Gross Shorts: | 58,222 | 68,396 | 14,617 |
| – Long to Short Ratio: | 0.9 to 1 | 1.1 to 1 | 1.0 to 1 |
| NET POSITION TREND: | |||
| – Strength Index Score (3 Year Range Pct): | 30.4 | 73.2 | 22.3 |
| – Strength Index Reading (3 Year Range): | Bearish | Bullish | Bearish |
| NET POSITION MOVEMENT INDEX: | |||
| – 6-Week Change in Strength Index: | 10.2 | -11.8 | 14.0 |
Platinum Futures:
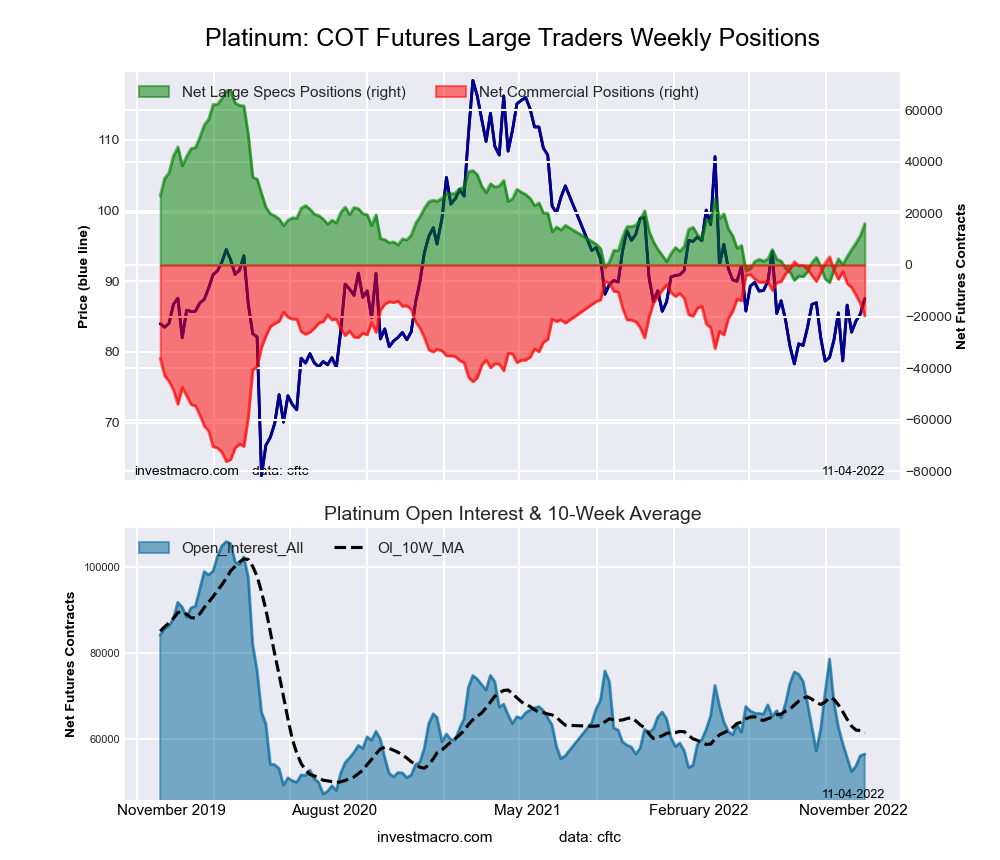 The Platinum Futures large speculator standing this week equaled a net position of 15,987 contracts in the data reported through Tuesday. This was a weekly gain of 4,606 contracts from the previous week which had a total of 11,381 net contracts.
This week’s current strength score (the trader positioning range over the past three years, measured from 0 to 100) shows the speculators are currently Bearish with a score of 30.6 percent. The commercials are Bullish with a score of 71.2 percent and the small traders (not shown in chart) are Bearish-Extreme with a score of 17.8 percent.
| Platinum Futures Statistics | SPECULATORS | COMMERCIALS | SMALL TRADERS |
| – Percent of Open Interest Longs: | 50.6 | 31.9 | 12.7 |
| – Percent of Open Interest Shorts: | 22.3 | 66.7 | 6.1 |
| – Net Position: | 15,987 | -19,690 | 3,703 |
| – Gross Longs: | 28,611 | 18,041 | 7,159 |
| – Gross Shorts: | 12,624 | 37,731 | 3,456 |
| – Long to Short Ratio: | 2.3 to 1 | 0.5 to 1 | 2.1 to 1 |
| NET POSITION TREND: | |||
| – Strength Index Score (3 Year Range Pct): | 30.6 | 71.2 | 17.8 |
| – Strength Index Reading (3 Year Range): | Bearish | Bullish | Bearish-Extreme |
| NET POSITION MOVEMENT INDEX: | |||
| – 6-Week Change in Strength Index: | 18.3 | -17.9 | 7.9 |
Palladium Futures:
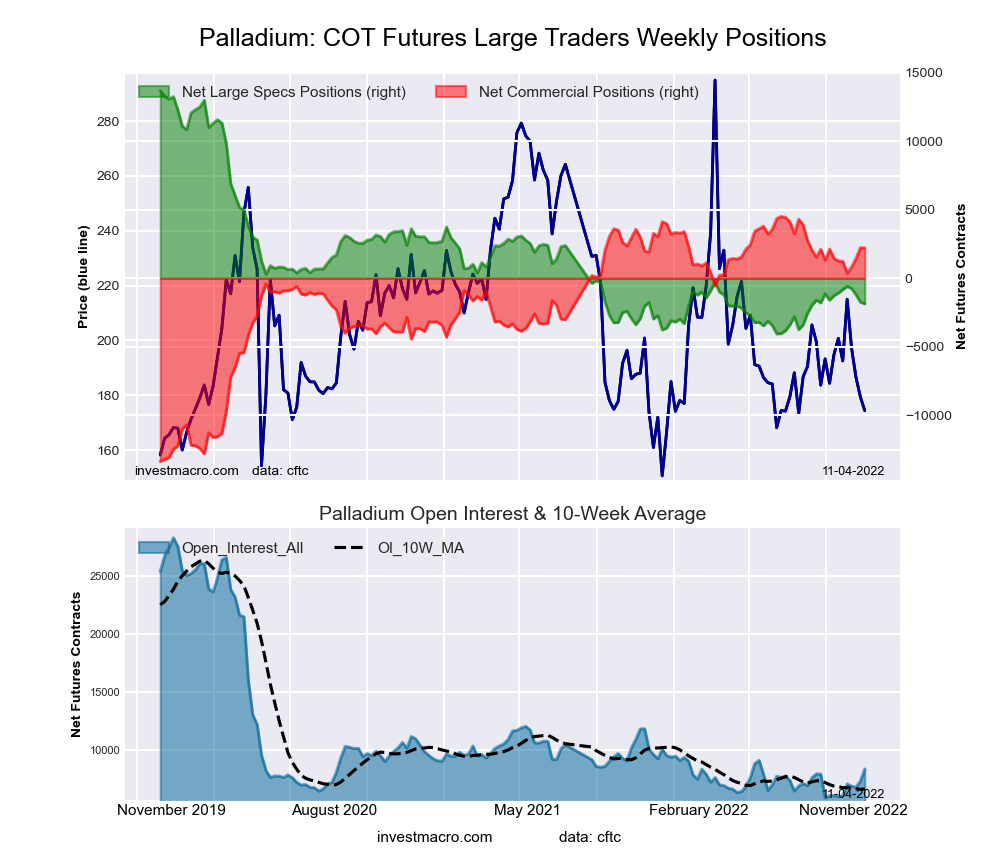 The Palladium Futures large speculator standing this week equaled a net position of -1,867 contracts in the data reported through Tuesday. This was a weekly decline of -122 contracts from the previous week which had a total of -1,745 net contracts.
This week’s current strength score (the trader positioning range over the past three years, measured from 0 to 100) shows the speculators are currently Bearish-Extreme with a score of 12.8 percent. The commercials are Bullish-Extreme with a score of 86.8 percent and the small traders (not shown in chart) are Bearish with a score of 20.4 percent.
| Palladium Futures Statistics | SPECULATORS | COMMERCIALS | SMALL TRADERS |
| – Percent of Open Interest Longs: | 22.8 | 54.1 | 13.6 |
| – Percent of Open Interest Shorts: | 45.1 | 27.6 | 17.9 |
| – Net Position: | -1,867 | 2,221 | -354 |
| – Gross Longs: | 1,906 | 4,532 | 1,141 |
| – Gross Shorts: | 3,773 | 2,311 | 1,495 |
| – Long to Short Ratio: | 0.5 to 1 | 2.0 to 1 | 0.8 to 1 |
| NET POSITION TREND: | |||
| – Strength Index Score (3 Year Range Pct): | 12.8 | 86.8 | 20.4 |
| – Strength Index Reading (3 Year Range): | Bearish-Extreme | Bullish-Extreme | Bearish |
| NET POSITION MOVEMENT INDEX: | |||
| – 6-Week Change in Strength Index: | -4.6 | 5.5 | -10.5 |
Article By InvestMacro – Receive our weekly COT Newsletter
*COT Report: The COT data, released weekly to the public each Friday, is updated through the most recent Tuesday (data is 3 days old) and shows a quick view of how large speculators or non-commercials (for-profit traders) were positioned in the futures markets.
The CFTC categorizes trader positions according to commercial hedgers (traders who use futures contracts for hedging as part of the business), non-commercials (large traders who speculate to realize trading profits) and nonreportable traders (usually small traders/speculators) as well as their open interest (contracts open in the market at time of reporting). See CFTC criteria here.

- COT Metals Charts: Weekly Speculator Bets see small gains for Silver & Gold Jul 12, 2026
- COT Bonds Charts: Speculator Bets led by SOFR 3-Months & 2-Year Bonds Jul 12, 2026
- COT Energy Charts: Weekly Speculator Changes led by Brent Oil Jul 12, 2026
- COT Soft Commodities Charts: Weekly Speculator Changes led by Sugar, Corn & Soybeans Jul 12, 2026
- The US and European stock indices are rising again amid renewed investor interest in the AI industry. Jul 10, 2026
- USD/JPY Falls as Yen Recovers Weekly Losses Jul 10, 2026
- Crude oil prices surged sharply by 7% in reaction to the rapid escalation of the conflict in the Middle East Jul 9, 2026
- Middle East Tensions Weigh on Gold Jul 9, 2026
- Pound Awaits Tighter Policy from Bank of England Jul 8, 2026
- The United States carried out airstrikes on Iran after Iran’s attacked tankers in the Strait of Hormuz. The RBNZ raised the interest rate to 2.5% Jul 8, 2026