
By InvestMacro
Here are the latest charts and statistics for the Commitment of Traders (COT) data published by the Commodities Futures Trading Commission (CFTC).
The latest COT data is updated through Tuesday April 4th and shows a quick view of how large traders (for-profit speculators and commercial entities) were positioned in the futures markets.
Weekly Speculator Changes led by Gold & Silver
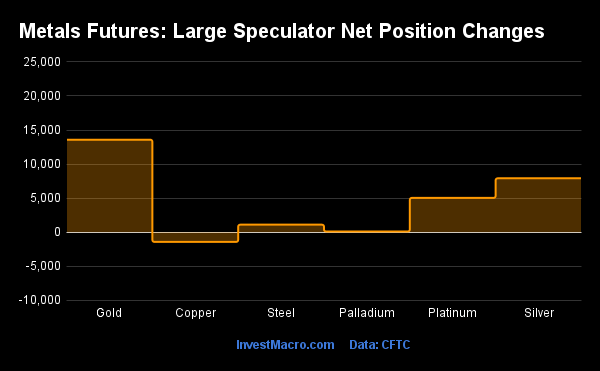
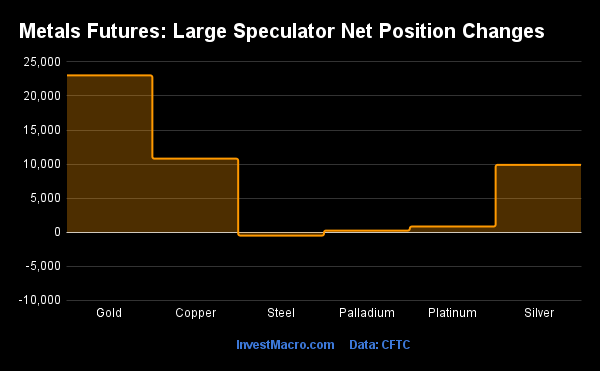
The COT metals markets speculator bets were higher this week as five out of the six metals markets we cover had higher positioning while the other one markets had lower speculator contracts.
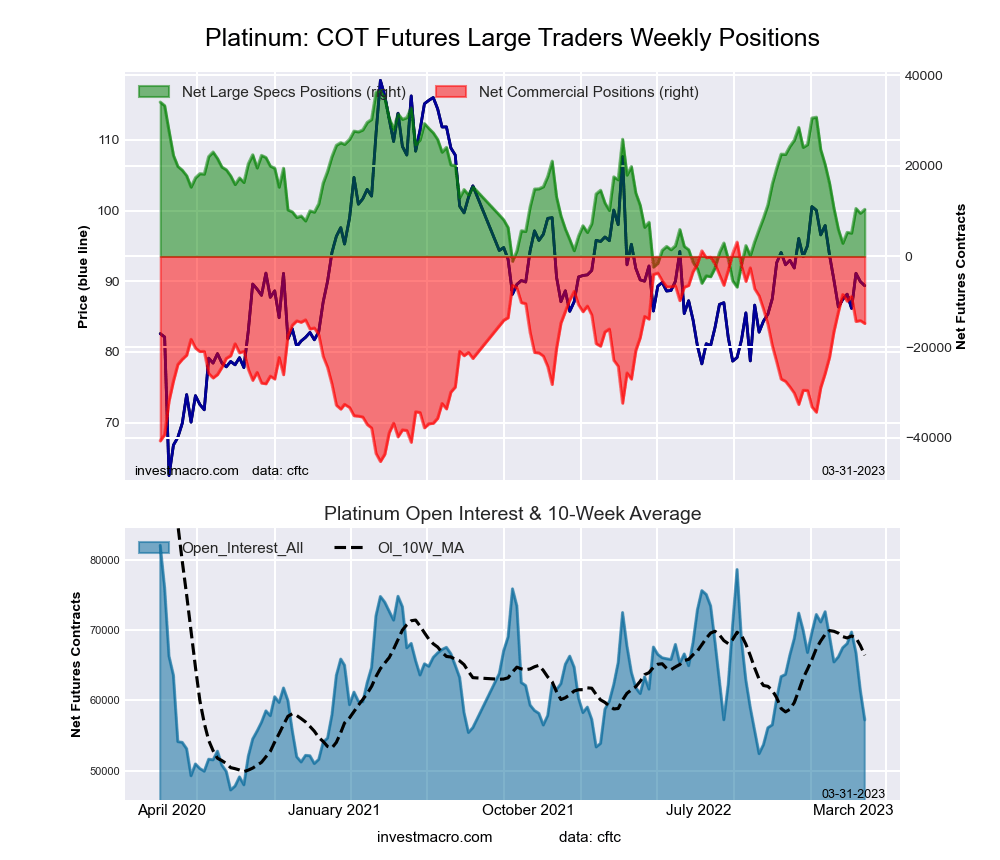
Leading the gains for the metals was Gold (13,586 contracts) with Silver (7,922 contracts), Platinum (5,049 contracts), Palladium (118 contracts) and Steel (1,117 contracts) also showing positive weeks.
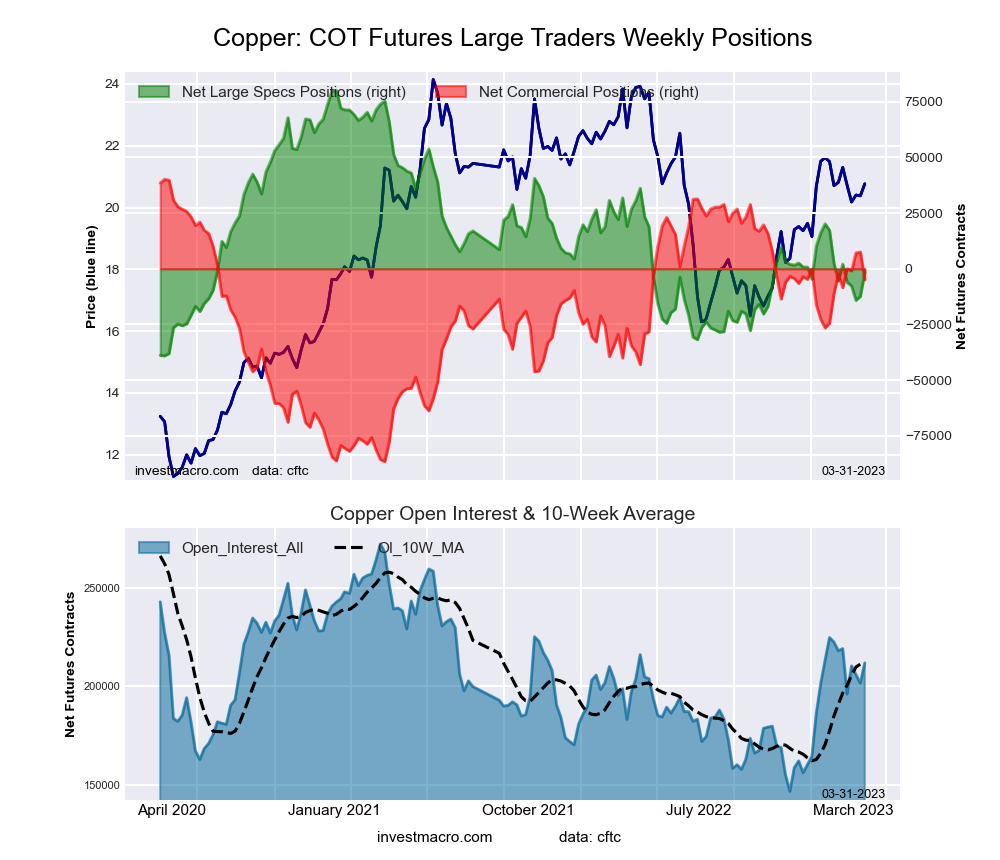
The market with declines in speculator bets for the week was Copper (-1,409 contracts).
Gold and Silver Speculator positions continue to move higher
Highlighting the COT metals data this week is the continued rise in bets for the Gold and Silver speculative positions.
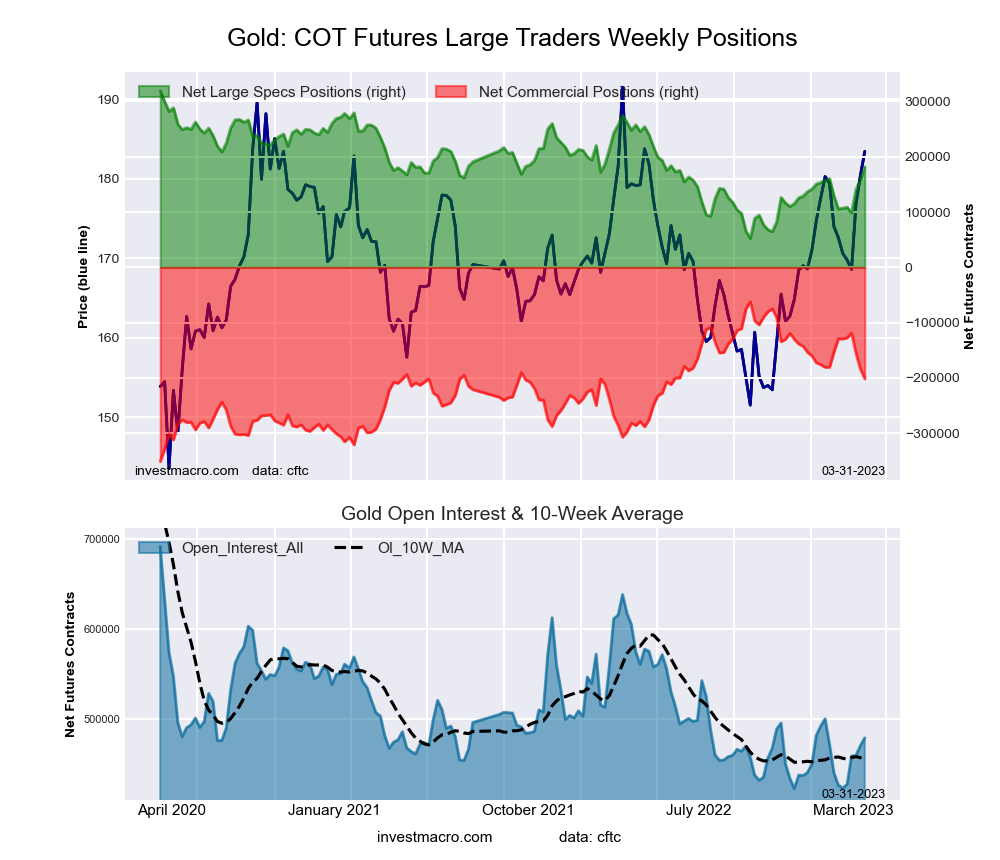
The large speculator position in Gold futures rose this week for a fourth straight week and for the sixth time out of the past seven weeks. Gold speculator bets have now jumped by a total of +96,742 contracts over just the past four weeks going from a total net position of +98,474
contracts on March 7th to a total of +195,216 contracts this week.
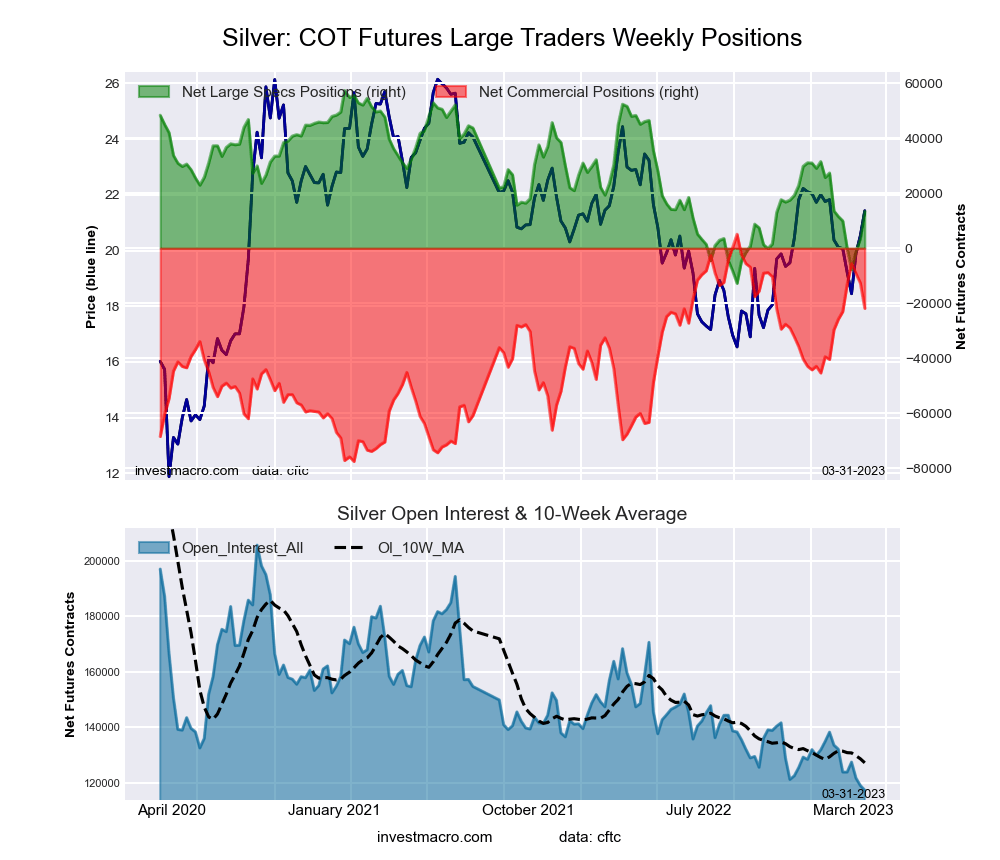
Meanwhile, the Silver speculator positions have also risen for four straight weeks and have gained by a total of +29,065 contracts over that four-week period. These gains have taken the Silver position out of an overall bearish level of -7,782 contracts on March 7th to a total of +21,283 contracts this week (the most bullish level since January 31st).
The Gold and Silver futures prices have also been on the rise as well. The Gold futures front month price closed this week at approximately the $2,026 level which is the highest weekly close since August 3rd of 2020. Gold is now up over 25 percent since October.
Silver futures prices have gained for four straight weeks and closed this week above $25, the highest level since April of 2022. Silver prices are up by over 40 percent from the most recent cycle low in late-August of 2022.
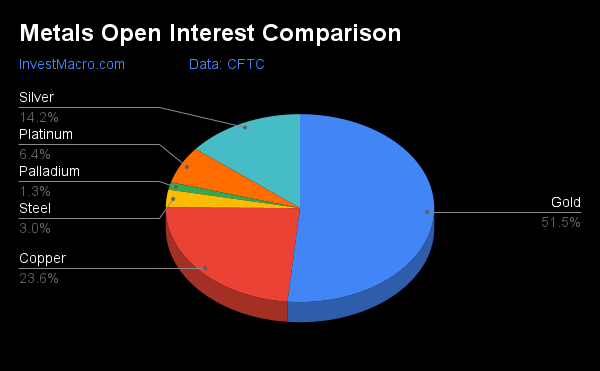
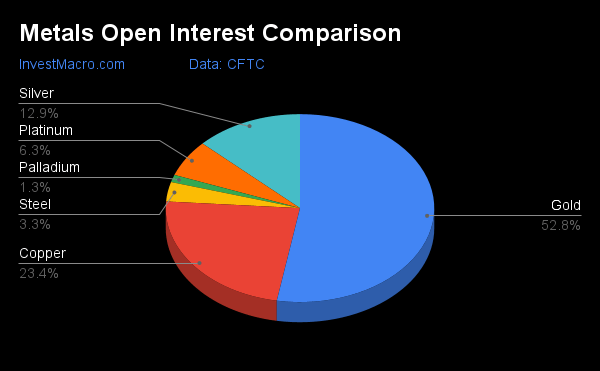
| Apr-04-2023 | OI | OI-Index | Spec-Net | Spec-Index | Com-Net | COM-Index | Smalls-Net | Smalls-Index |
|---|---|---|---|---|---|---|---|---|
| Gold | 476,592 | 25 | 195,216 | 63 | -218,250 | 40 | 23,034 | 38 |
| Silver | 131,210 | 16 | 21,283 | 49 | -31,435 | 56 | 10,152 | 23 |
| Copper | 218,687 | 57 | -2,954 | 26 | -4,897 | 69 | 7,851 | 68 |
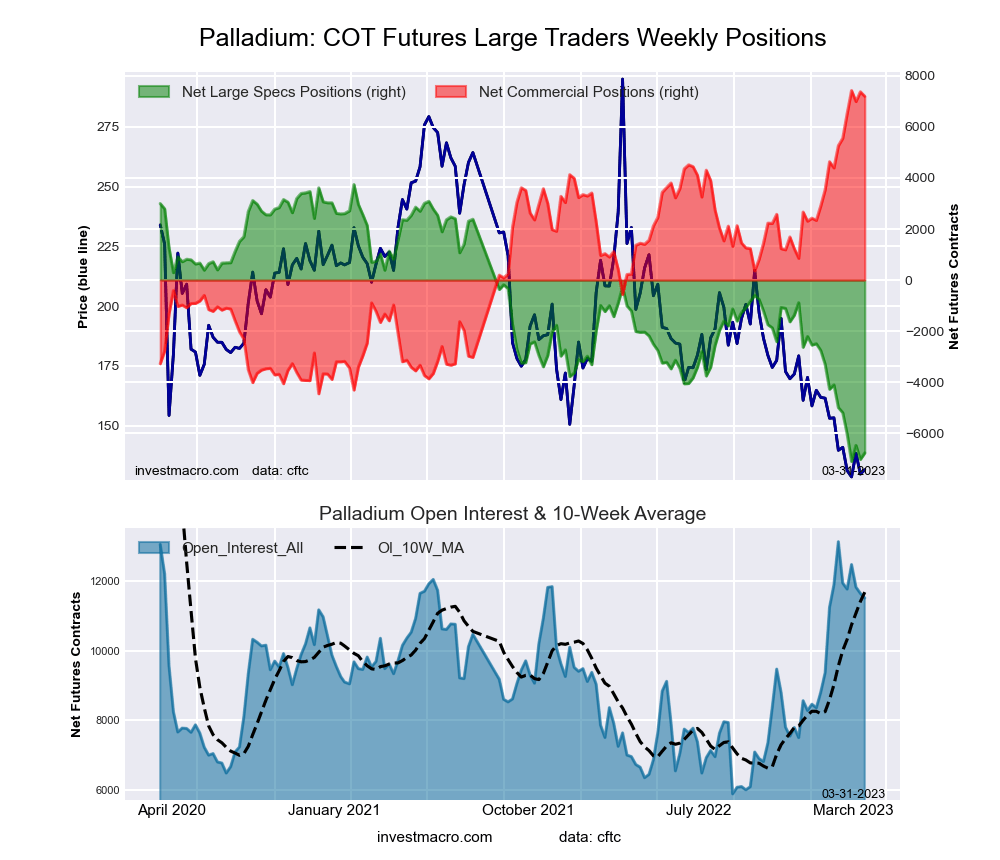
| Palladium | 11,820 | 82 | -6,646 | 4 | 7,011 | 97 | -365 | 20 |
| Platinum | 59,156 | 38 | 15,423 | 51 | -19,201 | 54 | 3,778 | 19 |
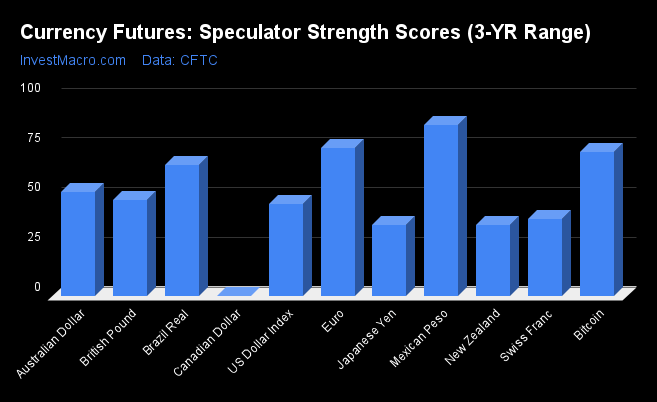
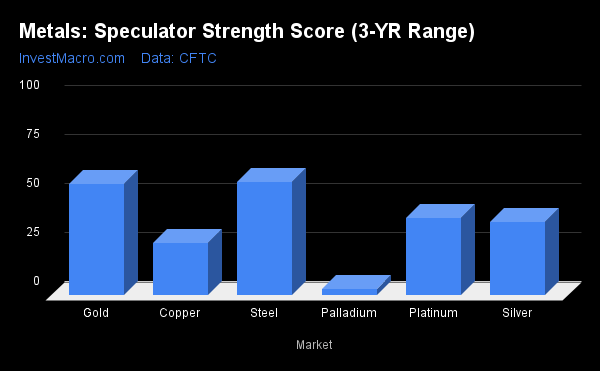
Strength Scores led by Gold & Steel
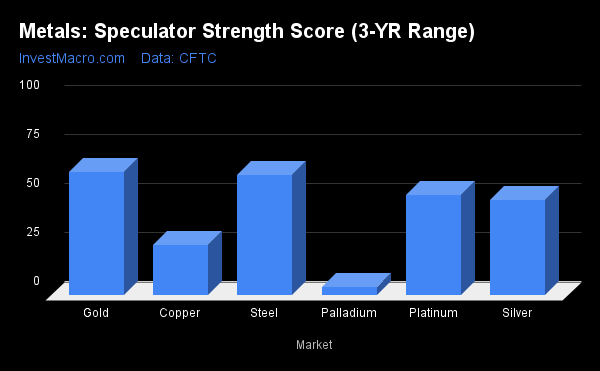
COT Strength Scores (a normalized measure of Speculator positions over a 3-Year range, from 0 to 100 where above 80 is Extreme-Bullish and below 20 is Extreme-Bearish) showed that Gold (63 percent) and Steel (61 percent) lead the metals markets this week. Palladium (4 percent) comes in as the next highest in the weekly strength scores.
On the downside, Palladium (4 percent) comes in at the lowest strength level currently and is in Extreme-Bearish territory (below 20 percent).
Strength Statistics:
Gold (63.0 percent) vs Gold previous week (57.0 percent)
Silver (48.6 percent) vs Silver previous week (37.3 percent)
Copper (25.8 percent) vs Copper previous week (27.0 percent)
Platinum (51.2 percent) vs Platinum previous week (39.5 percent)
Palladium (4.2 percent) vs Palladium previous week (3.1 percent)
Steel (61.2 percent) vs Palladium previous week (57.9 percent)
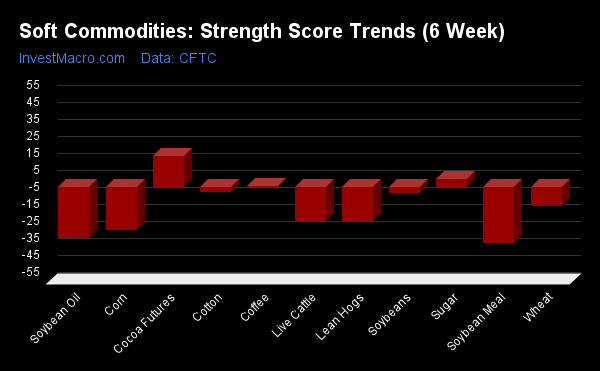
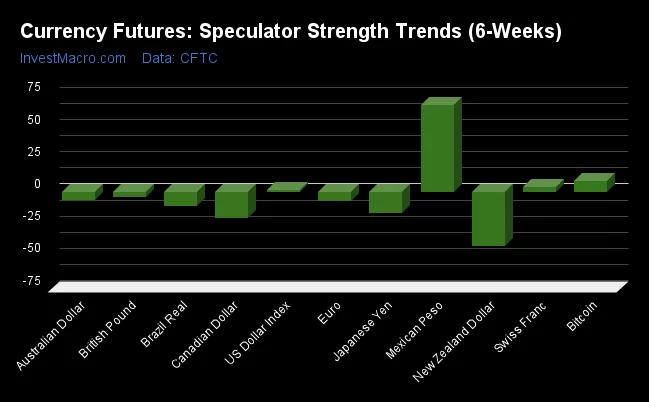
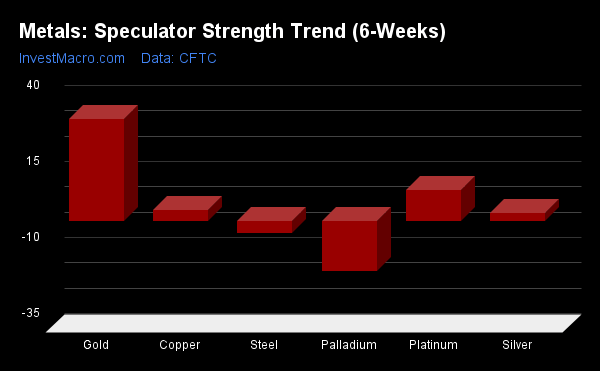
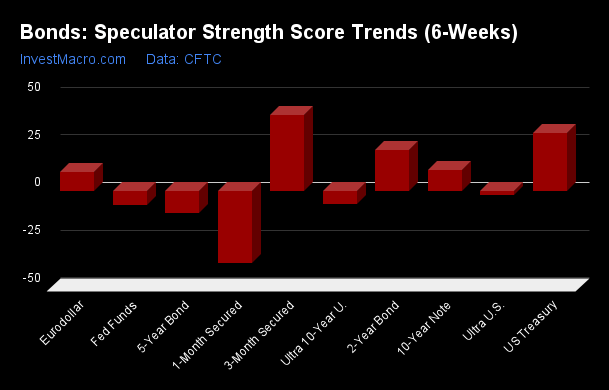
Gold & Platinum top the 6-Week Strength Trends
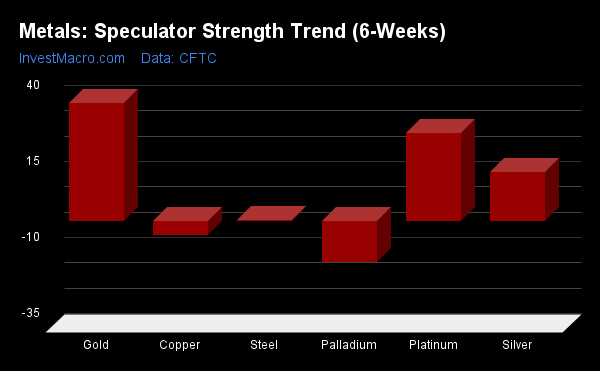
COT Strength Score Trends (or move index, calculates the 6-week changes in strength scores) showed that Gold (39 percent) and Platinum (29 percent) lead the past six weeks trends for metals.
Palladium (-13 percent) leads the downside trend scores currently.
Move Statistics:
Gold (38.8 percent) vs Gold previous week (33.5 percent)
Silver (16.2 percent) vs Silver previous week (2.6 percent)
Copper (-4.5 percent) vs Copper previous week (3.5 percent)
Platinum (28.9 percent) vs Platinum previous week (10.1 percent)
Palladium (-13.5 percent) vs Palladium previous week (-16.4 percent)
Steel (0.2 percent) vs Steel previous week (-3.8 percent)
Individual Markets:
Gold Comex Futures:
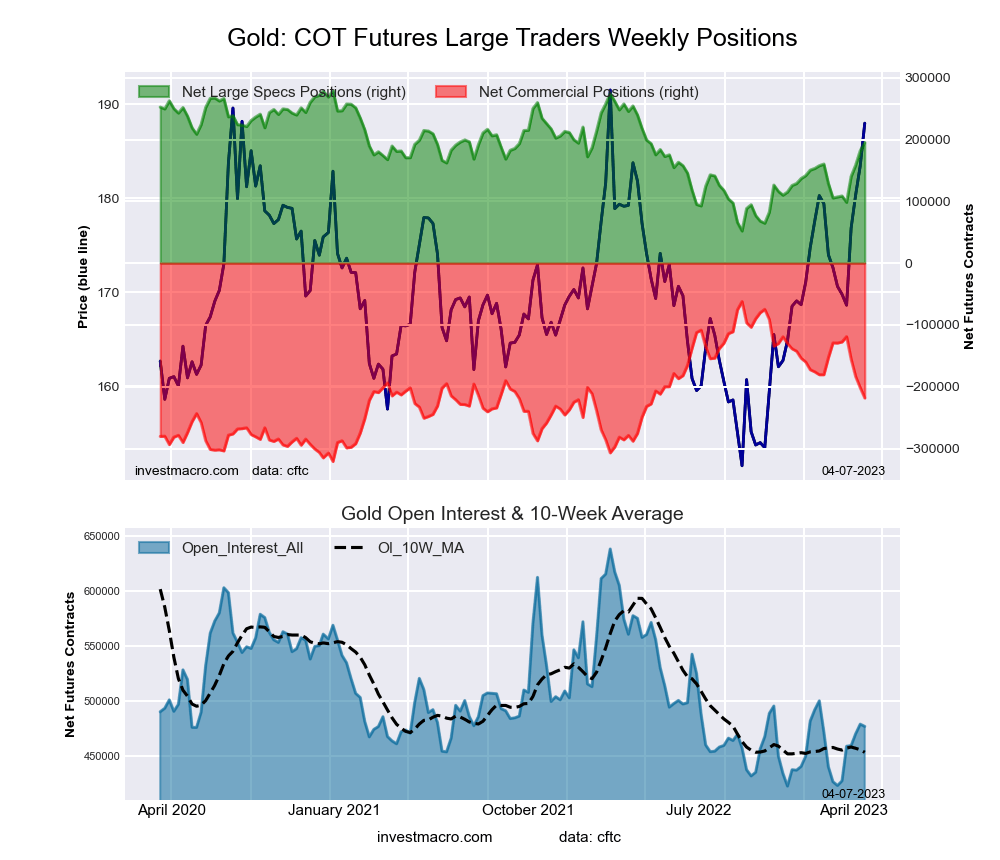 The Gold Comex Futures large speculator standing this week was a net position of 195,216 contracts in the data reported through Tuesday. This was a weekly gain of 13,586 contracts from the previous week which had a total of 181,630 net contracts.
This week’s current strength score (the trader positioning range over the past three years, measured from 0 to 100) shows the speculators are currently Bullish with a score of 63.0 percent. The commercials are Bearish with a score of 39.7 percent and the small traders (not shown in chart) are Bearish with a score of 37.7 percent.
| Gold Futures Statistics | SPECULATORS | COMMERCIALS | SMALL TRADERS |
| – Percent of Open Interest Longs: | 55.8 | 24.5 | 10.2 |
| – Percent of Open Interest Shorts: | 14.9 | 70.3 | 5.4 |
| – Net Position: | 195,216 | -218,250 | 23,034 |
| – Gross Longs: | 266,164 | 116,869 | 48,740 |
| – Gross Shorts: | 70,948 | 335,119 | 25,706 |
| – Long to Short Ratio: | 3.8 to 1 | 0.3 to 1 | 1.9 to 1 |
| NET POSITION TREND: | |||
| – Strength Index Score (3 Year Range Pct): | 63.0 | 39.7 | 37.7 |
| – Strength Index Reading (3 Year Range): | Bullish | Bearish | Bearish |
| NET POSITION MOVEMENT INDEX: | |||
| – 6-Week Change in Strength Index: | 38.8 | -34.4 | 2.0 |
Silver Comex Futures:
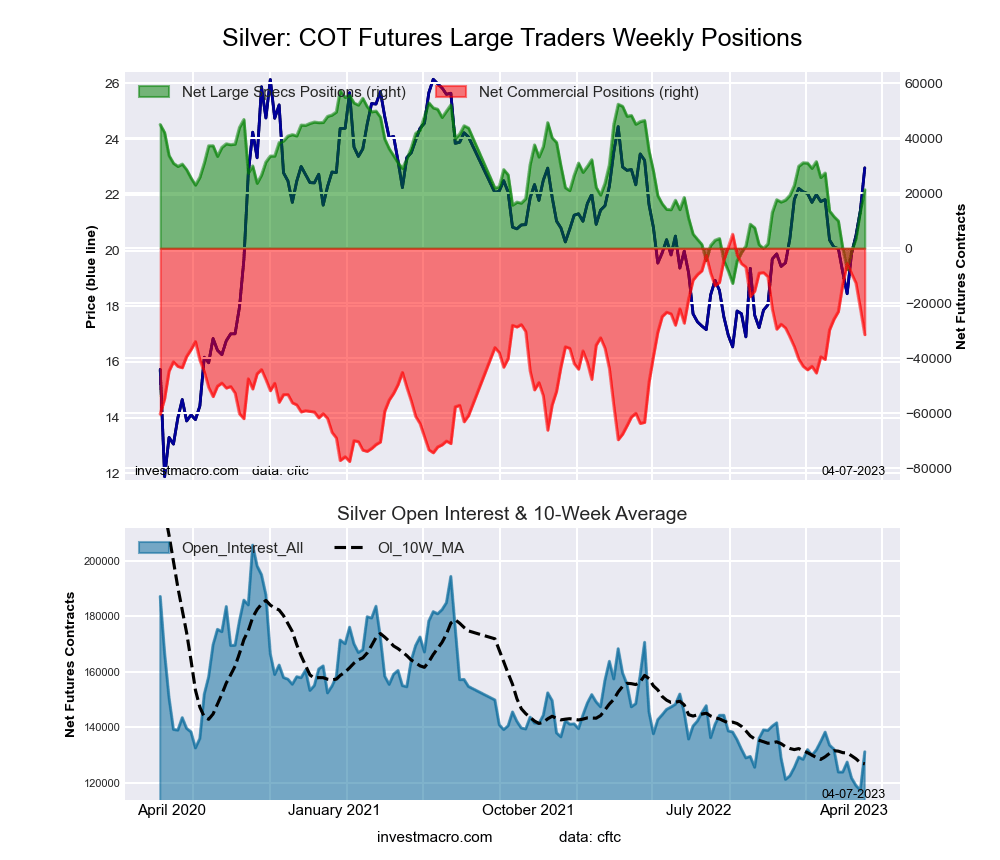 The Silver Comex Futures large speculator standing this week was a net position of 21,283 contracts in the data reported through Tuesday. This was a weekly rise of 7,922 contracts from the previous week which had a total of 13,361 net contracts.
This week’s current strength score (the trader positioning range over the past three years, measured from 0 to 100) shows the speculators are currently Bearish with a score of 48.6 percent. The commercials are Bullish with a score of 55.8 percent and the small traders (not shown in chart) are Bearish with a score of 22.7 percent.
| Silver Futures Statistics | SPECULATORS | COMMERCIALS | SMALL TRADERS |
| – Percent of Open Interest Longs: | 38.4 | 34.2 | 18.5 |
| – Percent of Open Interest Shorts: | 22.1 | 58.2 | 10.7 |
| – Net Position: | 21,283 | -31,435 | 10,152 |
| – Gross Longs: | 50,327 | 44,936 | 24,209 |
| – Gross Shorts: | 29,044 | 76,371 | 14,057 |
| – Long to Short Ratio: | 1.7 to 1 | 0.6 to 1 | 1.7 to 1 |
| NET POSITION TREND: | |||
| – Strength Index Score (3 Year Range Pct): | 48.6 | 55.8 | 22.7 |
| – Strength Index Reading (3 Year Range): | Bearish | Bullish | Bearish |
| NET POSITION MOVEMENT INDEX: | |||
| – 6-Week Change in Strength Index: | 16.2 | -10.2 | -16.8 |
Copper Grade #1 Futures:
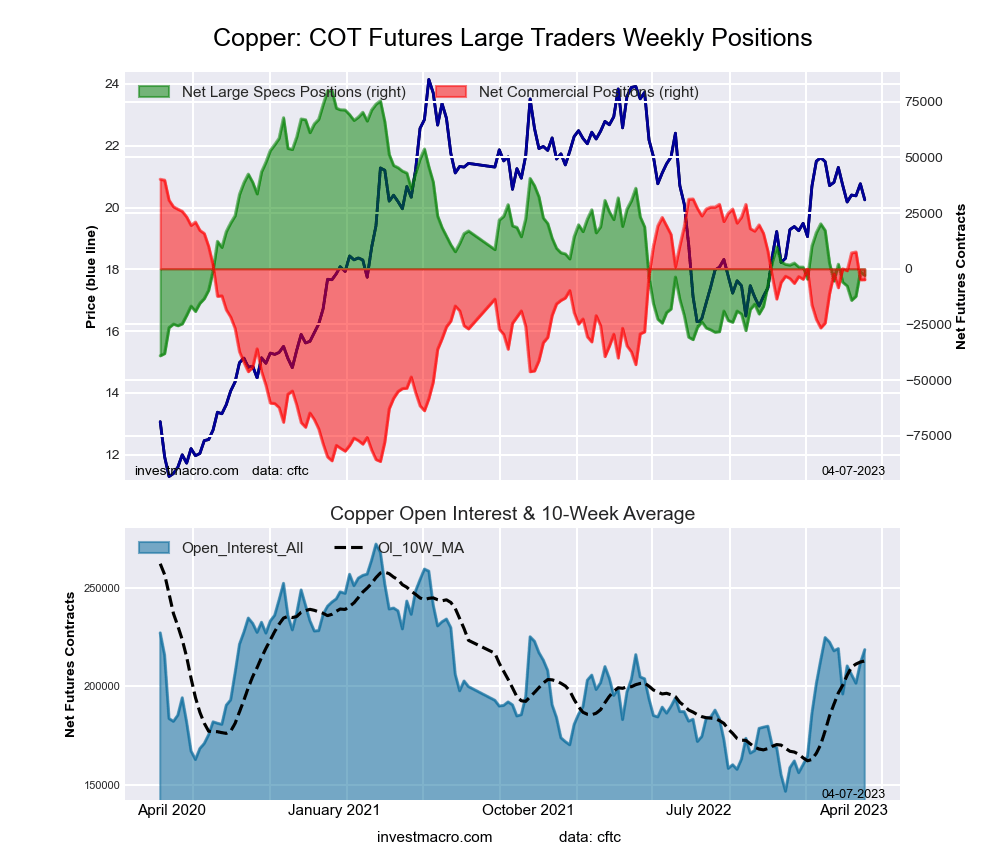 The Copper Grade #1 Futures large speculator standing this week was a net position of -2,954 contracts in the data reported through Tuesday. This was a weekly reduction of -1,409 contracts from the previous week which had a total of -1,545 net contracts.
This week’s current strength score (the trader positioning range over the past three years, measured from 0 to 100) shows the speculators are currently Bearish with a score of 25.8 percent. The commercials are Bullish with a score of 69.3 percent and the small traders (not shown in chart) are Bullish with a score of 68.0 percent.
| Copper Futures Statistics | SPECULATORS | COMMERCIALS | SMALL TRADERS |
| – Percent of Open Interest Longs: | 27.7 | 42.7 | 8.9 |
| – Percent of Open Interest Shorts: | 29.0 | 45.0 | 5.3 |
| – Net Position: | -2,954 | -4,897 | 7,851 |
| – Gross Longs: | 60,538 | 93,465 | 19,483 |
| – Gross Shorts: | 63,492 | 98,362 | 11,632 |
| – Long to Short Ratio: | 1.0 to 1 | 1.0 to 1 | 1.7 to 1 |
| NET POSITION TREND: | |||
| – Strength Index Score (3 Year Range Pct): | 25.8 | 69.3 | 68.0 |
| – Strength Index Reading (3 Year Range): | Bearish | Bullish | Bullish |
| NET POSITION MOVEMENT INDEX: | |||
| – 6-Week Change in Strength Index: | -4.5 | 3.1 | 8.8 |
Platinum Futures:
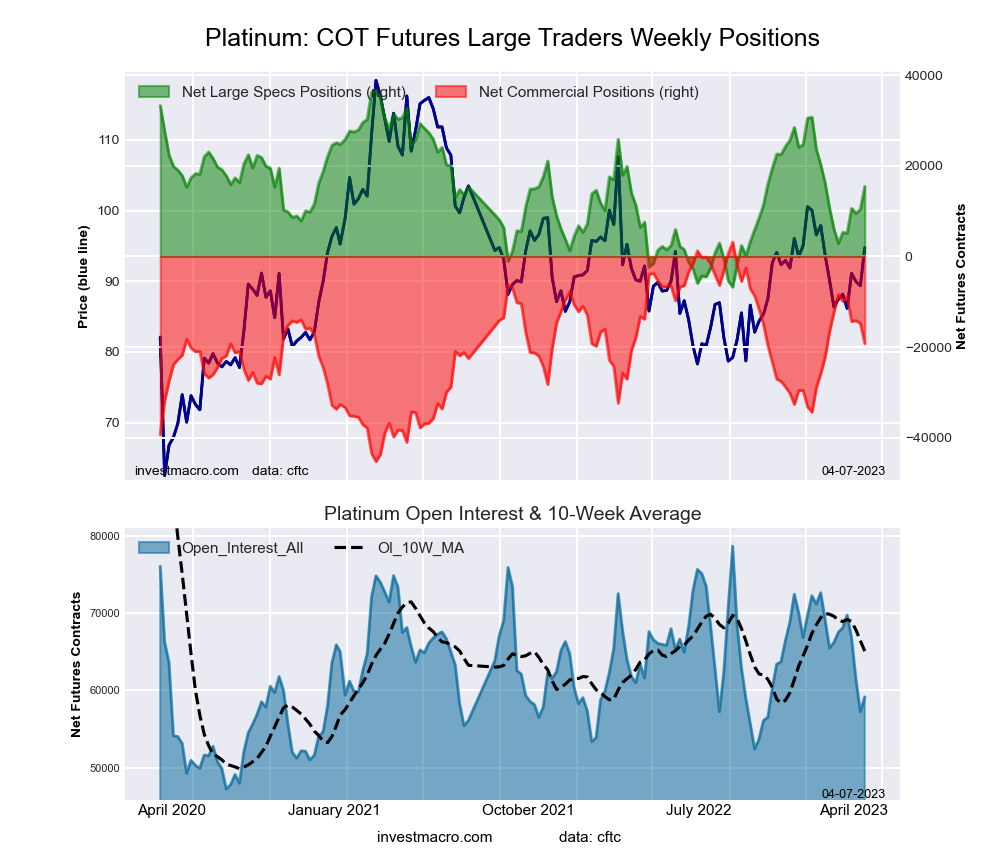 The Platinum Futures large speculator standing this week was a net position of 15,423 contracts in the data reported through Tuesday. This was a weekly lift of 5,049 contracts from the previous week which had a total of 10,374 net contracts.
This week’s current strength score (the trader positioning range over the past three years, measured from 0 to 100) shows the speculators are currently Bullish with a score of 51.2 percent. The commercials are Bullish with a score of 53.8 percent and the small traders (not shown in chart) are Bearish-Extreme with a score of 18.8 percent.
| Platinum Futures Statistics | SPECULATORS | COMMERCIALS | SMALL TRADERS |
| – Percent of Open Interest Longs: | 50.4 | 35.0 | 11.6 |
| – Percent of Open Interest Shorts: | 24.4 | 67.5 | 5.2 |
| – Net Position: | 15,423 | -19,201 | 3,778 |
| – Gross Longs: | 29,841 | 20,708 | 6,873 |
| – Gross Shorts: | 14,418 | 39,909 | 3,095 |
| – Long to Short Ratio: | 2.1 to 1 | 0.5 to 1 | 2.2 to 1 |
| NET POSITION TREND: | |||
| – Strength Index Score (3 Year Range Pct): | 51.2 | 53.8 | 18.8 |
| – Strength Index Reading (3 Year Range): | Bullish | Bullish | Bearish-Extreme |
| NET POSITION MOVEMENT INDEX: | |||
| – 6-Week Change in Strength Index: | 28.9 | -22.3 | -22.8 |
Palladium Futures:
 The Palladium Futures large speculator standing this week was a net position of -6,646 contracts in the data reported through Tuesday. This was a weekly gain of 118 contracts from the previous week which had a total of -6,764 net contracts.
This week’s current strength score (the trader positioning range over the past three years, measured from 0 to 100) shows the speculators are currently Bearish-Extreme with a score of 4.2 percent. The commercials are Bullish-Extreme with a score of 96.6 percent and the small traders (not shown in chart) are Bearish-Extreme with a score of 19.8 percent.
| Palladium Futures Statistics | SPECULATORS | COMMERCIALS | SMALL TRADERS |
| – Percent of Open Interest Longs: | 13.1 | 71.5 | 10.8 |
| – Percent of Open Interest Shorts: | 69.3 | 12.2 | 13.9 |
| – Net Position: | -6,646 | 7,011 | -365 |
| – Gross Longs: | 1,551 | 8,450 | 1,279 |
| – Gross Shorts: | 8,197 | 1,439 | 1,644 |
| – Long to Short Ratio: | 0.2 to 1 | 5.9 to 1 | 0.8 to 1 |
| NET POSITION TREND: | |||
| – Strength Index Score (3 Year Range Pct): | 4.2 | 96.6 | 19.8 |
| – Strength Index Reading (3 Year Range): | Bearish-Extreme | Bullish-Extreme | Bearish-Extreme |
| NET POSITION MOVEMENT INDEX: | |||
| – 6-Week Change in Strength Index: | -13.5 | 12.3 | -0.1 |
Steel Futures Futures:
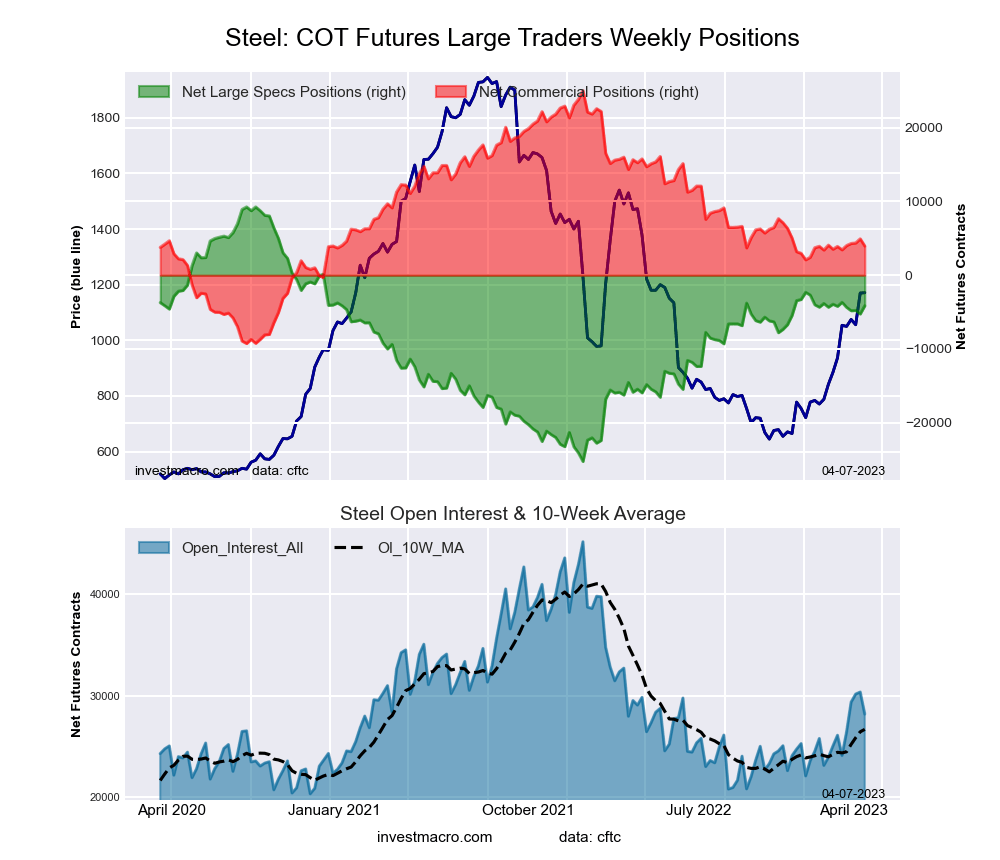 The Steel Futures large speculator standing this week was a net position of -4,138 contracts in the data reported through Tuesday. This was a weekly gain of 1,117 contracts from the previous week which had a total of -5,255 net contracts.
This week’s current strength score (the trader positioning range over the past three years, measured from 0 to 100) shows the speculators are currently Bullish with a score of 61.2 percent. The commercials are Bearish with a score of 38.5 percent and the small traders (not shown in chart) are Bearish with a score of 42.8 percent.
| Steel Futures Statistics | SPECULATORS | COMMERCIALS | SMALL TRADERS |
| – Percent of Open Interest Longs: | 12.5 | 75.3 | 1.2 |
| – Percent of Open Interest Shorts: | 27.2 | 61.3 | 0.5 |
| – Net Position: | -4,138 | 3,958 | 180 |
| – Gross Longs: | 3,532 | 21,243 | 334 |
| – Gross Shorts: | 7,670 | 17,285 | 154 |
| – Long to Short Ratio: | 0.5 to 1 | 1.2 to 1 | 2.2 to 1 |
| NET POSITION TREND: | |||
| – Strength Index Score (3 Year Range Pct): | 61.2 | 38.5 | 42.8 |
| – Strength Index Reading (3 Year Range): | Bullish | Bearish | Bearish |
| NET POSITION MOVEMENT INDEX: | |||
| – 6-Week Change in Strength Index: | 0.2 | 0.2 | -18.1 |
Article By InvestMacro – Receive our weekly COT Newsletter
*COT Report: The COT data, released weekly to the public each Friday, is updated through the most recent Tuesday (data is 3 days old) and shows a quick view of how large speculators or non-commercials (for-profit traders) were positioned in the futures markets.
The CFTC categorizes trader positions according to commercial hedgers (traders who use futures contracts for hedging as part of the business), non-commercials (large traders who speculate to realize trading profits) and nonreportable traders (usually small traders/speculators) as well as their open interest (contracts open in the market at time of reporting). See CFTC criteria here.


