
By InvestMacro
Here are the latest charts and statistics for the Commitment of Traders (COT) data published by the Commodities Futures Trading Commission (CFTC). The COT release was delayed due to a Federal Holiday last week.
The latest COT data is updated through Tuesday November 8th and shows a quick view of how large traders (for-profit speculators and commercial hedgers) were positioned in the futures markets.
Gold, Silver & Copper led the Weekly Speculator Changes

The COT precious metals speculator bets were higher last week as four out of the five metals markets we cover had higher positioning this week while only one market had lower contracts.
Free Reports:
 Sign Up for Our Stock Market Newsletter – Get updated on News, Charts & Rankings of Public Companies when you join our Stocks Newsletter
 Get our Weekly Commitment of Traders Reports - See where the biggest traders (Hedge Funds and Commercial Hedgers) are positioned in the futures markets on a weekly basis.
Leading the gains for the precious metals markets was Gold (17,715 contracts) with Silver (11,479 contracts), Copper (10,397 contracts) and Platinum (3,462 contracts) also showing a positive week.
The only metals markets with declines in speculator bets this week was Palladium with a total of -543 contracts lower bets on the week.
| Nov-08-2022 | OI | OI-Index | Spec-Net | Spec-Index | Com-Net | COM-Index | Smalls-Net | Smalls-Index |
|---|---|---|---|---|---|---|---|---|
| WTI Crude | 1,446,658 | 1 | 274,790 | 17 | -301,325 | 83 | 26,535 | 43 |
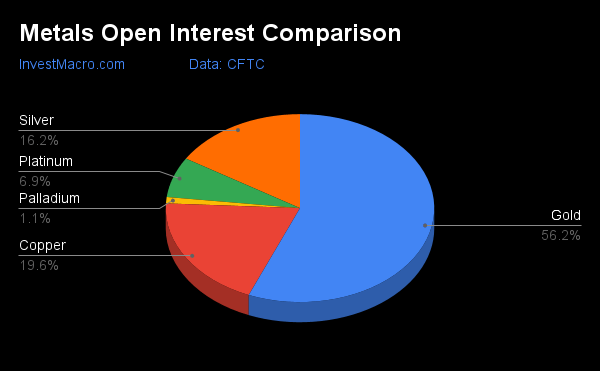
| Gold | 488,471 | 16 | 82,338 | 10 | -91,144 | 91 | 8,806 | 2 |
| Silver | 140,437 | 13 | 13,003 | 28 | -22,088 | 74 | 9,085 | 14 |
| Copper | 169,929 | 10 | 2,913 | 39 | -3,426 | 64 | 513 | 28 |
| Palladium | 9,467 | 17 | -2,410 | 10 | 2,573 | 89 | -163 | 32 |
| Platinum | 60,301 | 22 | 19,449 | 35 | -23,295 | 67 | 3,846 | 20 |
| Natural Gas | 982,596 | 7 | -152,308 | 33 | 120,222 | 69 | 32,086 | 56 |
| Brent | 135,078 | 1 | -22,201 | 74 | 18,085 | 23 | 4,116 | 65 |
| Heating Oil | 266,730 | 23 | 27,958 | 84 | -51,059 | 17 | 23,101 | 78 |
| Soybeans | 611,011 | 8 | 87,809 | 40 | -60,966 | 68 | -26,843 | 26 |
| Corn | 1,484,427 | 31 | 301,554 | 69 | -254,182 | 36 | -47,372 | 16 |
| Coffee | 217,646 | 25 | -4,683 | 4 | 1,912 | 100 | 2,771 | 38 |
| Sugar | 766,340 | 14 | 90,182 | 44 | -122,561 | 56 | 32,379 | 48 |
| Wheat | 350,843 | 27 | -17,214 | 0 | 23,686 | 93 | -6,472 | 77 |
Copper & Platinum lead the Strength Scores
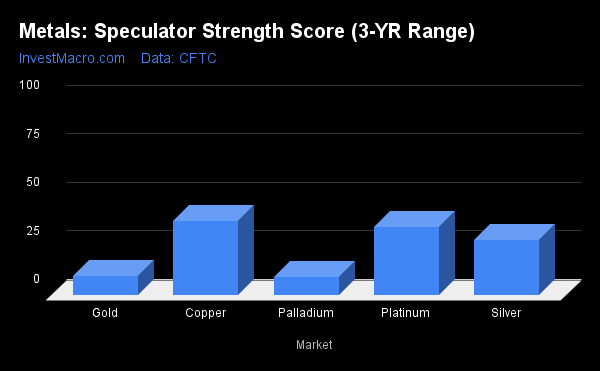
Strength scores (a measure of the 3-Year range of Speculator positions, from 0 to 100 where above 80 is extreme bullish and below 20 is extreme bearish) showed that Copper (38.6 percent) and Platinum (35.2 percent) led the metals category last week. Silver (28.4 percent) comes in as the next highest metals market in strength scores.
On the downside, Palladium (9.7 percent) and Gold (10.0 percent) were at the lowest strength levels currently and in extreme bearish levels.
Strength Statistics:
Gold (10.0 percent) vs Gold previous week (4.2 percent)
Silver (28.4 percent) vs Silver previous week (15.8 percent)
Copper (38.6 percent) vs Copper previous week (30.4 percent)
Platinum (35.2 percent) vs Platinum previous week (30.6 percent)
Palladium (9.7 percent) vs Palladium previous week (12.8 percent)
Strength Trends topped by Platinum & Copper
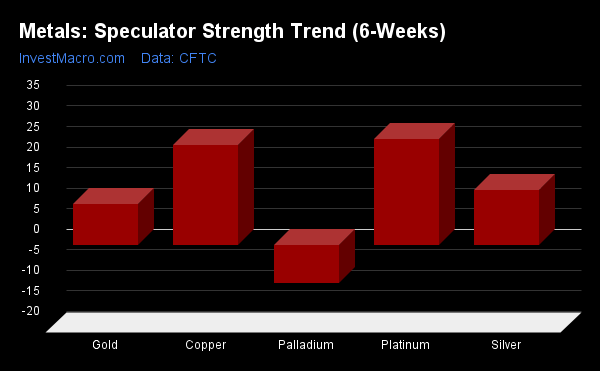
Strength Score Trends (or move index, calculates the 6-week changes in strength scores) showed that Platinum (25.9 percent) and Copper (24.4 percent) led the past six weeks trends for metals this week. Silver (13.5 percent) and Gold (10.0 percent) filled out the other positive movers in the latest trends data.
Palladium (-9.3 percent) was the only market with lower trend scores.
Move Statistics:
Gold (10.0 percent) vs Gold previous week (-0.4 percent)
Silver (13.5 percent) vs Silver previous week (3.5 percent)
Copper (24.4 percent) vs Copper previous week (10.2 percent)
Platinum (25.9 percent) vs Platinum previous week (18.3 percent)
Palladium (-9.3 percent) vs Palladium previous week (-4.6 percent)
Individual Markets:
Gold Comex Futures:
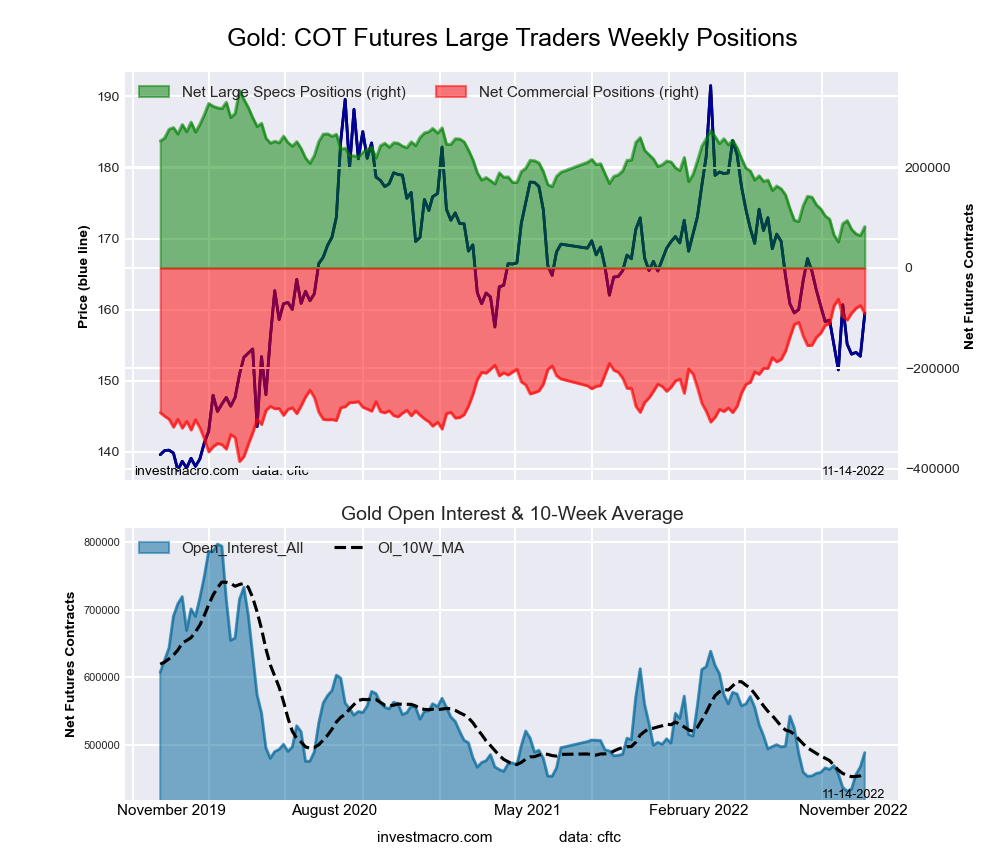 The Gold Comex Futures large speculator standing this week totaled a net position of 82,338 contracts in the data reported through Tuesday. This was a weekly advance of 17,715 contracts from the previous week which had a total of 64,623 net contracts.
This week’s current strength score (the trader positioning range over the past three years, measured from 0 to 100) shows the speculators are currently Bearish-Extreme with a score of 10.0 percent. The commercials are Bullish-Extreme with a score of 91.0 percent and the small traders (not shown in chart) are Bearish-Extreme with a score of 1.6 percent.
| Gold Futures Statistics | SPECULATORS | COMMERCIALS | SMALL TRADERS |
| – Percent of Open Interest Longs: | 45.7 | 25.8 | 7.8 |
| – Percent of Open Interest Shorts: | 28.8 | 44.5 | 6.0 |
| – Net Position: | 82,338 | -91,144 | 8,806 |
| – Gross Longs: | 223,135 | 126,187 | 38,045 |
| – Gross Shorts: | 140,797 | 217,331 | 29,239 |
| – Long to Short Ratio: | 1.6 to 1 | 0.6 to 1 | 1.3 to 1 |
| NET POSITION TREND: | |||
| – Strength Index Score (3 Year Range Pct): | 10.0 | 91.0 | 1.6 |
| – Strength Index Reading (3 Year Range): | Bearish-Extreme | Bullish-Extreme | Bearish-Extreme |
| NET POSITION MOVEMENT INDEX: | |||
| – 6-Week Change in Strength Index: | 10.0 | -9.0 | -3.2 |
Silver Comex Futures:
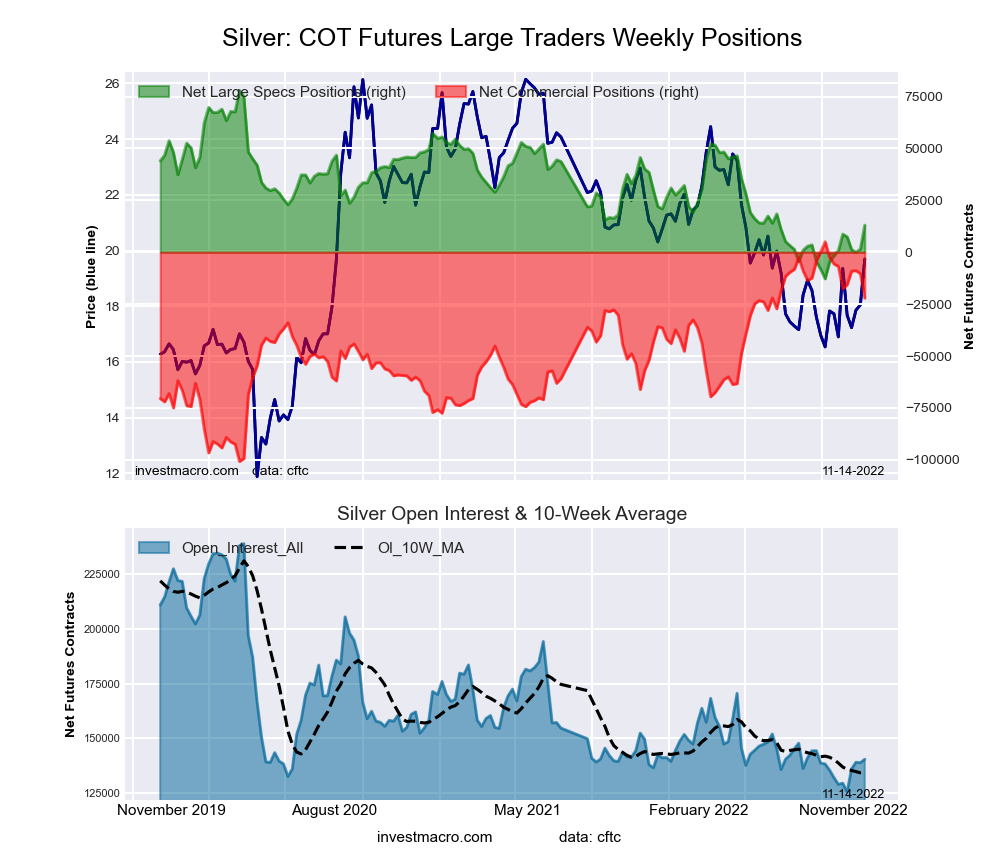 The Silver Comex Futures large speculator standing this week totaled a net position of 13,003 contracts in the data reported through Tuesday. This was a weekly boost of 11,479 contracts from the previous week which had a total of 1,524 net contracts.
This week’s current strength score (the trader positioning range over the past three years, measured from 0 to 100) shows the speculators are currently Bearish with a score of 28.4 percent. The commercials are Bullish with a score of 74.4 percent and the small traders (not shown in chart) are Bearish-Extreme with a score of 14.3 percent.
| Silver Futures Statistics | SPECULATORS | COMMERCIALS | SMALL TRADERS |
| – Percent of Open Interest Longs: | 38.2 | 33.8 | 16.4 |
| – Percent of Open Interest Shorts: | 28.9 | 49.5 | 9.9 |
| – Net Position: | 13,003 | -22,088 | 9,085 |
| – Gross Longs: | 53,651 | 47,451 | 23,040 |
| – Gross Shorts: | 40,648 | 69,539 | 13,955 |
| – Long to Short Ratio: | 1.3 to 1 | 0.7 to 1 | 1.7 to 1 |
| NET POSITION TREND: | |||
| – Strength Index Score (3 Year Range Pct): | 28.4 | 74.4 | 14.3 |
| – Strength Index Reading (3 Year Range): | Bearish | Bullish | Bearish-Extreme |
| NET POSITION MOVEMENT INDEX: | |||
| – 6-Week Change in Strength Index: | 13.5 | -14.4 | 14.3 |
Copper Grade #1 Futures:
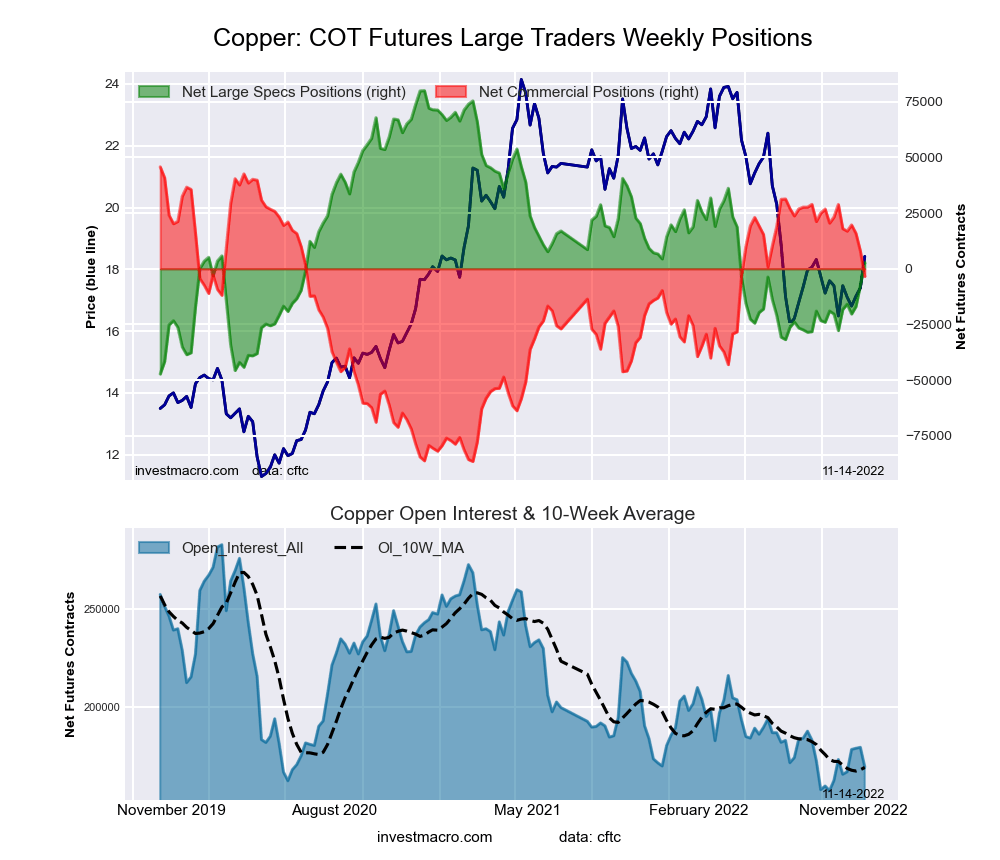 The Copper Grade #1 Futures large speculator standing this week totaled a net position of 2,913 contracts in the data reported through Tuesday. This was a weekly rise of 10,397 contracts from the previous week which had a total of -7,484 net contracts.
This week’s current strength score (the trader positioning range over the past three years, measured from 0 to 100) shows the speculators are currently Bearish with a score of 38.6 percent. The commercials are Bullish with a score of 64.4 percent and the small traders (not shown in chart) are Bearish with a score of 28.3 percent.
| Copper Futures Statistics | SPECULATORS | COMMERCIALS | SMALL TRADERS |
| – Percent of Open Interest Longs: | 32.4 | 37.3 | 9.7 |
| – Percent of Open Interest Shorts: | 30.7 | 39.3 | 9.4 |
| – Net Position: | 2,913 | -3,426 | 513 |
| – Gross Longs: | 55,028 | 63,309 | 16,492 |
| – Gross Shorts: | 52,115 | 66,735 | 15,979 |
| – Long to Short Ratio: | 1.1 to 1 | 0.9 to 1 | 1.0 to 1 |
| NET POSITION TREND: | |||
| – Strength Index Score (3 Year Range Pct): | 38.6 | 64.4 | 28.3 |
| – Strength Index Reading (3 Year Range): | Bearish | Bullish | Bearish |
| NET POSITION MOVEMENT INDEX: | |||
| – 6-Week Change in Strength Index: | 24.4 | -25.0 | 9.5 |
Platinum Futures:
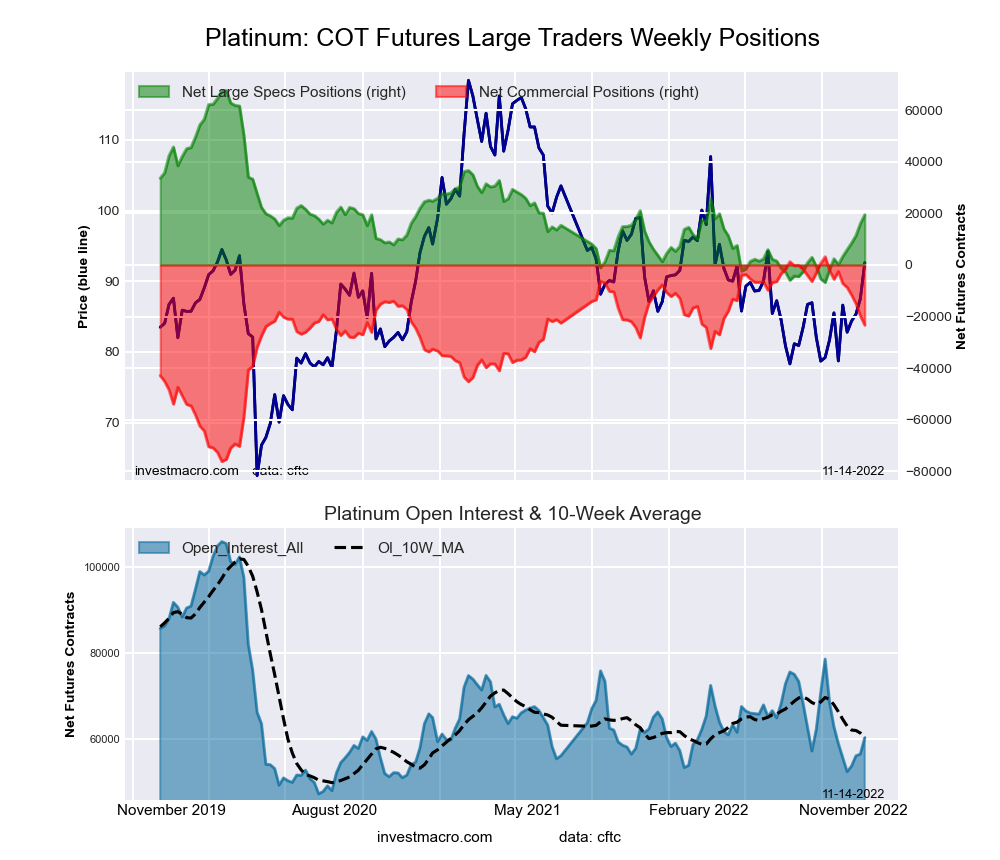 The Platinum Futures large speculator standing this week totaled a net position of 19,449 contracts in the data reported through Tuesday. This was a weekly lift of 3,462 contracts from the previous week which had a total of 15,987 net contracts.
This week’s current strength score (the trader positioning range over the past three years, measured from 0 to 100) shows the speculators are currently Bearish with a score of 35.2 percent. The commercials are Bullish with a score of 66.6 percent and the small traders (not shown in chart) are Bearish-Extreme with a score of 19.7 percent.
| Platinum Futures Statistics | SPECULATORS | COMMERCIALS | SMALL TRADERS |
| – Percent of Open Interest Longs: | 51.5 | 30.2 | 12.4 |
| – Percent of Open Interest Shorts: | 19.3 | 68.8 | 6.0 |
| – Net Position: | 19,449 | -23,295 | 3,846 |
| – Gross Longs: | 31,065 | 18,181 | 7,456 |
| – Gross Shorts: | 11,616 | 41,476 | 3,610 |
| – Long to Short Ratio: | 2.7 to 1 | 0.4 to 1 | 2.1 to 1 |
| NET POSITION TREND: | |||
| – Strength Index Score (3 Year Range Pct): | 35.2 | 66.6 | 19.7 |
| – Strength Index Reading (3 Year Range): | Bearish | Bullish | Bearish-Extreme |
| NET POSITION MOVEMENT INDEX: | |||
| – 6-Week Change in Strength Index: | 25.9 | -26.2 | 19.7 |
Palladium Futures:
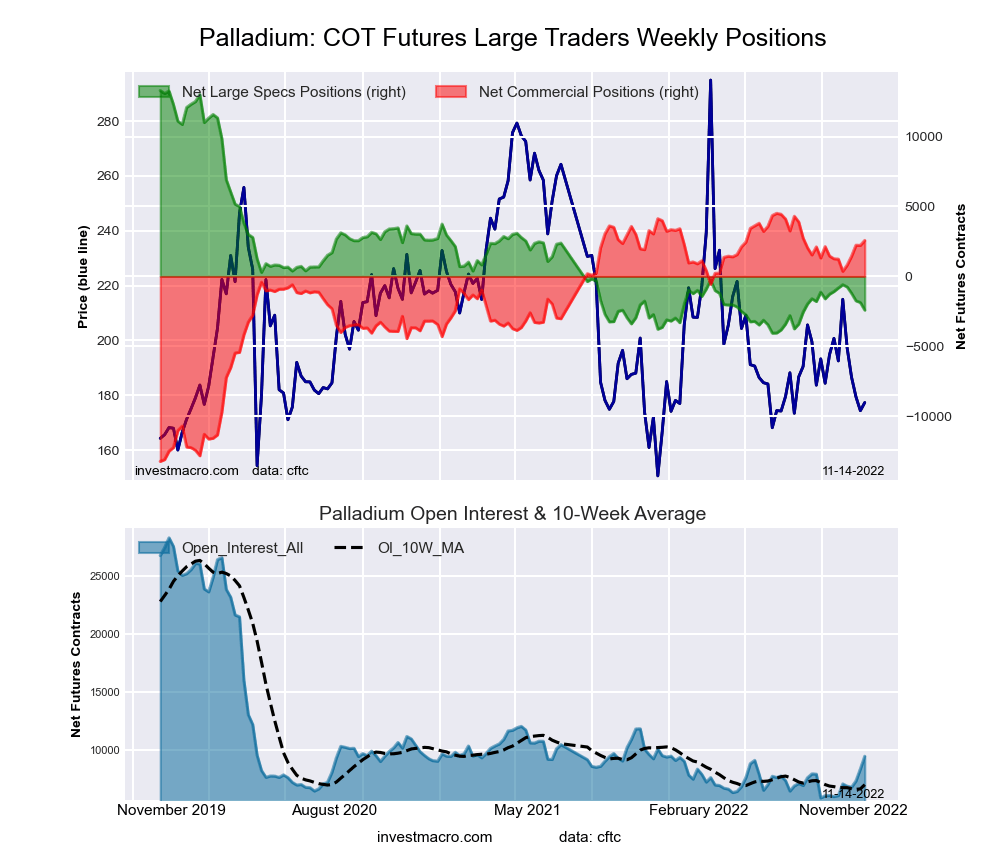 The Palladium Futures large speculator standing this week totaled a net position of -2,410 contracts in the data reported through Tuesday. This was a weekly decline of -543 contracts from the previous week which had a total of -1,867 net contracts.
This week’s current strength score (the trader positioning range over the past three years, measured from 0 to 100) shows the speculators are currently Bearish-Extreme with a score of 9.7 percent. The commercials are Bullish-Extreme with a score of 88.8 percent and the small traders (not shown in chart) are Bearish with a score of 31.9 percent.
| Palladium Futures Statistics | SPECULATORS | COMMERCIALS | SMALL TRADERS |
| – Percent of Open Interest Longs: | 17.6 | 53.7 | 13.0 |
| – Percent of Open Interest Shorts: | 43.1 | 26.5 | 14.7 |
| – Net Position: | -2,410 | 2,573 | -163 |
| – Gross Longs: | 1,667 | 5,085 | 1,226 |
| – Gross Shorts: | 4,077 | 2,512 | 1,389 |
| – Long to Short Ratio: | 0.4 to 1 | 2.0 to 1 | 0.9 to 1 |
| NET POSITION TREND: | |||
| – Strength Index Score (3 Year Range Pct): | 9.7 | 88.8 | 31.9 |
| – Strength Index Reading (3 Year Range): | Bearish-Extreme | Bullish-Extreme | Bearish |
| NET POSITION MOVEMENT INDEX: | |||
| – 6-Week Change in Strength Index: | -9.3 | 7.7 | 14.5 |
Article By InvestMacro – Receive our weekly COT Newsletter
*COT Report: The COT data, released weekly to the public each Friday, is updated through the most recent Tuesday (data is 3 days old) and shows a quick view of how large speculators or non-commercials (for-profit traders) were positioned in the futures markets.
The CFTC categorizes trader positions according to commercial hedgers (traders who use futures contracts for hedging as part of the business), non-commercials (large traders who speculate to realize trading profits) and nonreportable traders (usually small traders/speculators) as well as their open interest (contracts open in the market at time of reporting). See CFTC criteria here.

- Oil prices jumped 4% amid a new wave of escalation between the US and Iran Jul 13, 2026
- EUR/USD: US Inflation Will Determine Everything Jul 13, 2026
- COT Metals Charts: Weekly Speculator Bets see small gains for Silver & Gold Jul 12, 2026
- COT Bonds Charts: Speculator Bets led by SOFR 3-Months & 2-Year Bonds Jul 12, 2026
- COT Energy Charts: Weekly Speculator Changes led by Brent Oil Jul 12, 2026
- COT Soft Commodities Charts: Weekly Speculator Changes led by Sugar, Corn & Soybeans Jul 12, 2026
- The US and European stock indices are rising again amid renewed investor interest in the AI industry. Jul 10, 2026
- USD/JPY Falls as Yen Recovers Weekly Losses Jul 10, 2026
- Crude oil prices surged sharply by 7% in reaction to the rapid escalation of the conflict in the Middle East Jul 9, 2026
- Middle East Tensions Weigh on Gold Jul 9, 2026