By InvestMacro
The latest update for the weekly Commitment of Traders (COT) report was released by the Commodity Futures Trading Commission (CFTC) on Friday for data ending on November 1st.
This weekly Extreme Positions report highlights the Top Most Bullish and Top Most Bearish Positions for the speculator category. Extreme positioning in these markets can foreshadow strong moves in the underlying market.
To signify an extreme position, we use the Strength Index (also known as the COT Index) of each instrument, a common method of measuring COT data. The Strength Index is simply a comparison of current trader positions against the range of positions over the previous 3 years. We use over 80 percent as extremely bullish and under 20 percent as extremely bearish.
Compare Strength Index scores across all markets in the COT data table or COT leaders table.
Here Are This Week’s Most Bullish Speculator Positions:
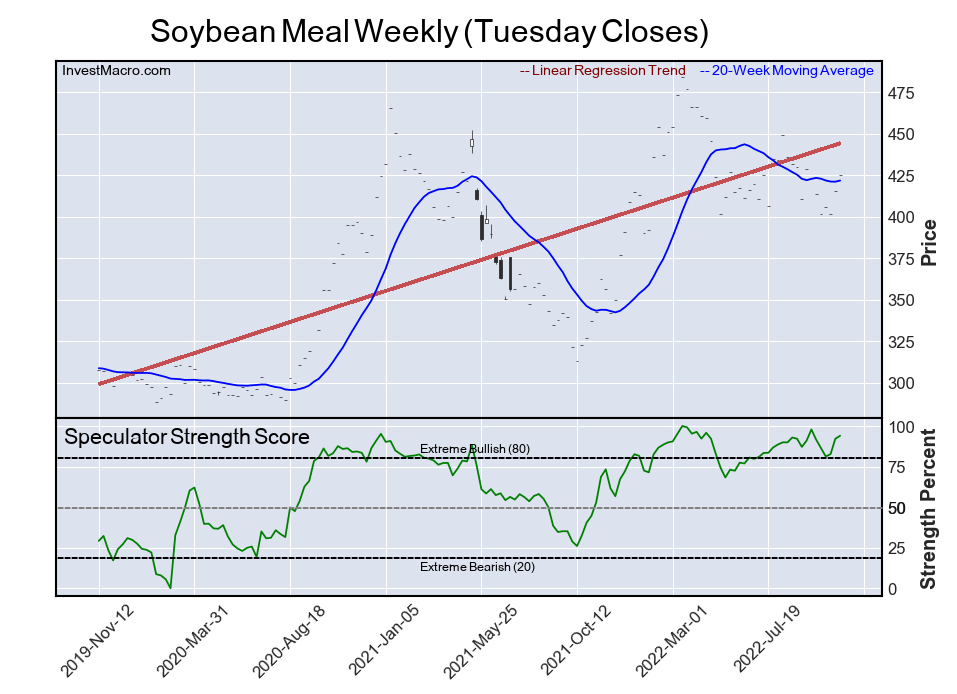
Soybean Meal
Free Reports:
 Get our Weekly Commitment of Traders Reports - See where the biggest traders (Hedge Funds and Commercial Hedgers) are positioned in the futures markets on a weekly basis.
 Download Our Metatrader 4 Indicators – Put Our Free MetaTrader 4 Custom Indicators on your charts when you join our Weekly Newsletter
The Soybean Meal speculator position comes in as the most bullish extreme standing this week. The Soybean Meal speculator level is currently at a 94.0 percent score of its 3-year range.
The overall net speculator position totaled 119,508 net contracts this week and has been over the +100,000 net contract level in fifteen out of the past seventeen weeks.
Bloomberg Commodity Index
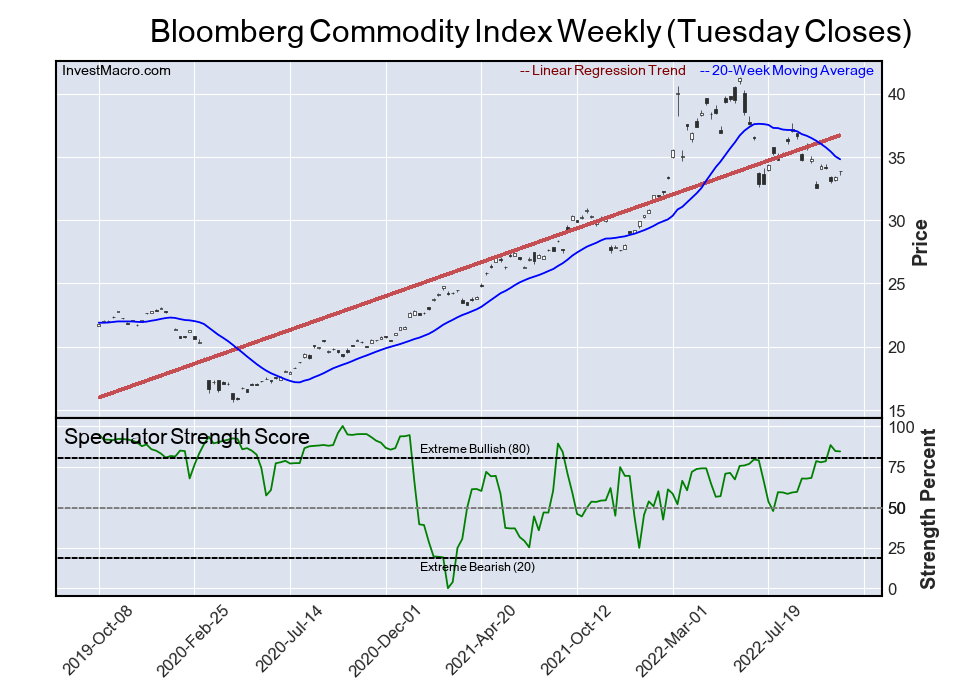
The Bloomberg Commodity Index speculator position comes in as the only other market above 80 percent in the extreme standings this week. The Bloomberg Commodity Index speculator level is now at a 84.3 percent score of its 3-year range.
The speculator position was a total of -6,047 net contracts this week. This market usually has an overall bearish positioning for speculators and this week’s position is near the lowest levels of the past three years.
This Week’s Most Bearish Speculator Positions:
Wheat
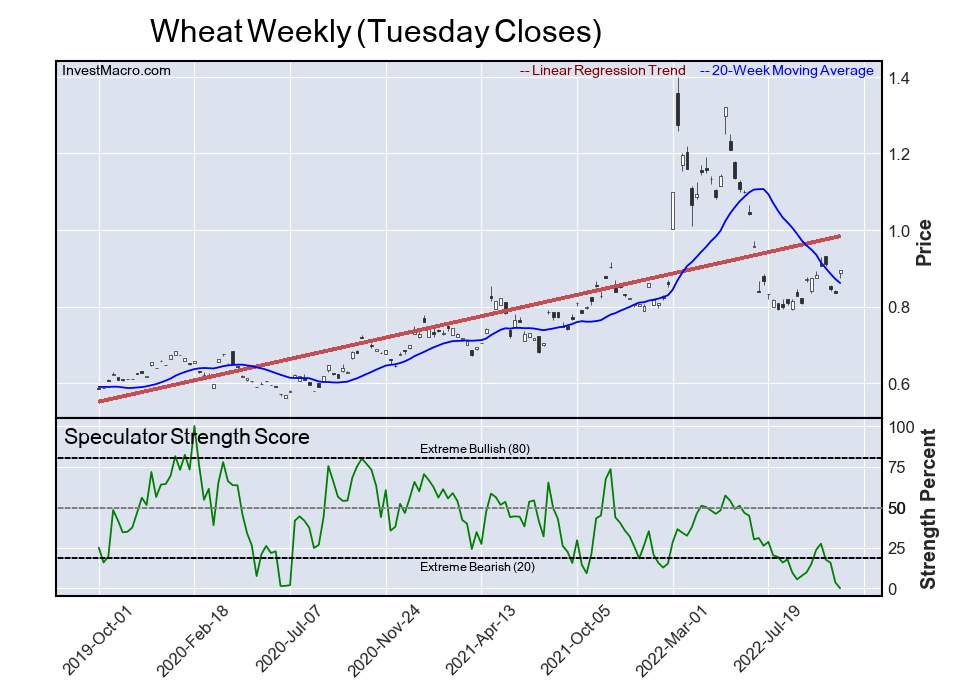
The Wheat speculator position comes in as the most bearish extreme standing this week. The Wheat speculator level is at 0.0 percent score or at the absolute bottom of its 3-year range.
The speculator position was -15,766 net contracts this week and the overall position is in bearish territory for the twelfth time out of the past fourteen weeks. Wheat prices continue to be in an uptrend but the speculator sentiment has fallen sharply from earlier in the year.
2-Year Bond
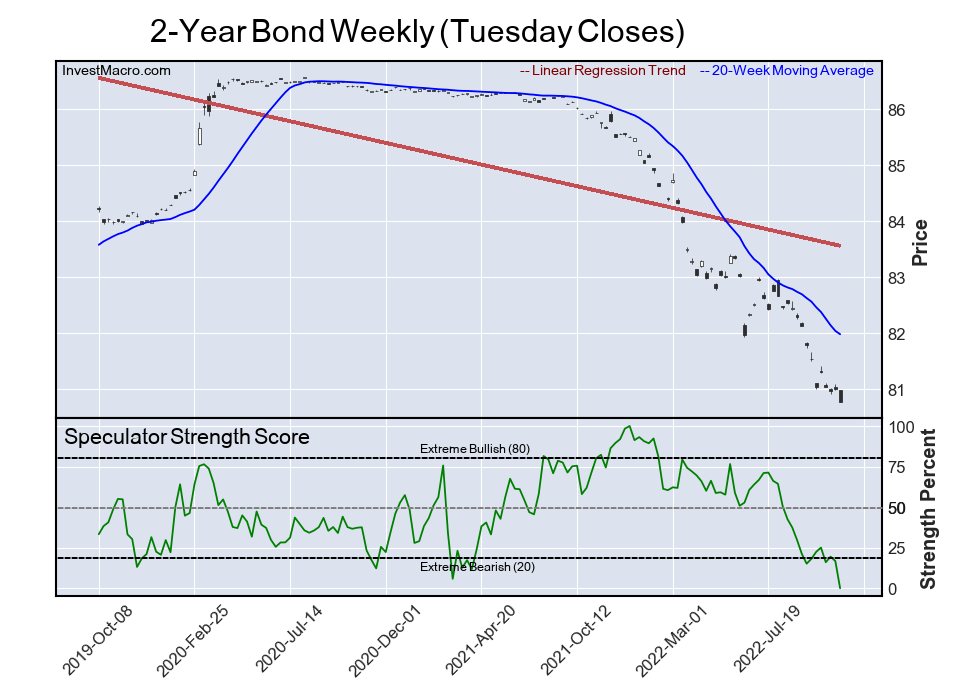
The 2-Year Bond speculator position comes in as the most bearish extreme standing this week as well. The 2-Year Bond speculator level is at the 0.0 percent score of its 3-year range.
The speculator position was a total of -437,785 net contracts this week and hit the most bearish level on record this week as the US Federal Reserve continued to raise its benchmark interest rate.
Gold
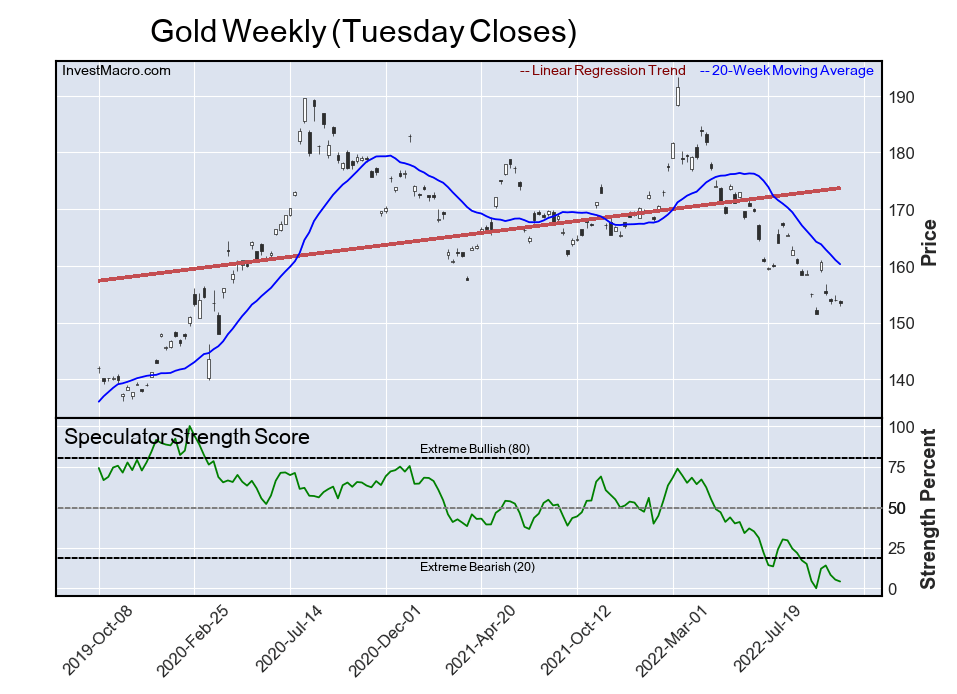
The Gold speculator position comes in next for the most bearish extreme standing on the week. The Gold speculator level is at a 4.2 percent score of its 3-year range.
The speculator position was 64,623 net contracts this week and has now been under +100,000 net contracts for eight straight weeks which has not happened since 2018.
5-Year Bond
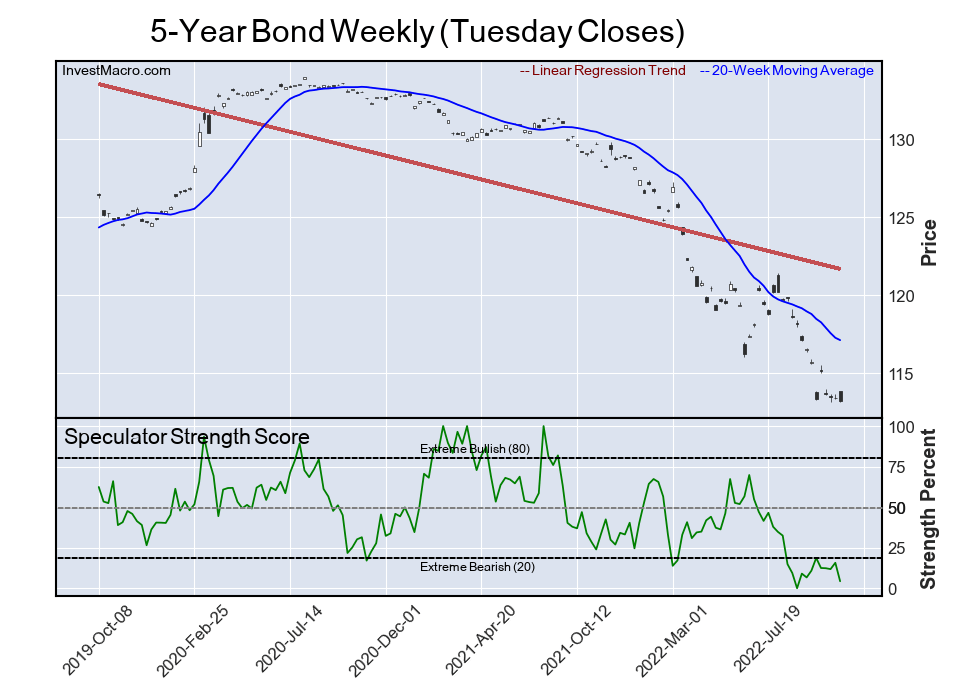
The 5-Year Bond speculator position comes in as the most bearish extreme standing this week. The 5-Year Bond speculator level is at 4.3 percent score of its 3-year range.
The speculator position was -536,987 net contracts this week and joins all the other bond markets we cover that have negative or bearish net positioning at the moment.
Ultra 10-Year U.S. T-Note
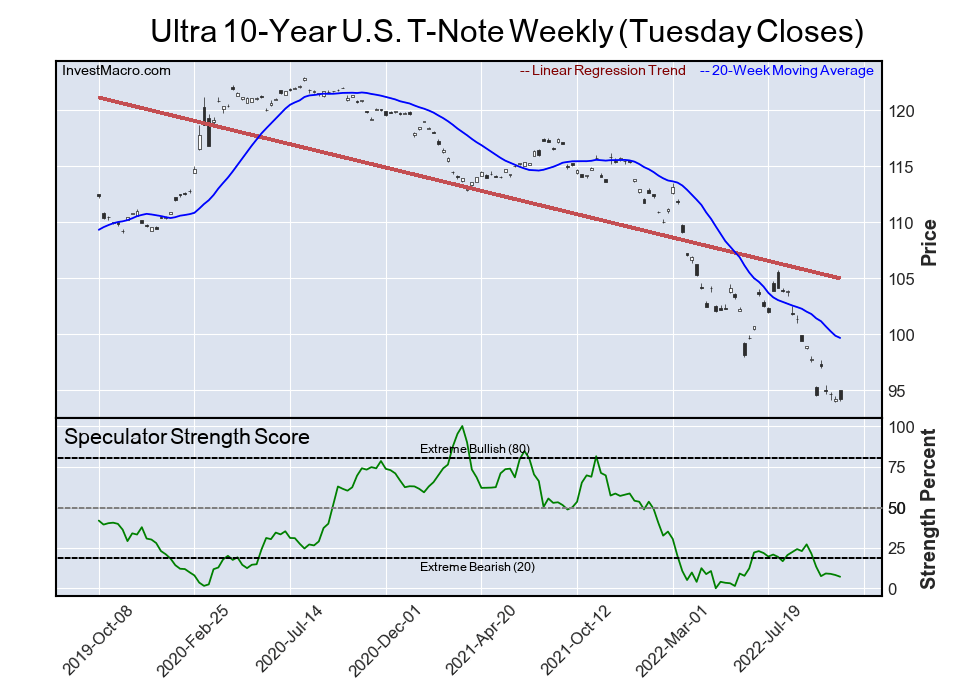
The Ultra 10-Year U.S. T-Note speculator position comes in as the next market in the most bearish extreme standing. The Ultra 10-Year U.S. T-Note speculator level is at a 7.1 percent score of its 3-year range.
The speculator position was -83,431 net contracts this week.
Article By InvestMacro – Receive our weekly COT Newsletter
*COT Report: The COT data, released weekly to the public each Friday, is updated through the most recent Tuesday (data is 3 days old) and shows a quick view of how large speculators or non-commercials (for-profit traders) were positioned in the futures markets.
The CFTC categorizes trader positions according to commercial hedgers (traders who use futures contracts for hedging as part of the business), non-commercials (large traders who speculate to realize trading profits) and nonreportable traders (usually small traders/speculators) as well as their open interest (contracts open in the market at time of reporting). See CFTC criteria here.

- COT Metals Charts: Weekly Speculator Bets led by Copper & Steel Jul 18, 2026
- COT Bonds Charts: Weekly Speculator Bets led by 2-Year, SOFR 3M & 5-Year Bonds Jul 18, 2026
- COT Energy Charts: Weekly Speculator Bets led by Brent Oil & Heating Oil Jul 18, 2026
- COT Soft Commodities Charts: Weekly Speculator Bets led by Wheat, Corn & Soybean Meal Jul 18, 2026
- The Bank of Canada kept its interest rate unchanged. Platinum prices reached a three‑week high Jul 16, 2026
- Stock indices rose after the release of US inflation data. China’s GDP slowed sharply Jul 15, 2026
- GBP/USD Awaits Political News: What Will Happen Next Jul 15, 2026
- USD/JPY Holds at Highs: Pressure Lingers on Yen Jul 14, 2026
- Oil prices jumped 4% amid a new wave of escalation between the US and Iran Jul 13, 2026
- EUR/USD: US Inflation Will Determine Everything Jul 13, 2026