
By InvestMacro
Here are the latest charts and statistics for the Commitment of Traders (COT) data published by the Commodities Futures Trading Commission (CFTC). The COT release was delayed due to a Federal Holiday last week.
The latest COT data is updated through Tuesday November 8th and shows a quick view of how large traders (for-profit speculators and commercial hedgers) were positioned in the futures markets.
WTI Crude Oil & Heating Oil lead the Weekly Speculator Changes
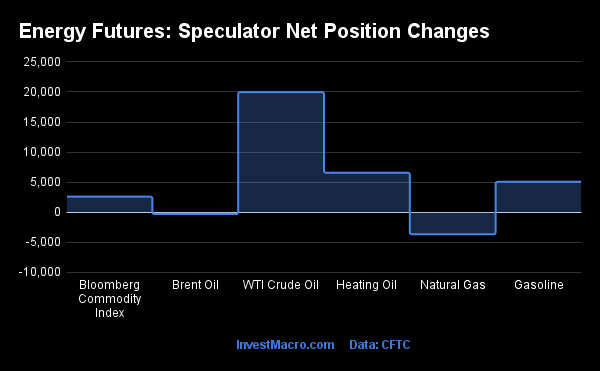
The COT energy market speculator bets were higher last week as four out of the six energy markets we cover had higher positioning this week while the other two markets had lower contracts.
Free Reports:
 Download Our Metatrader 4 Indicators – Put Our Free MetaTrader 4 Custom Indicators on your charts when you join our Weekly Newsletter
 Get our Weekly Commitment of Traders Reports - See where the biggest traders (Hedge Funds and Commercial Hedgers) are positioned in the futures markets on a weekly basis.
Leading the gains for energy markets was WTI Crude Oil (19,981 contracts) with Heating Oil (6,578 contracts), Gasoline (5,069 contracts) and Bloomberg Commodity Index (2,608 contracts) also showing positive weeks.
The energy markets leading the declines in speculator bets this week was Natural Gas (-3,655 contracts) with Brent Crude Oil (-293 contracts) also registering lower bets on the week.
| Nov-08-2022 | OI | OI-Index | Spec-Net | Spec-Index | Com-Net | COM-Index | Smalls-Net | Smalls-Index |
|---|---|---|---|---|---|---|---|---|
| WTI Crude | 1,446,658 | 1 | 274,790 | 17 | -301,325 | 83 | 26,535 | 43 |
| Gold | 488,471 | 16 | 82,338 | 10 | -91,144 | 91 | 8,806 | 2 |
| Silver | 140,437 | 13 | 13,003 | 28 | -22,088 | 74 | 9,085 | 14 |
| Copper | 169,929 | 10 | 2,913 | 39 | -3,426 | 64 | 513 | 28 |
| Palladium | 9,467 | 17 | -2,410 | 10 | 2,573 | 89 | -163 | 32 |
| Platinum | 60,301 | 22 | 19,449 | 35 | -23,295 | 67 | 3,846 | 20 |
| Natural Gas | 982,596 | 7 | -152,308 | 33 | 120,222 | 69 | 32,086 | 56 |
| Brent | 135,078 | 1 | -22,201 | 74 | 18,085 | 23 | 4,116 | 65 |
| Heating Oil | 266,730 | 23 | 27,958 | 84 | -51,059 | 17 | 23,101 | 78 |
| Soybeans | 611,011 | 8 | 87,809 | 40 | -60,966 | 68 | -26,843 | 26 |
| Corn | 1,484,427 | 31 | 301,554 | 69 | -254,182 | 36 | -47,372 | 16 |
| Coffee | 217,646 | 25 | -4,683 | 4 | 1,912 | 100 | 2,771 | 38 |
| Sugar | 766,340 | 14 | 90,182 | 44 | -122,561 | 56 | 32,379 | 48 |
| Wheat | 350,843 | 27 | -17,214 | 0 | 23,686 | 93 | -6,472 | 77 |
Bloomberg Commodity Index & Heating Oil lead the Strength Scores
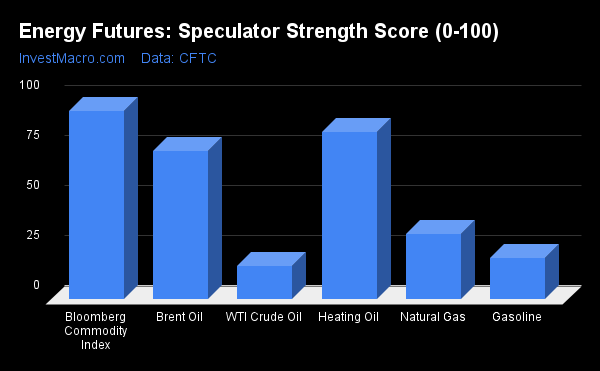
Strength Scores (a normalized measure of Speculator positions over a 3-Year range, from 0 to 100 where above 80 is extreme bullish and below 20 is extreme bearish) showed that the Bloomberg Commodity Index (94.3 percent) and Heating Oil (83.6 percent) lead the energy category and are both in bullish extreme positions (above 80 percent). Brent Crude Oil (74.0 percent) comes in as the next highest energy market in strength scores.
On the downside, WTI Crude Oil (16.9 percent) comes in at the lowest strength level currently and is followed by Gasoline (20.8 percent).
Strength Statistics:
WTI Crude Oil (16.9 percent) vs WTI Crude Oil previous week (11.7 percent)
Brent Crude Oil (74.0 percent) vs Brent Crude Oil previous week (74.5 percent)
Natural Gas (32.9 percent) vs Natural Gas previous week (33.9 percent)
Gasoline (20.8 percent) vs Gasoline previous week (15.7 percent)
Heating Oil (83.6 percent) vs Heating Oil previous week (73.9 percent)
Bloomberg Commodity Index (94.3 percent) vs Bloomberg Commodity Index previous week (84.3 percent)
Brent Crude Oil & Heating Oil top the Strength Trends
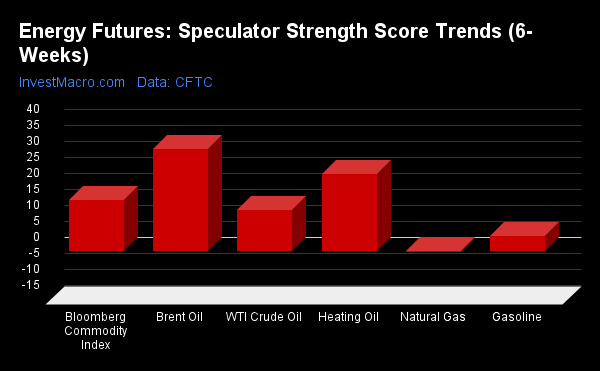
Strength Score Trends (or move index, calculates the 6-week changes in strength scores) show that Brent Crude Oil (32.0 percent) leads the past six weeks trends for energy this week. Heating Oil (24.3 percent), the Bloomberg Commodity Index (16.0 percent) and WTI Crude Oil (12.9 percent) fill out the next top movers in the latest trends data.
Natural Gas (-0.1 percent) came in as the only market with lower trend scores for last week.
Strength Trend Statistics:
WTI Crude Oil (12.9 percent) vs WTI Crude Oil previous week (3.9 percent)
Brent Crude Oil (32.0 percent) vs Brent Crude Oil previous week (26.9 percent)
Natural Gas (-0.1 percent) vs Natural Gas previous week (2.1 percent)
Gasoline (4.7 percent) vs Gasoline previous week (-3.4 percent)
Heating Oil (24.3 percent) vs Heating Oil previous week (10.7 percent)
Bloomberg Commodity Index (16.0 percent) vs Bloomberg Commodity Index previous week (16.3 percent)
Individual COT Market Charts:
WTI Crude Oil Futures:
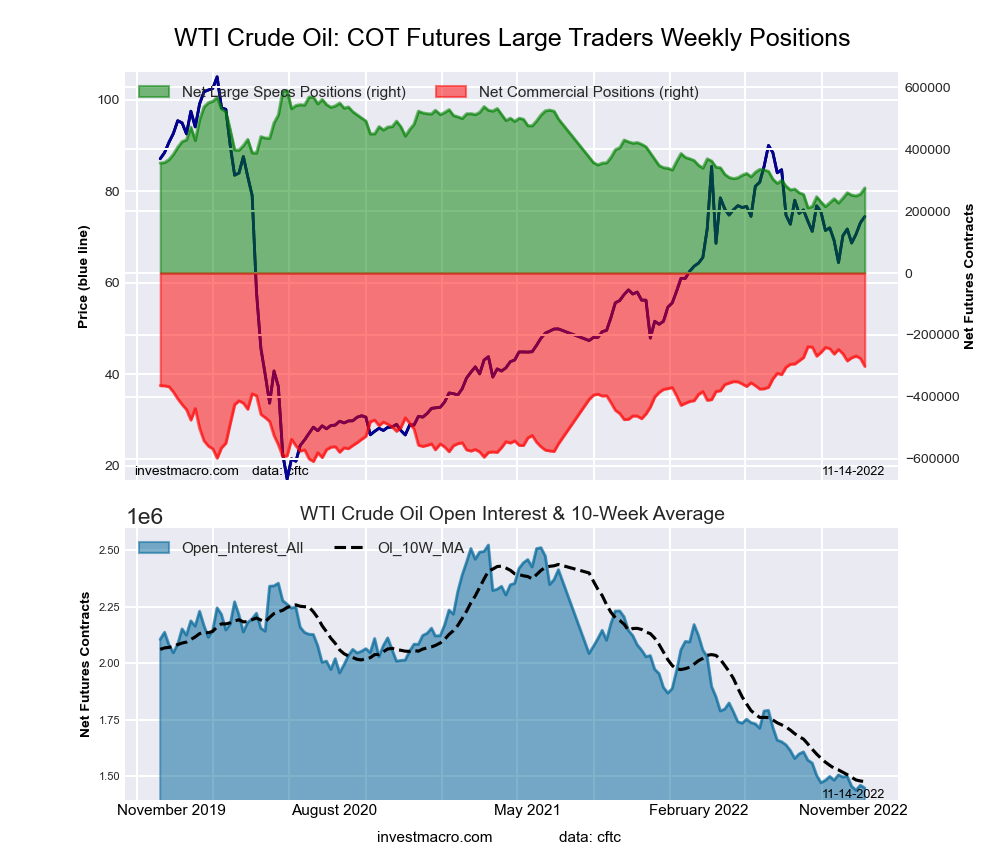 The WTI Crude Oil Futures large speculator standing this week was a net position of 274,790 contracts in the data reported through Tuesday. This was a weekly boost of 19,981 contracts from the previous week which had a total of 254,809 net contracts.
This week’s current strength score (the trader positioning range over the past three years, measured from 0 to 100) shows the speculators are currently Bearish-Extreme with a score of 16.9 percent. The commercials are Bullish-Extreme with a score of 82.9 percent and the small traders (not shown in chart) are Bearish with a score of 43.2 percent.
| WTI Crude Oil Futures Statistics | SPECULATORS | COMMERCIALS | SMALL TRADERS |
| – Percent of Open Interest Longs: | 25.5 | 38.1 | 5.4 |
| – Percent of Open Interest Shorts: | 6.5 | 59.0 | 3.5 |
| – Net Position: | 274,790 | -301,325 | 26,535 |
| – Gross Longs: | 368,585 | 551,749 | 77,784 |
| – Gross Shorts: | 93,795 | 853,074 | 51,249 |
| – Long to Short Ratio: | 3.9 to 1 | 0.6 to 1 | 1.5 to 1 |
| NET POSITION TREND: | |||
| – Strength Index Score (3 Year Range Pct): | 16.9 | 82.9 | 43.2 |
| – Strength Index Reading (3 Year Range): | Bearish-Extreme | Bullish-Extreme | Bearish |
| NET POSITION MOVEMENT INDEX: | |||
| – 6-Week Change in Strength Index: | 12.9 | -14.7 | 9.7 |
Brent Crude Oil Futures:
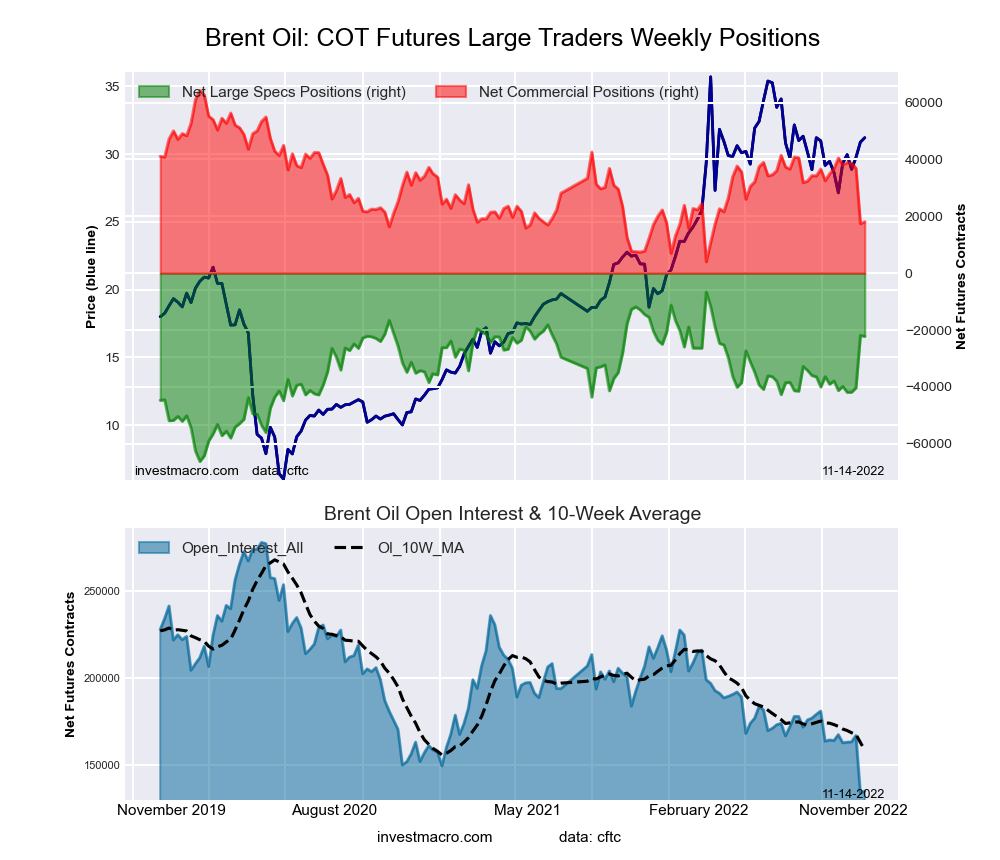 The Brent Crude Oil Futures large speculator standing this week was a net position of -22,201 contracts in the data reported through Tuesday. This was a weekly fall of -293 contracts from the previous week which had a total of -21,908 net contracts.
This week’s current strength score (the trader positioning range over the past three years, measured from 0 to 100) shows the speculators are currently Bullish with a score of 74.0 percent. The commercials are Bearish with a score of 23.4 percent and the small traders (not shown in chart) are Bullish with a score of 64.9 percent.
| Brent Crude Oil Futures Statistics | SPECULATORS | COMMERCIALS | SMALL TRADERS |
| – Percent of Open Interest Longs: | 23.1 | 44.3 | 6.8 |
| – Percent of Open Interest Shorts: | 39.5 | 30.9 | 3.7 |
| – Net Position: | -22,201 | 18,085 | 4,116 |
| – Gross Longs: | 31,215 | 59,785 | 9,133 |
| – Gross Shorts: | 53,416 | 41,700 | 5,017 |
| – Long to Short Ratio: | 0.6 to 1 | 1.4 to 1 | 1.8 to 1 |
| NET POSITION TREND: | |||
| – Strength Index Score (3 Year Range Pct): | 74.0 | 23.4 | 64.9 |
| – Strength Index Reading (3 Year Range): | Bullish | Bearish | Bullish |
| NET POSITION MOVEMENT INDEX: | |||
| – 6-Week Change in Strength Index: | 32.0 | -37.2 | 45.3 |
Natural Gas Futures:
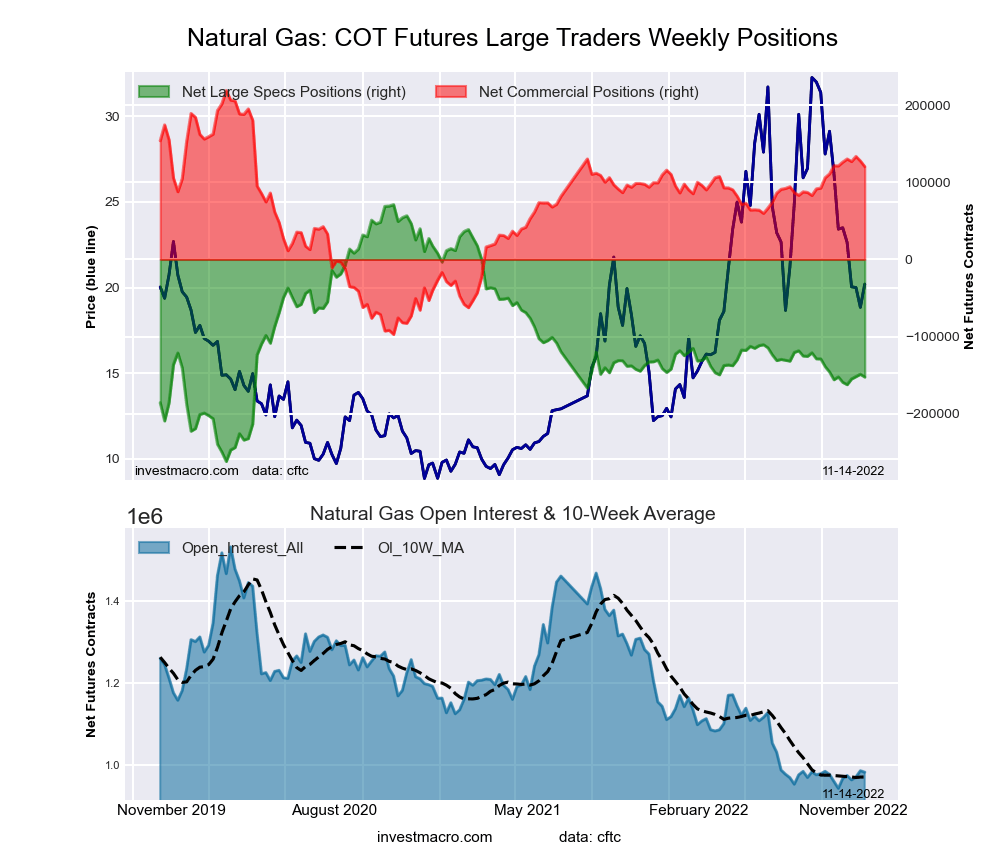 The Natural Gas Futures large speculator standing this week was a net position of -152,308 contracts in the data reported through Tuesday. This was a weekly reduction of -3,655 contracts from the previous week which had a total of -148,653 net contracts.
This week’s current strength score (the trader positioning range over the past three years, measured from 0 to 100) shows the speculators are currently Bearish with a score of 32.9 percent. The commercials are Bullish with a score of 68.8 percent and the small traders (not shown in chart) are Bullish with a score of 56.1 percent.
| Natural Gas Futures Statistics | SPECULATORS | COMMERCIALS | SMALL TRADERS |
| – Percent of Open Interest Longs: | 13.6 | 45.6 | 6.9 |
| – Percent of Open Interest Shorts: | 29.1 | 33.4 | 3.6 |
| – Net Position: | -152,308 | 120,222 | 32,086 |
| – Gross Longs: | 133,199 | 448,264 | 67,376 |
| – Gross Shorts: | 285,507 | 328,042 | 35,290 |
| – Long to Short Ratio: | 0.5 to 1 | 1.4 to 1 | 1.9 to 1 |
| NET POSITION TREND: | |||
| – Strength Index Score (3 Year Range Pct): | 32.9 | 68.8 | 56.1 |
| – Strength Index Reading (3 Year Range): | Bearish | Bullish | Bullish |
| NET POSITION MOVEMENT INDEX: | |||
| – 6-Week Change in Strength Index: | -0.1 | -0.3 | 2.6 |
Gasoline Blendstock Futures:
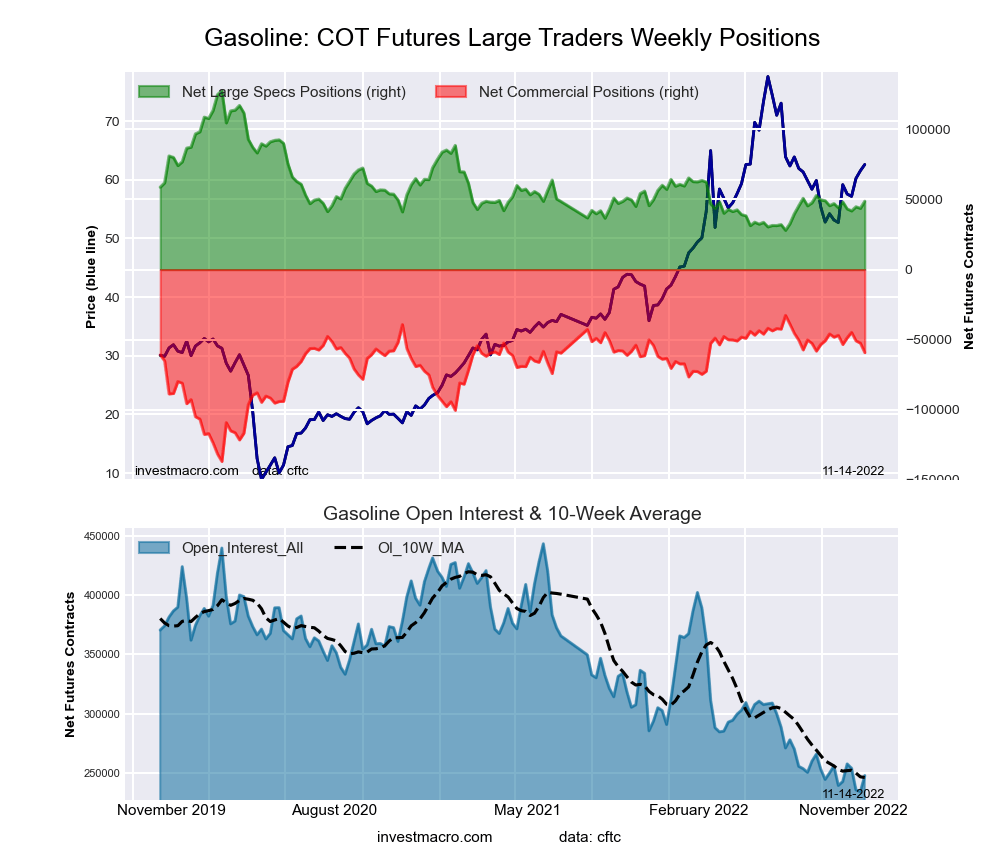 The Gasoline Blendstock Futures large speculator standing this week was a net position of 48,753 contracts in the data reported through Tuesday. This was a weekly rise of 5,069 contracts from the previous week which had a total of 43,684 net contracts.
This week’s current strength score (the trader positioning range over the past three years, measured from 0 to 100) shows the speculators are currently Bearish with a score of 20.8 percent. The commercials are Bullish with a score of 74.5 percent and the small traders (not shown in chart) are Bullish-Extreme with a score of 82.5 percent.
| Nasdaq Mini Futures Statistics | SPECULATORS | COMMERCIALS | SMALL TRADERS |
| – Percent of Open Interest Longs: | 33.6 | 45.0 | 9.0 |
| – Percent of Open Interest Shorts: | 13.9 | 68.9 | 4.8 |
| – Net Position: | 48,753 | -59,226 | 10,473 |
| – Gross Longs: | 83,270 | 111,348 | 22,245 |
| – Gross Shorts: | 34,517 | 170,574 | 11,772 |
| – Long to Short Ratio: | 2.4 to 1 | 0.7 to 1 | 1.9 to 1 |
| NET POSITION TREND: | |||
| – Strength Index Score (3 Year Range Pct): | 20.8 | 74.5 | 82.5 |
| – Strength Index Reading (3 Year Range): | Bearish | Bullish | Bullish-Extreme |
| NET POSITION MOVEMENT INDEX: | |||
| – 6-Week Change in Strength Index: | 4.7 | -11.8 | 50.8 |
#2 Heating Oil NY-Harbor Futures:
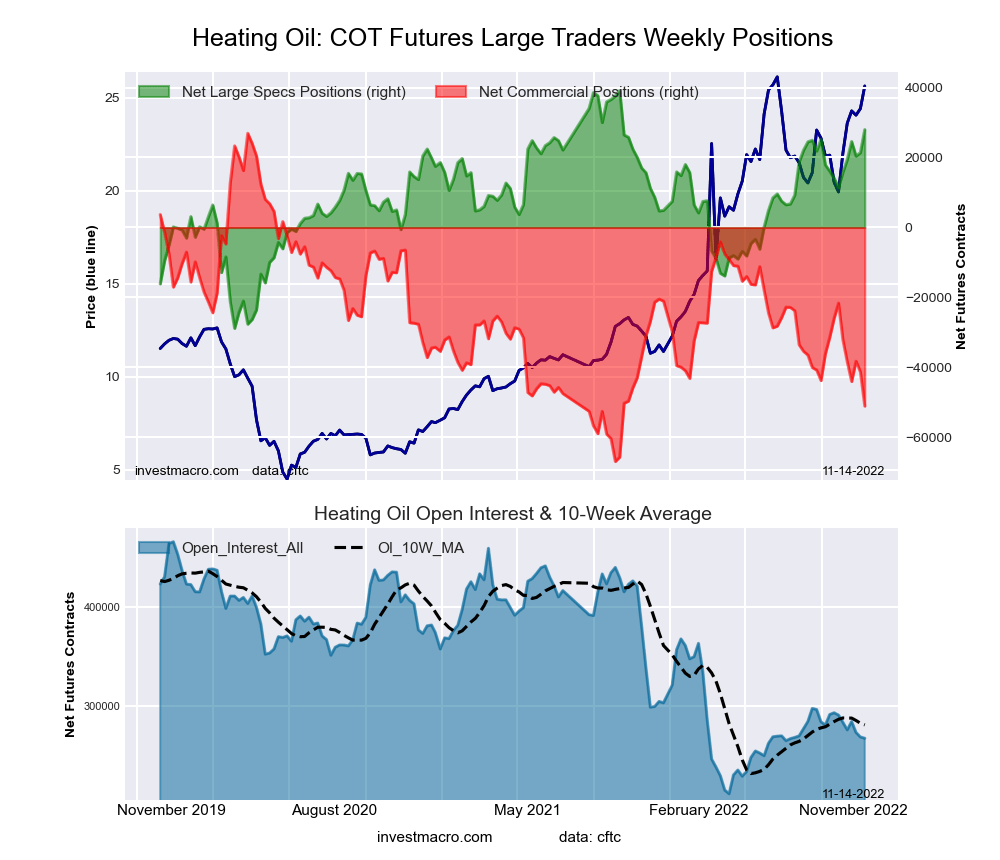 The #2 Heating Oil NY-Harbor Futures large speculator standing this week was a net position of 27,958 contracts in the data reported through Tuesday. This was a weekly gain of 6,578 contracts from the previous week which had a total of 21,380 net contracts.
This week’s current strength score (the trader positioning range over the past three years, measured from 0 to 100) shows the speculators are currently Bullish-Extreme with a score of 83.6 percent. The commercials are Bearish-Extreme with a score of 16.9 percent and the small traders (not shown in chart) are Bullish with a score of 78.4 percent.
| Heating Oil Futures Statistics | SPECULATORS | COMMERCIALS | SMALL TRADERS |
| – Percent of Open Interest Longs: | 17.6 | 41.5 | 17.8 |
| – Percent of Open Interest Shorts: | 7.1 | 60.7 | 9.1 |
| – Net Position: | 27,958 | -51,059 | 23,101 |
| – Gross Longs: | 46,818 | 110,820 | 47,495 |
| – Gross Shorts: | 18,860 | 161,879 | 24,394 |
| – Long to Short Ratio: | 2.5 to 1 | 0.7 to 1 | 1.9 to 1 |
| NET POSITION TREND: | |||
| – Strength Index Score (3 Year Range Pct): | 83.6 | 16.9 | 78.4 |
| – Strength Index Reading (3 Year Range): | Bullish-Extreme | Bearish-Extreme | Bullish |
| NET POSITION MOVEMENT INDEX: | |||
| – 6-Week Change in Strength Index: | 24.3 | -31.4 | 44.7 |
Bloomberg Commodity Index Futures:
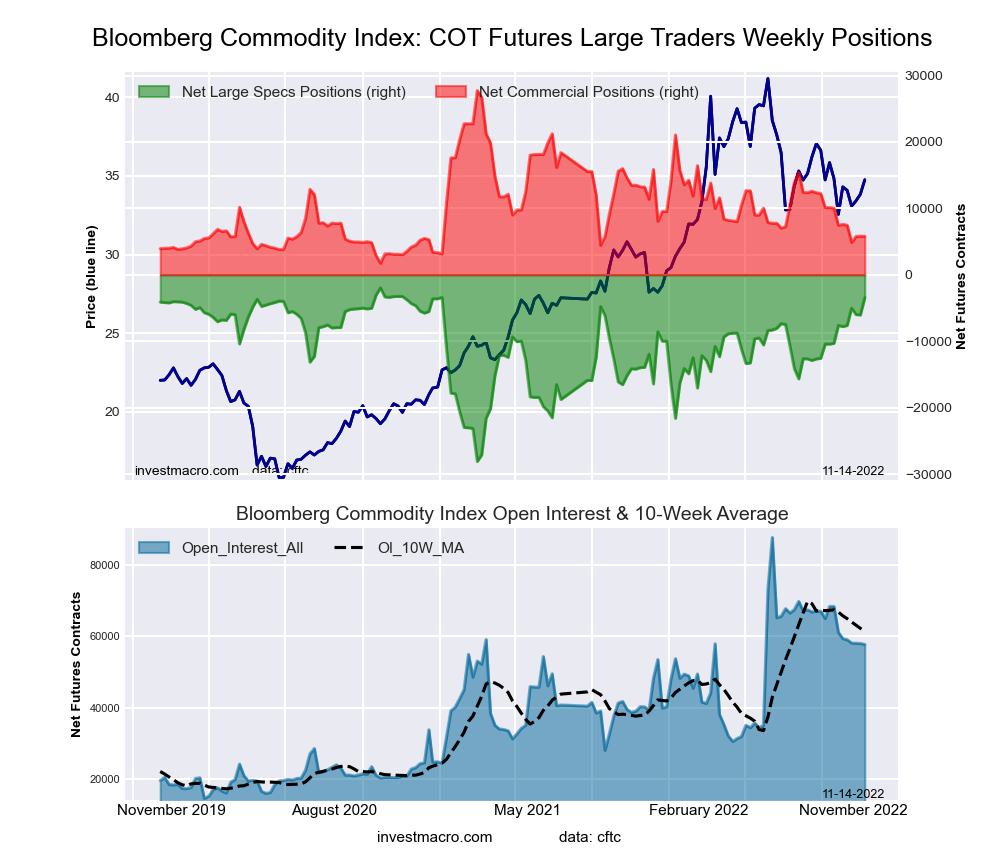 The Bloomberg Commodity Index Futures large speculator standing this week was a net position of -3,439 contracts in the data reported through Tuesday. This was a weekly boost of 2,608 contracts from the previous week which had a total of -6,047 net contracts.
This week’s current strength score (the trader positioning range over the past three years, measured from 0 to 100) shows the speculators are currently Bullish-Extreme with a score of 94.3 percent. The commercials are Bearish-Extreme with a score of 15.6 percent and the small traders (not shown in chart) are Bearish-Extreme with a score of 0.0 percent.
| Bloomberg Index Futures Statistics | SPECULATORS | COMMERCIALS | SMALL TRADERS |
| – Percent of Open Interest Longs: | 21.3 | 75.2 | 0.6 |
| – Percent of Open Interest Shorts: | 27.2 | 65.2 | 4.7 |
| – Net Position: | -3,439 | 5,797 | -2,358 |
| – Gross Longs: | 12,268 | 43,434 | 373 |
| – Gross Shorts: | 15,707 | 37,637 | 2,731 |
| – Long to Short Ratio: | 0.8 to 1 | 1.2 to 1 | 0.1 to 1 |
| NET POSITION TREND: | |||
| – Strength Index Score (3 Year Range Pct): | 94.3 | 15.6 | 0.0 |
| – Strength Index Reading (3 Year Range): | Bullish-Extreme | Bearish-Extreme | Bearish-Extreme |
| NET POSITION MOVEMENT INDEX: | |||
| – 6-Week Change in Strength Index: | 16.0 | -6.3 | -54.6 |
Article By InvestMacro – Receive our weekly COT Newsletter
*COT Report: The COT data, released weekly to the public each Friday, is updated through the most recent Tuesday (data is 3 days old) and shows a quick view of how large speculators or non-commercials (for-profit traders) were positioned in the futures markets.
The CFTC categorizes trader positions according to commercial hedgers (traders who use futures contracts for hedging as part of the business), non-commercials (large traders who speculate to realize trading profits) and nonreportable traders (usually small traders/speculators) as well as their open interest (contracts open in the market at time of reporting). See CFTC criteria here.

- COT Metals Charts: Weekly Speculator Bets led by Copper & Steel Jul 18, 2026
- COT Bonds Charts: Weekly Speculator Bets led by 2-Year, SOFR 3M & 5-Year Bonds Jul 18, 2026
- COT Energy Charts: Weekly Speculator Bets led by Brent Oil & Heating Oil Jul 18, 2026
- COT Soft Commodities Charts: Weekly Speculator Bets led by Wheat, Corn & Soybean Meal Jul 18, 2026
- The Bank of Canada kept its interest rate unchanged. Platinum prices reached a three‑week high Jul 16, 2026
- Stock indices rose after the release of US inflation data. China’s GDP slowed sharply Jul 15, 2026
- GBP/USD Awaits Political News: What Will Happen Next Jul 15, 2026
- USD/JPY Holds at Highs: Pressure Lingers on Yen Jul 14, 2026
- Oil prices jumped 4% amid a new wave of escalation between the US and Iran Jul 13, 2026
- EUR/USD: US Inflation Will Determine Everything Jul 13, 2026