
By InvestMacro
Here are the latest charts and statistics for the Commitment of Traders (COT) data published by the Commodities Futures Trading Commission (CFTC). The COT release was delayed due to a Federal Holiday last week.
The latest COT data is updated through Tuesday November 8th and shows a quick view of how large traders (for-profit speculators and commercial hedgers) were positioned in the futures markets.
Weekly Speculator Changes led by Fed Funds & 5-Year Bond
The COT bond market speculator bets were higher last week as six out of the eight bond markets we cover had higher positioning this week while two markets had lower contracts.
Free Reports:
 Download Our Metatrader 4 Indicators – Put Our Free MetaTrader 4 Custom Indicators on your charts when you join our Weekly Newsletter
 Get our Weekly Commitment of Traders Reports - See where the biggest traders (Hedge Funds and Commercial Hedgers) are positioned in the futures markets on a weekly basis.
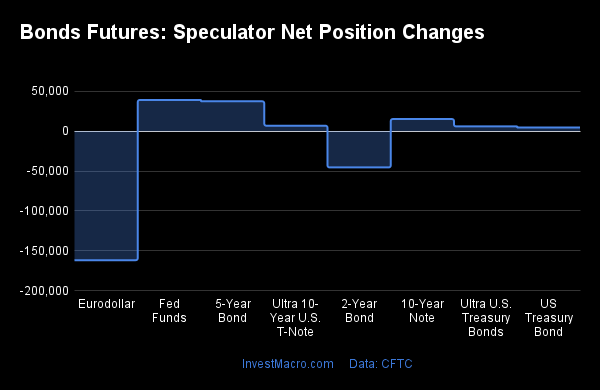
Leading the weekly gains for the bond markets was the Fed Funds (39,189 contracts) and the 5-Year Bond (37,532 contracts) with the 10-Year Bond (15,257 contracts), the Ultra 10-Year (6,903 contracts), the Ultra US Bond (5,993 contracts) and the Long US Bond (4,580 contracts) also showing a positive week.
The bond markets leading the weekly declines in speculator bets this week was the Eurodollar (-161,954 contracts) with the 2-Year Bond (-45,488 contracts) also registering lower bets on the week.
| Nov-08-2022 | OI | OI-Index | Spec-Net | Spec-Index | Com-Net | COM-Index | Smalls-Net | Smalls-Index |
|---|---|---|---|---|---|---|---|---|
| Eurodollar | 7,973,351 | 1 | -2,112,650 | 14 | 2,359,932 | 83 | -247,282 | 50 |
| FedFunds | 1,490,683 | 42 | 22,184 | 42 | -14,210 | 58 | -7,974 | 39 |
| 2-Year | 2,205,573 | 19 | -483,273 | 0 | 505,582 | 100 | -22,309 | 42 |
| Long T-Bond | 1,207,905 | 44 | -90,725 | 55 | 58,256 | 31 | 32,469 | 78 |
| 10-Year | 4,030,770 | 67 | -283,059 | 29 | 349,824 | 63 | -66,765 | 64 |
| 5-Year | 4,281,320 | 67 | -499,455 | 10 | 612,346 | 88 | -112,891 | 50 |
US Treasury Bond led the Strength Scores
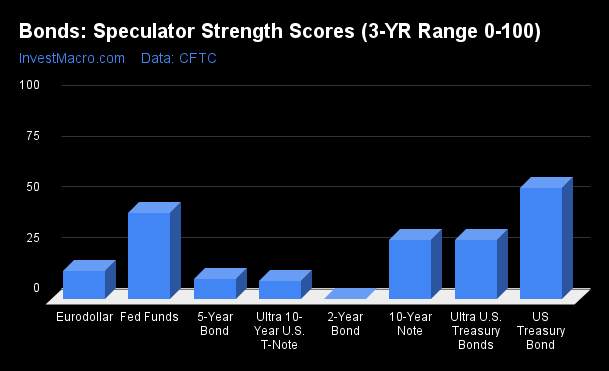
Strength Scores (a normalized measure of Speculator positions over a 3-Year range, from 0 to 100 where above 80 is extreme bullish and below 20 is extreme bearish) showed that the US Treasury Bond (55.1 percent) led the bonds category.
On the downside, the 2-Year Bond (0.0 percent), Ultra 10-Year Bond (8.9 percent), 5-Year Bond (10.0 percent) and the Eurodollar (14.2 percent) came in at the lowest strength levels and were all in an extreme bearish level (below 20 percent).
Strength Statistics:
Fed Funds (42.4 percent) vs Fed Funds previous week (37.5 percent)
2-Year Bond (0.0 percent) vs 2-Year Bond previous week (8.0 percent)
5-Year Bond (10.0 percent) vs 5-Year Bond previous week (4.3 percent)
10-Year Bond (29.4 percent) vs 10-Year Bond previous week (27.1 percent)
Ultra 10-Year Bond (8.9 percent) vs Ultra 10-Year Bond previous week (7.1 percent)
US Treasury Bond (55.1 percent) vs US Treasury Bond previous week (53.6 percent)
Ultra US Treasury Bond (29.3 percent) vs Ultra US Treasury Bond previous week (26.9 percent)
Eurodollar (14.2 percent) vs Eurodollar previous week (17.2 percent)
Strength Trends led by 10-Year Bond last week
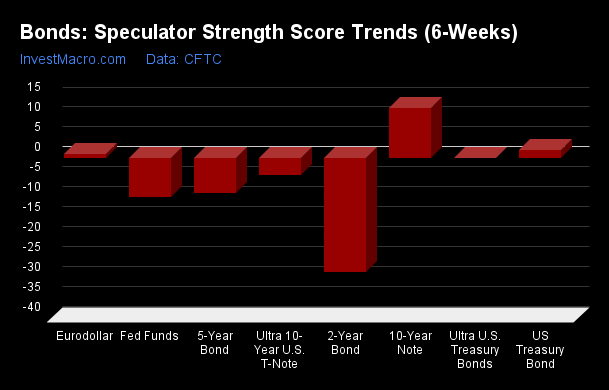
Strength Score Trends (or move index, calculates the 6-week changes in strength scores) showed that the 10-Year Bond (12.5 percent) led the past six weeks trends for bonds. The US Treasury Bond (1.9 percent) and the Eurodollar (0.9 percent) were the other positive movers in the latest trends data.
The 2-Year Bond (-28.6 percent) led the downside trend scores while the next market with lower trend scores was the Fed Funds (-9.9 percent) followed by the 5-Year Bond (-8.7 percent).
Strength Trend Statistics:
Fed Funds (-9.9 percent) vs Fed Funds previous week (-5.1 percent)
2-Year Bond (-28.6 percent) vs 2-Year Bond previous week (-16.7 percent)
5-Year Bond (-8.7 percent) vs 5-Year Bond previous week (-6.5 percent)
10-Year Bond (12.5 percent) vs 10-Year Bond previous week (-10.4 percent)
Ultra 10-Year Bond (-4.4 percent) vs Ultra 10-Year Bond previous week (-14.2 percent)
US Treasury Bond (1.9 percent) vs US Treasury Bond previous week (1.4 percent)
Ultra US Treasury Bond (-0.1 percent) vs Ultra US Treasury Bond previous week (-9.1 percent)
Eurodollar (0.9 percent) vs Eurodollar previous week (5.0 percent)
Individual Bond Markets:
3-Month Eurodollars Futures:
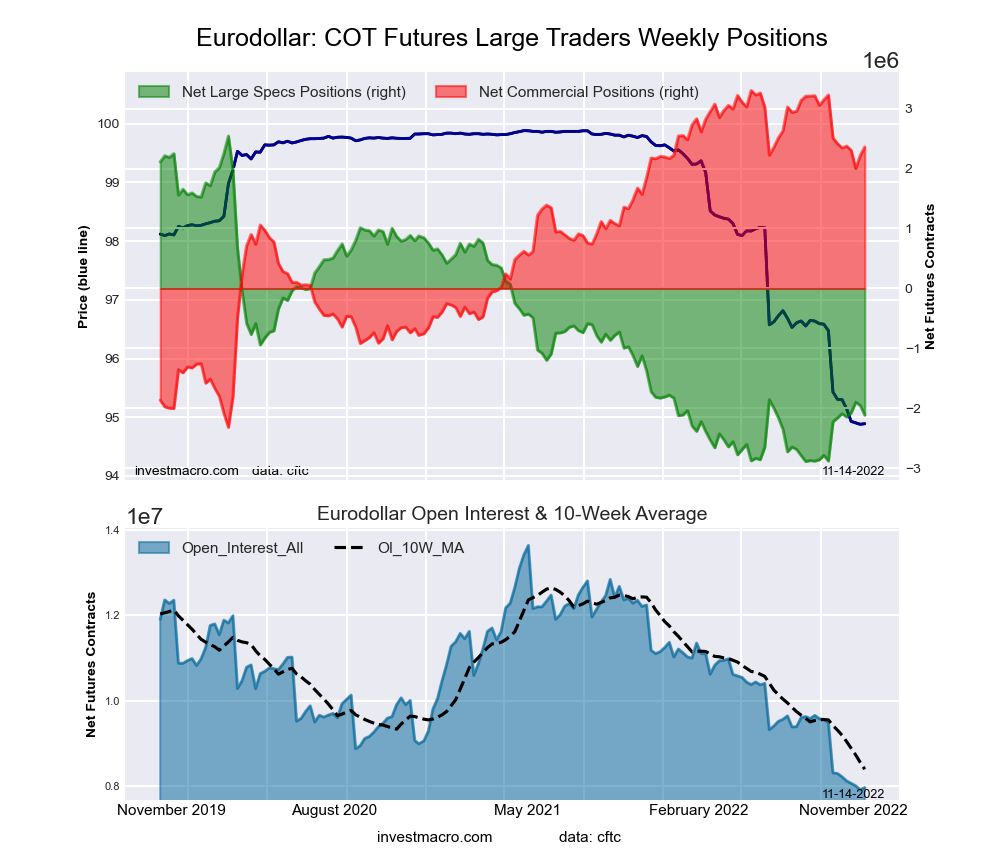 The 3-Month Eurodollars large speculator standing this week recorded a net position of -2,112,650 contracts in the data reported through Tuesday. This was a weekly decline of -161,954 contracts from the previous week which had a total of -1,950,696 net contracts.
This week’s current strength score (the trader positioning range over the past three years, measured from 0 to 100) shows the speculators are currently Bearish-Extreme with a score of 14.2 percent. The commercials are Bullish-Extreme with a score of 83.2 percent and the small traders (not shown in chart) are Bullish with a score of 50.0 percent.
| 3-Month Eurodollars Statistics | SPECULATORS | COMMERCIALS | SMALL TRADERS |
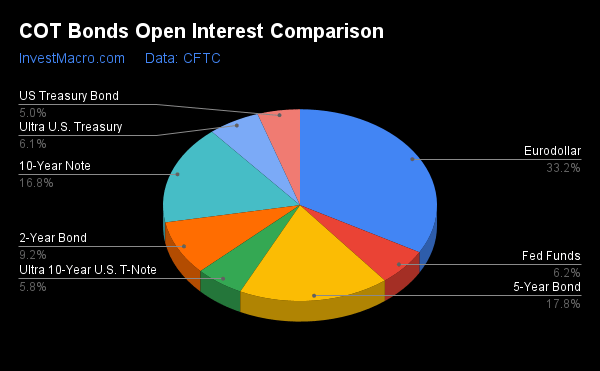
| – Percent of Open Interest Longs: | 6.1 | 68.6 | 6.1 |
| – Percent of Open Interest Shorts: | 32.6 | 39.0 | 9.2 |
| – Net Position: | -2,112,650 | 2,359,932 | -247,282 |
| – Gross Longs: | 487,273 | 5,471,608 | 485,753 |
| – Gross Shorts: | 2,599,923 | 3,111,676 | 733,035 |
| – Long to Short Ratio: | 0.2 to 1 | 1.8 to 1 | 0.7 to 1 |
| NET POSITION TREND: | |||
| – Strength Index Score (3 Year Range Pct): | 14.2 | 83.2 | 50.0 |
| – Strength Index Reading (3 Year Range): | Bearish-Extreme | Bullish-Extreme | Bullish |
| NET POSITION MOVEMENT INDEX: | |||
| – 6-Week Change in Strength Index: | 0.9 | -1.0 | 1.8 |
30-Day Federal Funds Futures:
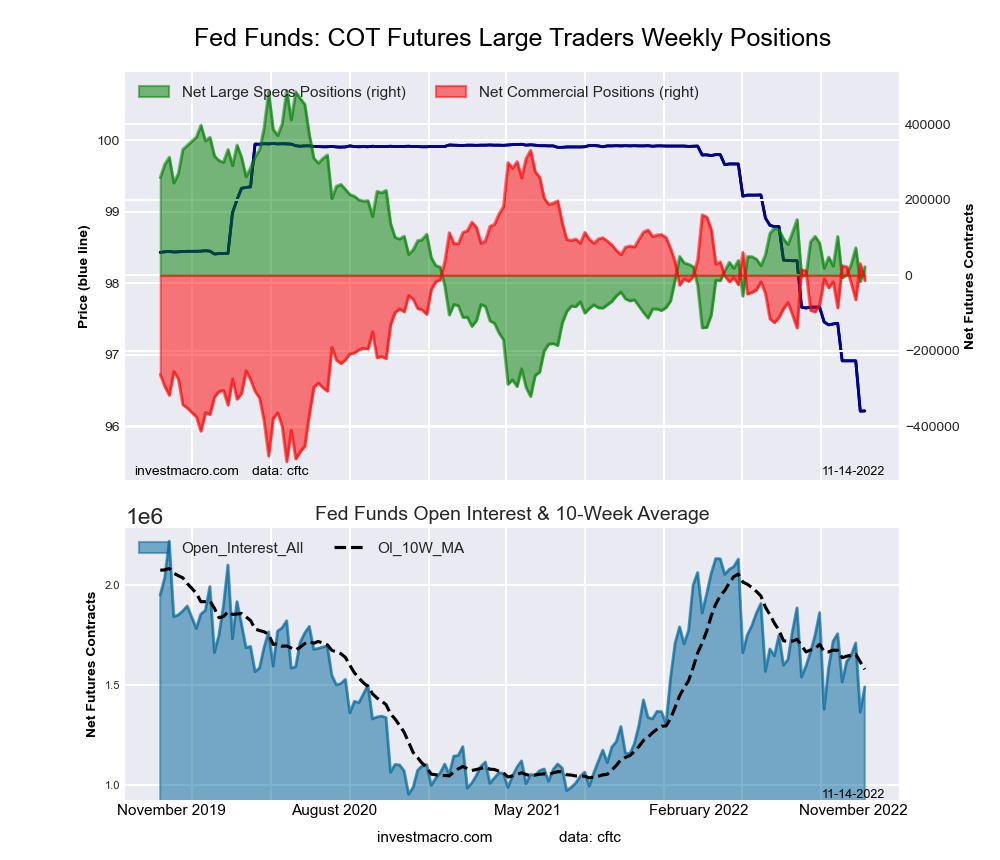 The 30-Day Federal Funds large speculator standing this week recorded a net position of 22,184 contracts in the data reported through Tuesday. This was a weekly gain of 39,189 contracts from the previous week which had a total of -17,005 net contracts.
This week’s current strength score (the trader positioning range over the past three years, measured from 0 to 100) shows the speculators are currently Bearish with a score of 42.4 percent. The commercials are Bullish with a score of 58.2 percent and the small traders (not shown in chart) are Bearish with a score of 39.3 percent.
| 30-Day Federal Funds Statistics | SPECULATORS | COMMERCIALS | SMALL TRADERS |
| – Percent of Open Interest Longs: | 11.4 | 73.0 | 2.2 |
| – Percent of Open Interest Shorts: | 9.9 | 73.9 | 2.8 |
| – Net Position: | 22,184 | -14,210 | -7,974 |
| – Gross Longs: | 169,743 | 1,087,836 | 33,025 |
| – Gross Shorts: | 147,559 | 1,102,046 | 40,999 |
| – Long to Short Ratio: | 1.2 to 1 | 1.0 to 1 | 0.8 to 1 |
| NET POSITION TREND: | |||
| – Strength Index Score (3 Year Range Pct): | 42.4 | 58.2 | 39.3 |
| – Strength Index Reading (3 Year Range): | Bearish | Bullish | Bearish |
| NET POSITION MOVEMENT INDEX: | |||
| – 6-Week Change in Strength Index: | -9.9 | 8.8 | 20.6 |
2-Year Treasury Note Futures:
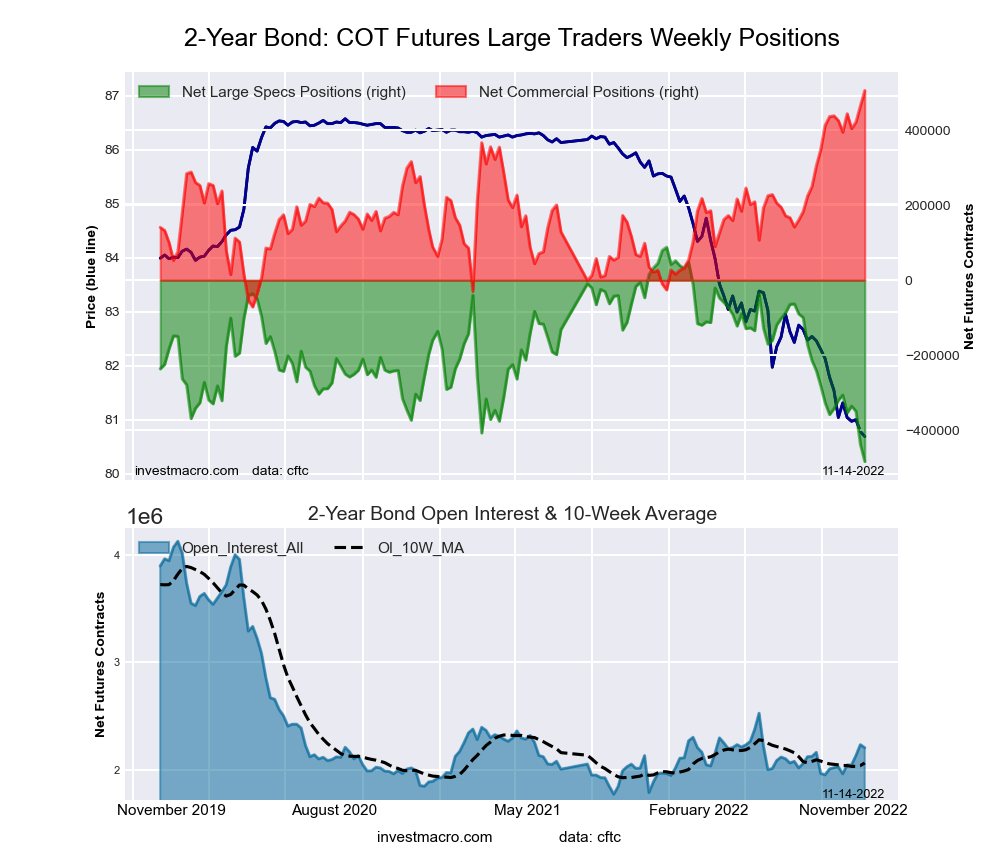 The 2-Year Treasury Note large speculator standing this week recorded a net position of -483,273 contracts in the data reported through Tuesday. This was a weekly decrease of -45,488 contracts from the previous week which had a total of -437,785 net contracts.
This week’s current strength score (the trader positioning range over the past three years, measured from 0 to 100) shows the speculators are currently Bearish-Extreme with a score of 0.0 percent. The commercials are Bullish-Extreme with a score of 100.0 percent and the small traders (not shown in chart) are Bearish with a score of 42.1 percent.
| 2-Year Treasury Note Statistics | SPECULATORS | COMMERCIALS | SMALL TRADERS |
| – Percent of Open Interest Longs: | 8.4 | 81.2 | 8.2 |
| – Percent of Open Interest Shorts: | 30.3 | 58.2 | 9.3 |
| – Net Position: | -483,273 | 505,582 | -22,309 |
| – Gross Longs: | 184,479 | 1,790,012 | 181,777 |
| – Gross Shorts: | 667,752 | 1,284,430 | 204,086 |
| – Long to Short Ratio: | 0.3 to 1 | 1.4 to 1 | 0.9 to 1 |
| NET POSITION TREND: | |||
| – Strength Index Score (3 Year Range Pct): | 0.0 | 100.0 | 42.1 |
| – Strength Index Reading (3 Year Range): | Bearish-Extreme | Bullish-Extreme | Bearish |
| NET POSITION MOVEMENT INDEX: | |||
| – 6-Week Change in Strength Index: | -28.6 | 13.9 | 37.2 |
5-Year Treasury Note Futures:
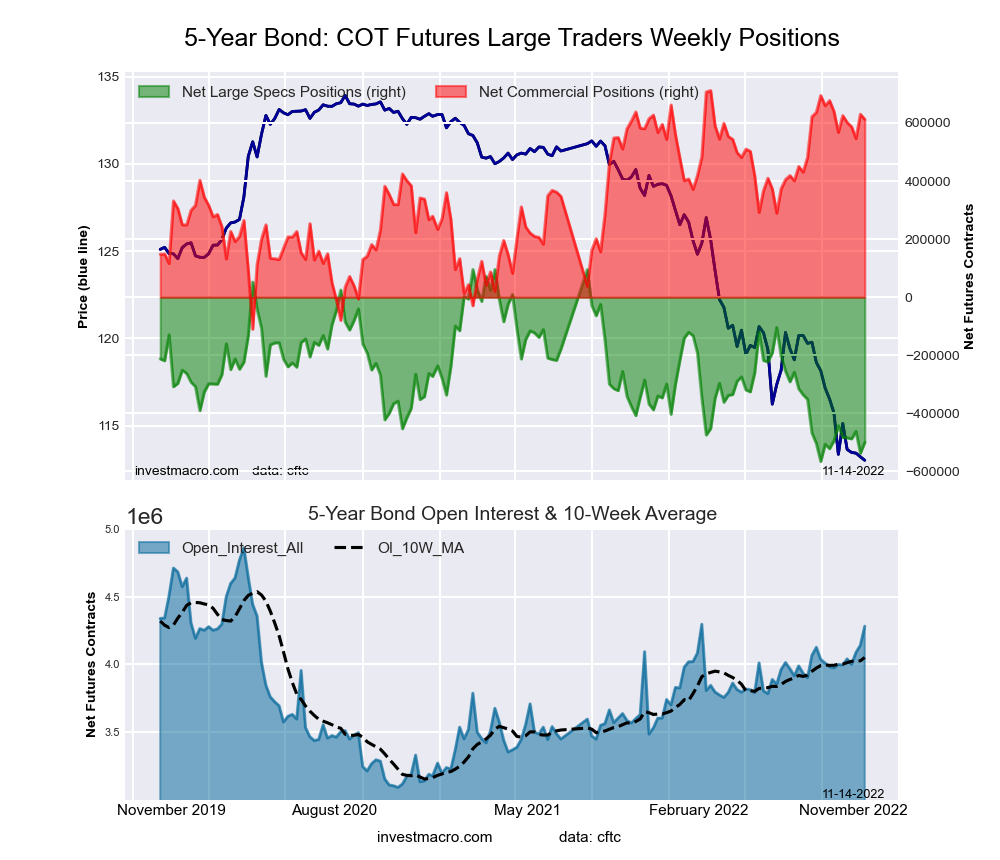 The 5-Year Treasury Note large speculator standing this week recorded a net position of -499,455 contracts in the data reported through Tuesday. This was a weekly rise of 37,532 contracts from the previous week which had a total of -536,987 net contracts.
This week’s current strength score (the trader positioning range over the past three years, measured from 0 to 100) shows the speculators are currently Bearish-Extreme with a score of 10.0 percent. The commercials are Bullish-Extreme with a score of 87.9 percent and the small traders (not shown in chart) are Bullish with a score of 50.1 percent.
| 5-Year Treasury Note Statistics | SPECULATORS | COMMERCIALS | SMALL TRADERS |
| – Percent of Open Interest Longs: | 7.1 | 83.8 | 7.6 |
| – Percent of Open Interest Shorts: | 18.8 | 69.5 | 10.3 |
| – Net Position: | -499,455 | 612,346 | -112,891 |
| – Gross Longs: | 305,068 | 3,588,425 | 327,034 |
| – Gross Shorts: | 804,523 | 2,976,079 | 439,925 |
| – Long to Short Ratio: | 0.4 to 1 | 1.2 to 1 | 0.7 to 1 |
| NET POSITION TREND: | |||
| – Strength Index Score (3 Year Range Pct): | 10.0 | 87.9 | 50.1 |
| – Strength Index Reading (3 Year Range): | Bearish-Extreme | Bullish-Extreme | Bullish |
| NET POSITION MOVEMENT INDEX: | |||
| – 6-Week Change in Strength Index: | -8.7 | 5.5 | 3.5 |
10-Year Treasury Note Futures:
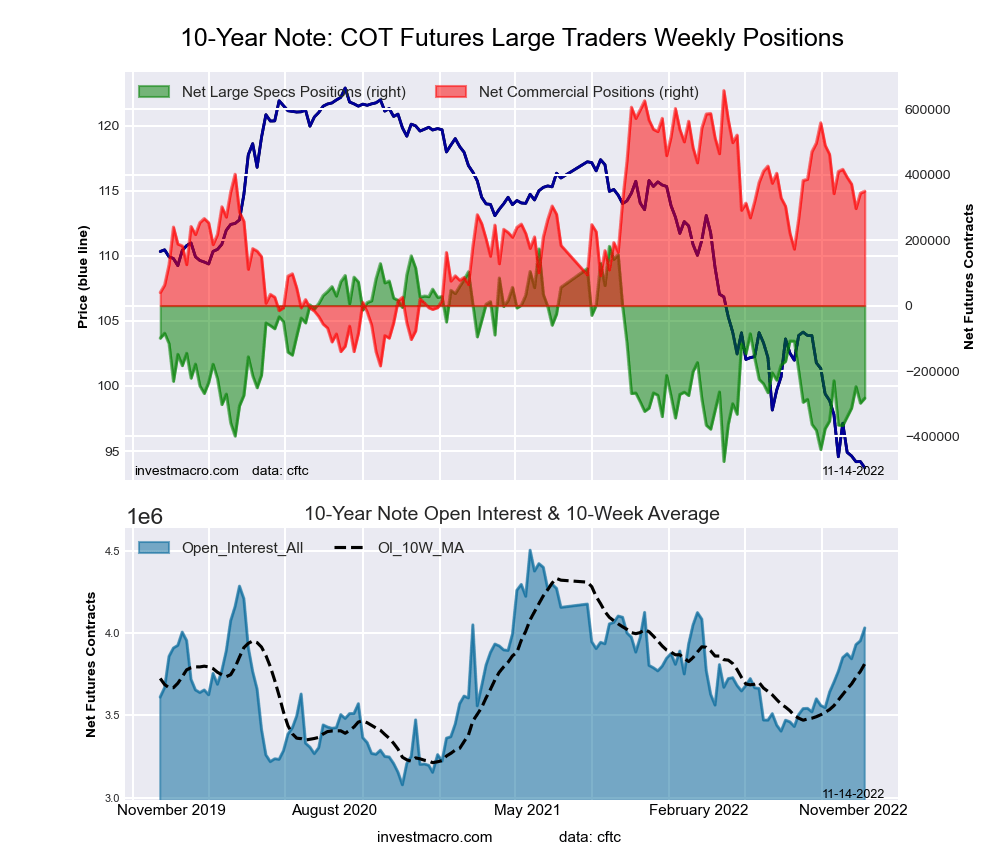 The 10-Year Treasury Note large speculator standing this week recorded a net position of -283,059 contracts in the data reported through Tuesday. This was a weekly boost of 15,257 contracts from the previous week which had a total of -298,316 net contracts.
This week’s current strength score (the trader positioning range over the past three years, measured from 0 to 100) shows the speculators are currently Bearish with a score of 29.4 percent. The commercials are Bullish with a score of 63.4 percent and the small traders (not shown in chart) are Bullish with a score of 64.2 percent.
| 10-Year Treasury Note Statistics | SPECULATORS | COMMERCIALS | SMALL TRADERS |
| – Percent of Open Interest Longs: | 12.4 | 75.6 | 9.1 |
| – Percent of Open Interest Shorts: | 19.4 | 67.0 | 10.7 |
| – Net Position: | -283,059 | 349,824 | -66,765 |
| – Gross Longs: | 499,430 | 3,049,134 | 366,261 |
| – Gross Shorts: | 782,489 | 2,699,310 | 433,026 |
| – Long to Short Ratio: | 0.6 to 1 | 1.1 to 1 | 0.8 to 1 |
| NET POSITION TREND: | |||
| – Strength Index Score (3 Year Range Pct): | 29.4 | 63.4 | 64.2 |
| – Strength Index Reading (3 Year Range): | Bearish | Bullish | Bullish |
| NET POSITION MOVEMENT INDEX: | |||
| – 6-Week Change in Strength Index: | 12.5 | -7.1 | -5.2 |
Ultra 10-Year Notes Futures:
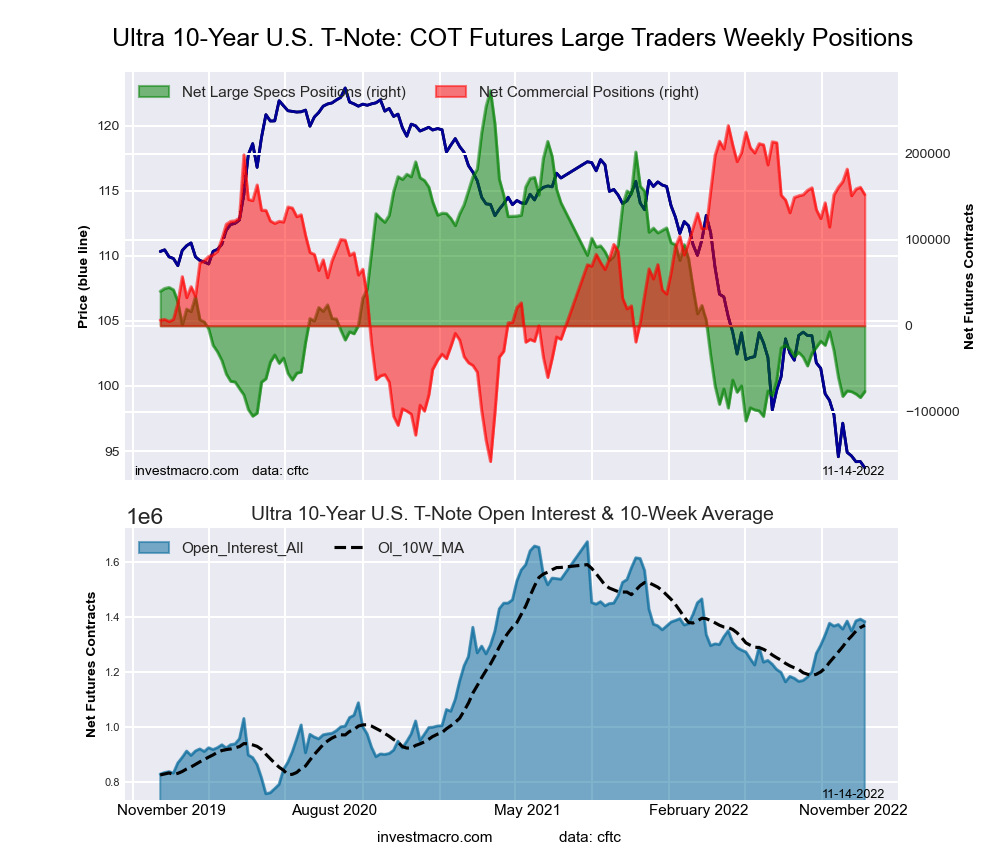 The Ultra 10-Year Notes large speculator standing this week recorded a net position of -76,528 contracts in the data reported through Tuesday. This was a weekly gain of 6,903 contracts from the previous week which had a total of -83,431 net contracts.
This week’s current strength score (the trader positioning range over the past three years, measured from 0 to 100) shows the speculators are currently Bearish-Extreme with a score of 8.9 percent. The commercials are Bullish with a score of 79.4 percent and the small traders (not shown in chart) are Bullish with a score of 76.5 percent.
| Ultra 10-Year Notes Statistics | SPECULATORS | COMMERCIALS | SMALL TRADERS |
| – Percent of Open Interest Longs: | 8.5 | 79.7 | 10.9 |
| – Percent of Open Interest Shorts: | 14.0 | 68.7 | 16.4 |
| – Net Position: | -76,528 | 152,582 | -76,054 |
| – Gross Longs: | 117,692 | 1,103,138 | 151,341 |
| – Gross Shorts: | 194,220 | 950,556 | 227,395 |
| – Long to Short Ratio: | 0.6 to 1 | 1.2 to 1 | 0.7 to 1 |
| NET POSITION TREND: | |||
| – Strength Index Score (3 Year Range Pct): | 8.9 | 79.4 | 76.5 |
| – Strength Index Reading (3 Year Range): | Bearish-Extreme | Bullish | Bullish |
| NET POSITION MOVEMENT INDEX: | |||
| – 6-Week Change in Strength Index: | -4.4 | -2.2 | 16.8 |
US Treasury Bonds Futures:
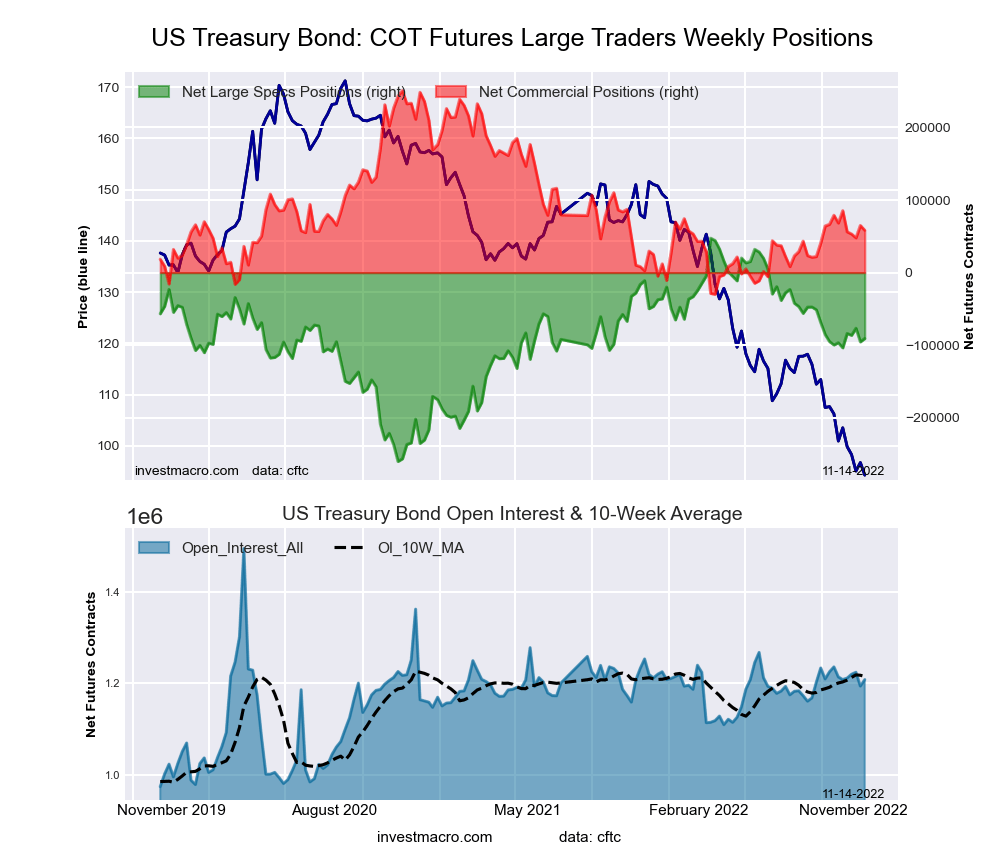 The US Treasury Bonds large speculator standing this week recorded a net position of -90,725 contracts in the data reported through Tuesday. This was a weekly boost of 4,580 contracts from the previous week which had a total of -95,305 net contracts.
This week’s current strength score (the trader positioning range over the past three years, measured from 0 to 100) shows the speculators are currently Bullish with a score of 55.1 percent. The commercials are Bearish with a score of 31.4 percent and the small traders (not shown in chart) are Bullish with a score of 78.3 percent.
| US Treasury Bonds Statistics | SPECULATORS | COMMERCIALS | SMALL TRADERS |
| – Percent of Open Interest Longs: | 5.7 | 78.5 | 14.8 |
| – Percent of Open Interest Shorts: | 13.2 | 73.7 | 12.1 |
| – Net Position: | -90,725 | 58,256 | 32,469 |
| – Gross Longs: | 68,339 | 948,677 | 178,648 |
| – Gross Shorts: | 159,064 | 890,421 | 146,179 |
| – Long to Short Ratio: | 0.4 to 1 | 1.1 to 1 | 1.2 to 1 |
| NET POSITION TREND: | |||
| – Strength Index Score (3 Year Range Pct): | 55.1 | 31.4 | 78.3 |
| – Strength Index Reading (3 Year Range): | Bullish | Bearish | Bullish |
| NET POSITION MOVEMENT INDEX: | |||
| – 6-Week Change in Strength Index: | 1.9 | -3.6 | 3.3 |
Ultra US Treasury Bonds Futures:
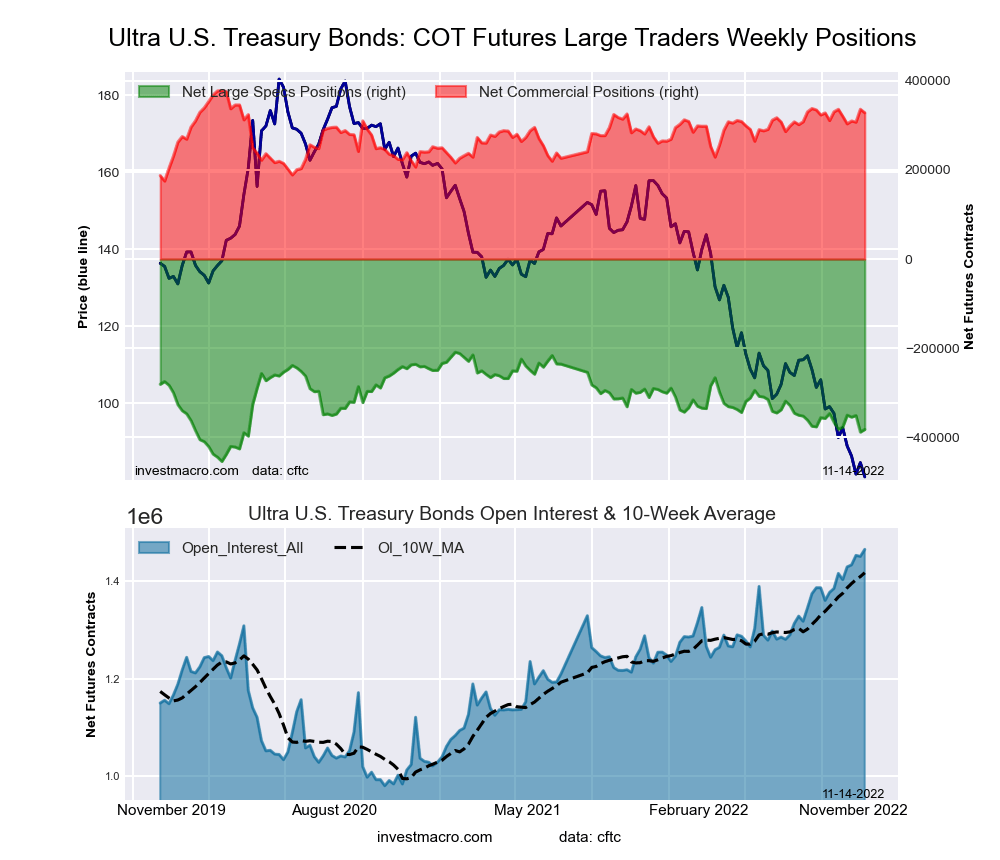 The Ultra US Treasury Bonds large speculator standing this week recorded a net position of -382,173 contracts in the data reported through Tuesday. This was a weekly rise of 5,993 contracts from the previous week which had a total of -388,166 net contracts.
This week’s current strength score (the trader positioning range over the past three years, measured from 0 to 100) shows the speculators are currently Bearish with a score of 29.3 percent. The commercials are Bullish with a score of 73.7 percent and the small traders (not shown in chart) are Bullish with a score of 76.2 percent.
| Ultra US Treasury Bonds Statistics | SPECULATORS | COMMERCIALS | SMALL TRADERS |
| – Percent of Open Interest Longs: | 6.0 | 81.9 | 11.9 |
| – Percent of Open Interest Shorts: | 32.1 | 59.5 | 8.3 |
| – Net Position: | -382,173 | 328,090 | 54,083 |
| – Gross Longs: | 88,204 | 1,200,247 | 175,022 |
| – Gross Shorts: | 470,377 | 872,157 | 120,939 |
| – Long to Short Ratio: | 0.2 to 1 | 1.4 to 1 | 1.4 to 1 |
| NET POSITION TREND: | |||
| – Strength Index Score (3 Year Range Pct): | 29.3 | 73.7 | 76.2 |
| – Strength Index Reading (3 Year Range): | Bearish | Bullish | Bullish |
| NET POSITION MOVEMENT INDEX: | |||
| – 6-Week Change in Strength Index: | -0.1 | -4.1 | 6.6 |
Article By InvestMacro – Receive our weekly COT Newsletter
*COT Report: The COT data, released weekly to the public each Friday, is updated through the most recent Tuesday (data is 3 days old) and shows a quick view of how large speculators or non-commercials (for-profit traders) were positioned in the futures markets.
The CFTC categorizes trader positions according to commercial hedgers (traders who use futures contracts for hedging as part of the business), non-commercials (large traders who speculate to realize trading profits) and nonreportable traders (usually small traders/speculators) as well as their open interest (contracts open in the market at time of reporting). See CFTC criteria here.

- Geopolitical and macroeconomic conditions continue to pressure market sentiment Jul 20, 2026
- USD/JPY Poised to Continue Gains as Expensive Oil and Lack of Support Weigh on Yen Jul 20, 2026
- COT Metals Charts: Weekly Speculator Bets led by Copper & Steel Jul 18, 2026
- COT Bonds Charts: Weekly Speculator Bets led by 2-Year, SOFR 3M & 5-Year Bonds Jul 18, 2026
- COT Energy Charts: Weekly Speculator Bets led by Brent Oil & Heating Oil Jul 18, 2026
- COT Soft Commodities Charts: Weekly Speculator Bets led by Wheat, Corn & Soybean Meal Jul 18, 2026
- The Bank of Canada kept its interest rate unchanged. Platinum prices reached a three‑week high Jul 16, 2026
- Stock indices rose after the release of US inflation data. China’s GDP slowed sharply Jul 15, 2026
- GBP/USD Awaits Political News: What Will Happen Next Jul 15, 2026
- USD/JPY Holds at Highs: Pressure Lingers on Yen Jul 14, 2026