Source: Michael Ballanger (10/2/23)
Michael Ballanger of GGM Advisory Inc. shares his experience surviving three major crashes and one mini crash to tell you how he survived. He also shares stocks he believes are worth looking into and explains why he believes you should invest in copper.
As I pore through dozens of “Daily Market Commentaries” offered each morning by the major banks and brokerages around North America and Europe, there is one old horse chestnut that will never disappear: “Fear sells.”
The Three Major
One thing that has not yet failed in my septuagenarian memory center is my recollection of the three major and one mini-market crashes through which I survived amidst fear and loathing early in my career and greed and excitement later in my career. The reason for this metamorphosis is the financial scar tissue that was developed in the early years served to guide me in later years, acting as a psychological sedative during times of market unrest.
Back in October 1987, watching a $500,000 portfolio (carrying $250,000 of margin debt) go to a $16,000 equity value, thanks in large to the merciless pen of my firm’s margin clerk, it was a valuable lesson for a young man trying to succeed in the wild world of investing “other people’s money” (know unaffectionately as “OTM”) while managing the far more important (tongue-in-cheek) personal account (affectionately known as “my P.A.”). I recall the perverse levels of glee exhibited by brokerage house managers across the system at the extraordinary commissions being generated by the forced sellouts of under-margined accounts, thinking: “These people are never coming back. . .” and ruing the day that turned out to be true.
In response to the 22.6%, one-day plunge in the Dow Jones, Fed Chairman Alan Greenspan introduced the first emergency measure of the modern era by opening up the liquidity spigots, sending long-term bond yields plunging while injecting tens of billions into the financial system to shore up the banks and brokers. One year later, stocks hit new highs, thus setting the template for stock market bailouts for decades (although it took years to sink in for most investors).
By the time we got to 2007, we had survived all kinds of mini-corrections, including fears of massive computer malfunctions at the turn of the New Millennium and the 9/11 tragedy, so by 2008, I was enjoying the “China buys EVERYTHING” commodity boom and was completely oblivious to the mortgage fraud being perpetrated everywhere (setting a template for repeats in Canada, China, Australia, and New Zealand fifteen years later).
The next major one was eleven years later when a number of men then considered “the smartest in the room” decided to set up a highly-leveraged investment fund of systemic size (and potential impact) and named it Long Term Capital Management which was a misnomer as it was run by a gaggle of trigger-fingered ex-bond-traders whose idea of a “long-term trade” was the amount of time it took for the ink to dry on the confirmations slips.
Despite the PHD and MBA shingles hanging ceremoniously from every wall, their high-browed strategy assumed that markets would remain rational forever, and when the Rooskies decided to tell bondholders to pound sand in the summer of 1998, the ensuing liquidity crisis set off a domino effect of cash calls and down went LTCM with a crash that forced the banks (all except Lehman Bros.) to bail them out but not before stocks had suffered a 22% crash over the next sixty days. The career-risk panic by the end of September 1998 was palpable, with notable oxymorons of the day being “wealthy client” and “responsible broker.”
Once again, the Fed/Wall St. bailout team came to the rescue, and stocks recovered all losses by year-end, once again installing a Pavlovian imprint into the risk management psyches of the investing public.
By the time we got to 2007, we had survived all kinds of mini-corrections, including fears of massive computer malfunctions at the turn of the New Millennium and the 9/11 tragedy, so by 2008, I was enjoying the “China buys EVERYTHING” commodity boom and was completely oblivious to the mortgage fraud being perpetrated everywhere (setting a template for repeats in Canada, China, Australia, and New Zealand fifteen years later).
Arriving like a thief in the night, the third crash was in 2008 and was a classic example of a self-inflicted shotgun blast to the sternum of the financial system, the gun armed and aimed by the banking sector aided and abetted by both the rating agencies and the mortgage industry.
“As long as the music kept playing,” they said, “they had to keep dancing,” but what the public failed to grasp was that the bankers knew that if and when the music stopped, Congress and the Fed would provide an unlimited number of high-backed and very plush chairs for the bankers but cold, hard concrete for the masses.
Alas, as if scripted by a Hollywood team, stocks caught a foothold in March 2009 and screamed to all-time highs four years later, propelled by a veritable gusher of liquidity (DEBT) conjured up by the central bankers and their political henchmen.
The House of Fear
The rest of the decade of 2010-2020 was a pleasure ride of the highest order. It was a goldilocks dreamworld of low inflation and low borrowing costs, largely the result of the gutting of the Western labor unions and the expatriation of the American middle class. China and Latin America now had all of the manufacturing businesses that once employed the average American breadwinner, but this wonderful era of “globalization” was really a ploy to enrich and empower the banking sector because as long as managers of assembly plants in Beijing or Hermosillo did not need worry about picket lines, their profit margins were sacrosanct and bottom lines and top lines could be exceeded while stock option plans were making them richer than they had ever imagined.
That all stopped when a wayward, disease-infected bat worked his way out of a laboratory in Wuhan, China, and ended up on a dinner plate in the local “wet market.” Sensing an opportunity to seize votes, politicians the world over donned phony Dollar Store masks and stood arm-in-arm in front of the cameras, ordering common citizens to stay indoors, distance themselves from others, stay home from school, and not visit their ailing parents.
To rub salt in the wounds, they then ordered those citizens to get jabbed with a substance that failed to meet even the laxest of testing standards for new medicines. They fired people for refusing “medical treatment” where the right to refuse such is actually a law. The final straw was when these “science-following” fools shut down the global economy and then papered over the error by dropping trillions of dollars out of helicopters into the laps of all shut-in, masked, vaccinated, and unemployed citizens, failing to understand that everything they would be buying through Amazon would be in short supply because nobody was manufacturing it.
The abject stupidity of it was hard to fathom, but since the politicians were and are always right, they made sure that interest rates stayed “zero-bound,” all the while these trillions of dollars were desperately seeking out goods and services that were about to get a lot more expensive. Only after a 35% crash in March of 2020 did the Fed wake up along with Washington (and Ottawa and London and Paris, etc., etc. etc.) and begin to open up the floodgates of “emergency stimulus.”
This stimulus continued even after stocks had recovered all of their COVID crash losses until late in 2021 when inflation data confirmed that it was not exactly “transitory” as pronounced by Fed Chairman (and ex-stock salesman) Jerome Powell, but in fact was “sticky.”
Remember that since “Fear Sells,” the specter of the explosion of the debt bomb is what the newsletters use to sell subscriptions. It is also what prompts customers to move assets from the conservative bond house to the “House of Fear,” where gold guns and cabins in the mountains are the topics of the “Daily Market Commentaries.” Somewhere in the middle is the desired destination for the rational investor.
Since stocks topped in January 2022, they have had a begrudging correction that has at its core total ambivalence over serious structural problems in the global supply chain and an unsurmountable amount of sovereign debt that today threatens to choke the life out of the bull market in everything including housing, stocks, and congressional bribery.
The only reason that stocks are sitting today within an earshot of all-time highs is that the gargantuan flow of money into stocks each and every month is being executed by those who only know the “bailout” kind of market environment.
In 1987, there was no such precedent for a stock market rescue because that would be a violation of the All-American philosophy of “free market capitalism” spouted out by the Larry Kudlow’s and Jim Cramer’s of the world until, of course, their portfolios have seen a 40% drawdown and a margin call threatened a total wipeout.
“They know nothing!” shouted Cramer back in 2008, thinking that we all thought he meant the central bankers. What he really meant was that what they did not know was how much money he had lost buying Bear Sterns at $50 days before it got a rescue bid at $10 by the Almighty and Powerful Jamie Dimon and J.P. Morgan. The world of “socialized losses” and “privatized profits” is alive and well in 2023, but I would hazard a guess that the one thing standing in its way is that the debt bomb has a soon-to-be lit fuse that is now out of reach of the water hoses of the central banks and politicians. They doused that fuse during every crash since 1987 and hid it behind a mountain of liquidity, but as the mountain begins to melt away under the heat of economic stagflation, the fuse is once again both dry and exposed with the combination of de-globalization and elevated inflation and interest rates representing a “clear-and-present blowtorch” to the unsuspecting fuse.
Debt liquidation is not an inflationary happenstance; it is the ultimate deflation. Imagine prices for goods and services around the world going “NO BID” in a total absence of liquidity (credit), which is the lifeblood of all commerce here in 2023. It was not that way fifty years ago. Economies prospered or went bus bust upon adherence to (or lack thereof) sound money principles and the Christian Work Ethic (“Western” Work Ethic” being more politically correct). It is not my wish that the debt bomb explodes, but it is certainly my greatest living fear, both as an investor and as a citizen. A debt explosion vaporizes the purchasing power of all domestic currencies that rely upon credit, with the only survivors being those who have stores of value in their operational incomes, like farming, medicine, and most of the basic trades. One can barter to treat an ailment or mend fencing or repair tractors, but the last thing “of value” is financial services and especially “advice.”
Remember that since “Fear Sells,” the specter of the explosion of the debt bomb is what the newsletters use to sell subscriptions. It is also what prompts customers to move assets from the conservative bond house to the “House of Fear,” where gold guns and cabins in the mountains are the topics of the “Daily Market Commentaries.”
Somewhere in the middle is the desired destination for the rational investor.
Stocks
I have been a bear on stocks since the top in early August when the S&P 500 registered a bearish MACD crossover and started the first leg down in this corrective move — and that is just what it is — a corrective move. It is not the start of a market crash a secular bear market, or even a full-blown correction, although the NASDAQ is currently in that category.
I am now a cautious-about-to-turn-aggressive bull looking out to mid-October for a major rally that could quite possibly take stocks to all-time highs above SPX 4,818 by New Year’s. In this morning’s pre-opening email alert, I typed: “ This morning, I am anticipating a mid-session pullback as the last of the institutional window dressing is completed. Then, look for a rally to $445.00 on the SPDR Gold Shares ETF (GLD:NYSE) to commence.”
The reason for this is that sudden crashes in stock prices do not appear when “others are fearful,” and right now, the big traders are just that — fearful.
Compared to July when artificial intelligence ruled the roost and traders were making bets on a “Fed Pivot by Labour Day,” they have now dismissed AI in favor of “higher for longer” and the abject certainty that “something will break” in October, triggering a crash.
Stocks are on the defensive as margin calls on everything but your pet chihuahua are being met with month-end selling but my money, FWIW, is on a face-ripping rally to commence in October leaving the bears cowering in fetal positions in their dens.
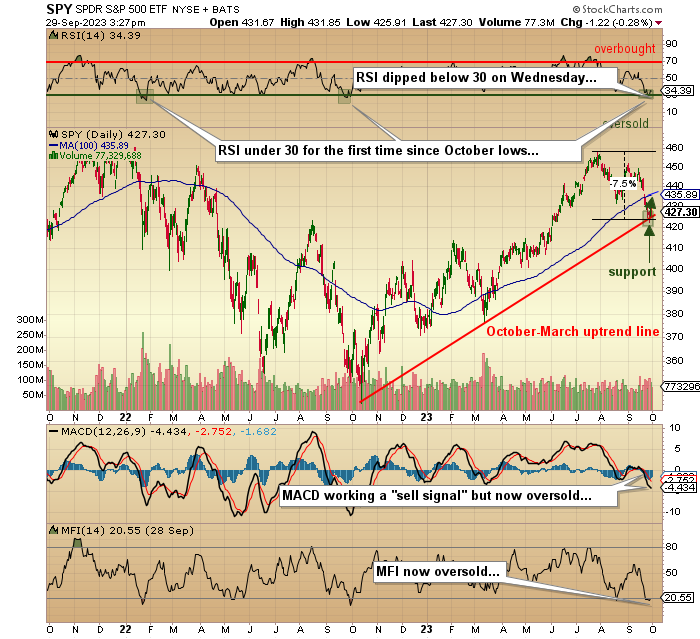
All of the major indicators are either in or are quickly approaching oversold status and while the monthly numbers look a tad scary, the GLD:NYSE could easily rally back to $445.00 at which point I will re-assess.
Conditions favoring a year-end rally are rounding into shape from perspectives of both technical and sentimental set-ups.
Gold and Silver
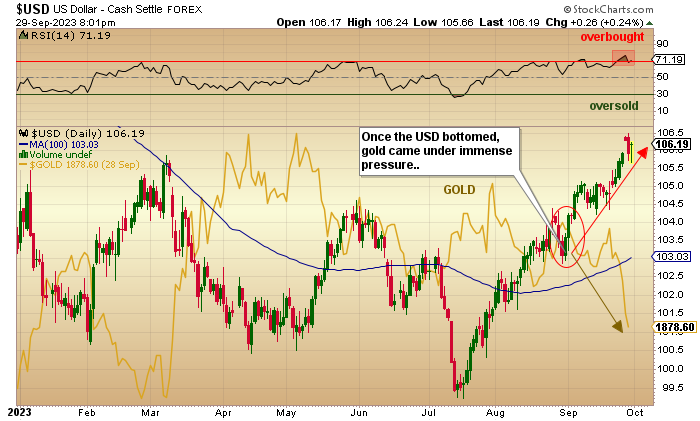
I have been flat gold and silver trading positions since early September for no other reason than they “just weren’t acting right,” and while that could be true for the past three years since the Fed and Treasury opened up the monetary fire hoses, during the summer pullback in the U.S, dollar (USD) neither metal could mount any kind of momentum.
Once the USD bottomed in late August, it began a meteoric ascent driven by rising U.S. bond yields that is still ongoing despite rising energy prices and slowing (ex-food and energy) CPI numbers.
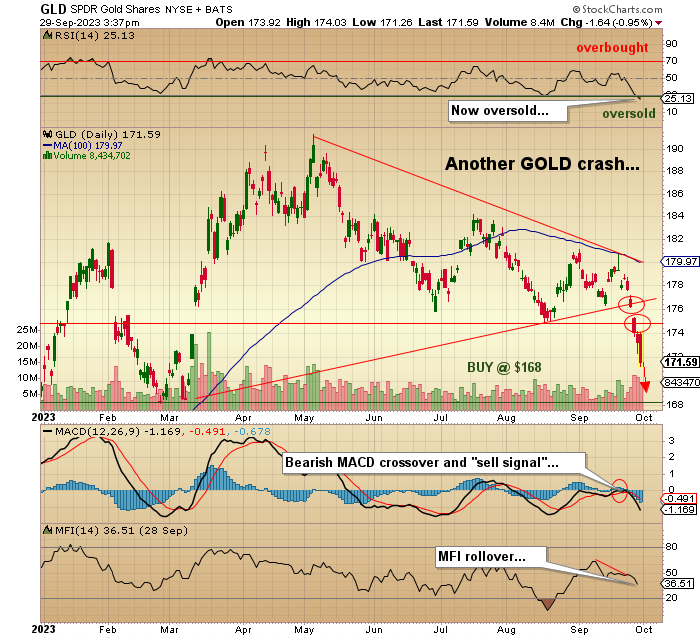
With the USD now firmly in overbought territory (RSI 70.95) and the GLD:NYSE in oversold territory (RSI 25), conditions are ripe for a turn, and with the Gold Miners Bullish Percent Index at 10.71, sentiment for the gold and silver stocks is putrid.
Norseman Silver Ltd. (NOC:TSX.V; NOCSF:OTCQB)CQB)
In fact, colleagues of mine have been asking me what I think of the current state of the Canadian junior resource market, and my only response is “What market?” because outside of selected uranium and lithium stocks (and lithium came under huge pressure in September), there is little demand and relative to the junior gold and silver markets, there is patently NO demand, whatsoever.
If one is a contrarian, one has to be backing up the truck as one accumulates some very promising juniors like Norseman Silver Ltd. (NOC:TSX.V; NOCSF:OTCQB) whose seasoned and very competent management team is scouring the planet for an advanced project within the “Electrification Trilogy” of uranium, copper, and lithium.
I should add (very quietly) that NOC/NOCSF closed at the ridiculous price of CA$0.035 today, which is less than the cost of buying a Vancouver shell.
I confess to having exhibited strong masochistic tendencies since 2020 in the full and unwavering belief that a junior resource bull “to end all bulls” is lurking just around the corner. While I have enjoyed marginal success in the uranium and lithium space, the copper space has been largely ignored and unloved throughout the entire post-pandemic monetary print-fest. Therein lies my next serious hunt, as there can be no successful transition to electric vehicles unless there is a tenfold increase in the transmission grid, and critical to expanding that grid is copper.
Ivanhoe Mines Ltd. (IVN:TSX; IVPAF:OTCQX)
It was weak in September, falling over 7.3% before a modest bounce into month-end. Since the big money has found electrical storage in lithium and since they have more recently gone after clean energy in uranium, they have yet to anoint energy transmission and copper as the last member of that very special trilogy. As a warning, I will continue to beat the copper drum until Bob Friedland forces me to buy shares in his behemoth Ivanhoe Mines Ltd., the crown jewel of the Friedland Empire.
As a casual observer of the deal since 2005, I have watched the genius that is Robert Friedland over the years (after meeting him in 1993) amass a large fortune through mining, first leaving North America for Singapore, then managing Ivanhoe Mines Ltd. (IVN:TSX; IVPAF:OTCQX) through intricate deals in Mongolia and Africa with the result being the largest copper producer in the world at Kamoa-Kakula which is situated in the Democratic Republic of the Congo in partnership with the government and Chinmet, the Chinese National Mining Company.
Arguably the finest salesman on the planet, Friedland deserves every penny of accolade bestowed to him by the usually agnostic press, which seem to view him as the fast-and-furious penny stock promoter of the 1980s and 1990s (which he was), but every time I listen to him addressing the Saudi princes or the Chinese mandarins in conferences throughout the Middle East and Asia, I am reminded of the time in 2002 he addressed a bunch of salesmen with the former Yorkton Securities in Toronto shortly after the dotcom market had blown up.
He took off his Armani jacket and rolled up his $300 shirt sleeves, and scolded the demoralized and destitute brokers up one side and down the other with visceral derision for failing to understand that “Technology is effin’ DEAD, and you mutts will have no clients left if you do not get them OUT and into commodities!” His vitriol was beyond “frightening.”
Within six months, Friedland was bang on, and by 2003, the metals markets were screaming higher, and it lasted until 2011 as China was the top dog in the race, exactly as he had predicted during that meeting.
So, when I start spouting off and tripping the light fantastic over “old guys” that I totally admire, I try to look beyond their self-laudatory idiosyncrasies and focus on their accomplishments, many of which can be attributed to chaps like Bob Friedland.
The reasons that he likes copper are anchored in the reasons he has been successful. The reasons he has been successful are anchored in his understanding of the mining industry. The reasons he understands the mining industry are anchored in the failures that built up the scar tissue early in his career. With that scar tissue, he can withstand the slings and arrows that appear in the mirror every morning of his life in an industry filled with body bags. A remarkable talent at best. . .
Copper is a buy; Ivanhoe Mines is a buy. Bob Friedland is a buy. End of story.
Important Disclosures:
- Norseman Silver Ltd. is a billboard sponsor of Streetwise Reports and pays SWR a monthly sponsorship fee between US$4,000 and US$5,000.
- As of the date of this article, officers and/or employees of Streetwise Reports LLC (including members of their household) own securities of Norseman Silver Ltd.
- Michael Ballanger: I, or members of my immediate household or family, own securities of: All. I determined which companies would be included in this article based on my research and understanding of the sector.
- Statements and opinions expressed are the opinions of the author and not of Streetwise Reports or its officers. The author is wholly responsible for the validity of the statements. The author was not paid by Streetwise Reports for this article. Streetwise Reports was not paid by the author to publish or syndicate this article. Streetwise Reports requires contributing authors to disclose any shareholdings in, or economic relationships with, companies that they write about. Streetwise Reports relies upon the authors to accurately provide this information and Streetwise Reports has no means of verifying its accuracy.
- This article does not constitute investment advice. Each reader is encouraged to consult with his or her individual financial professional. By opening this page, each reader accepts and agrees to Streetwise Reports’ terms of use and full legal disclaimer. This article is not a solicitation for investment. Streetwise Reports does not render general or specific investment advice and the information on Streetwise Reports should not be considered a recommendation to buy or sell any security. Streetwise Reports does not endorse or recommend the business, products, services or securities of any company.
- This article does not constitute medical advice. Officers, employees and contributors to Streetwise Reports are not licensed medical professionals. Readers should always contact their healthcare professionals for medical advice.
For additional disclosures, please click here.