
By InvestMacro
Here are the latest charts and statistics for the Commitment of Traders (COT) data published by the Commodities Futures Trading Commission (CFTC).
The latest COT data is updated through Tuesday September 5th and shows a quick view of how large traders (for-profit speculators and commercial entities) were positioned in the futures markets.
Weekly Speculator Changes led by Copper & Gold
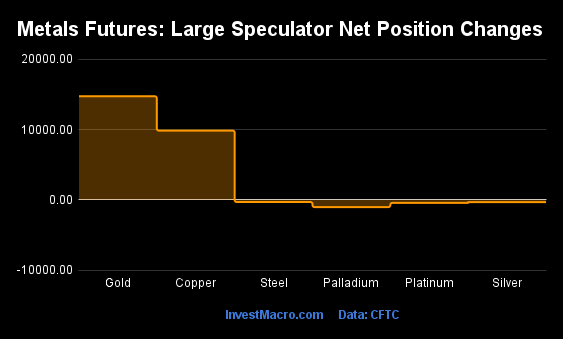
The COT metals markets speculator bets were lower this week as two out of the six metals markets we cover had higher positioning while the other four markets had lower speculator contracts.
Free Reports:
 Get our Weekly Commitment of Traders Reports - See where the biggest traders (Hedge Funds and Commercial Hedgers) are positioned in the futures markets on a weekly basis.
 Download Our Metatrader 4 Indicators – Put Our Free MetaTrader 4 Custom Indicators on your charts when you join our Weekly Newsletter
Leading the gains for the metals was with Gold (14,734 contracts) and Copper (9,846 contracts) also showing positive weeks.
The markets with declines in speculator bets for the week were Palladium (-1,045 contracts) with Platinum (-436 contracts), Silver (-329 contracts) and Steel (-320 contracts) also registering lower bets on the week.
| Sep-05-2023 | OI | OI-Index | Spec-Net | Spec-Index | Com-Net | COM-Index | Smalls-Net | Smalls-Index |
|---|---|---|---|---|---|---|---|---|
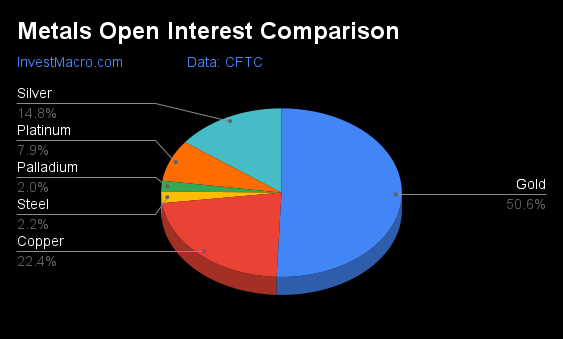
| Gold | 438,672 | 8 | 138,006 | 38 | -158,239 | 63 | 20,233 | 31 |
| Silver | 128,279 | 17 | 26,804 | 56 | -37,708 | 48 | 10,904 | 27 |
| Copper | 193,597 | 37 | -6,770 | 25 | 4,659 | 75 | 2,111 | 32 |
| Palladium | 17,644 | 80 | -11,021 | 0 | 10,888 | 100 | 133 | 50 |
| Platinum | 68,721 | 53 | 14,602 | 49 | -19,001 | 54 | 4,399 | 27 |
Strength Scores led by Steel & Silver

COT Strength Scores (a normalized measure of Speculator positions over a 3-Year range, from 0 to 100 where above 80 is Extreme-Bullish and below 20 is Extreme-Bearish) showed that Steel (61 percent) and Silver (56 percent) lead the metals markets this week.
On the downside, Palladium (0 percent) comes in at the lowest strength level currently and is in Extreme-Bearish territory (below 20 percent). The next lowest strength score was Copper (25 percent).
Strength Statistics:
Gold (37.8 percent) vs Gold previous week (31.3 percent)
Silver (56.5 percent) vs Silver previous week (57.0 percent)
Copper (25.0 percent) vs Copper previous week (16.5 percent)
Platinum (49.3 percent) vs Platinum previous week (50.3 percent)
Palladium (0.0 percent) vs Palladium previous week (7.1 percent)
Steel (61.2 percent) vs Palladium previous week (62.2 percent)
Platinum & Copper top the 6-Week Strength Trends

COT Strength Score Trends (or move index, calculates the 6-week changes in strength scores) showed that Platinum (-2 percent) and Copper (-7 percent) lead the past six weeks trends for metals with the least negative scores.
Palladium (-18 percent), Gold (-16 percent) and Silver (-14 percent) leads the downside trend scores currently.
Move Statistics:
Gold (-15.7 percent) vs Gold previous week (-30.8 percent)
Silver (-14.4 percent) vs Silver previous week (-23.9 percent)
Copper (-6.9 percent) vs Copper previous week (-11.3 percent)
Platinum (-2.0 percent) vs Platinum previous week (-1.6 percent)
Palladium (-17.9 percent) vs Palladium previous week (-11.0 percent)
Steel (-8.0 percent) vs Steel previous week (-11.0 percent)
Individual Markets:
Gold Comex Futures:
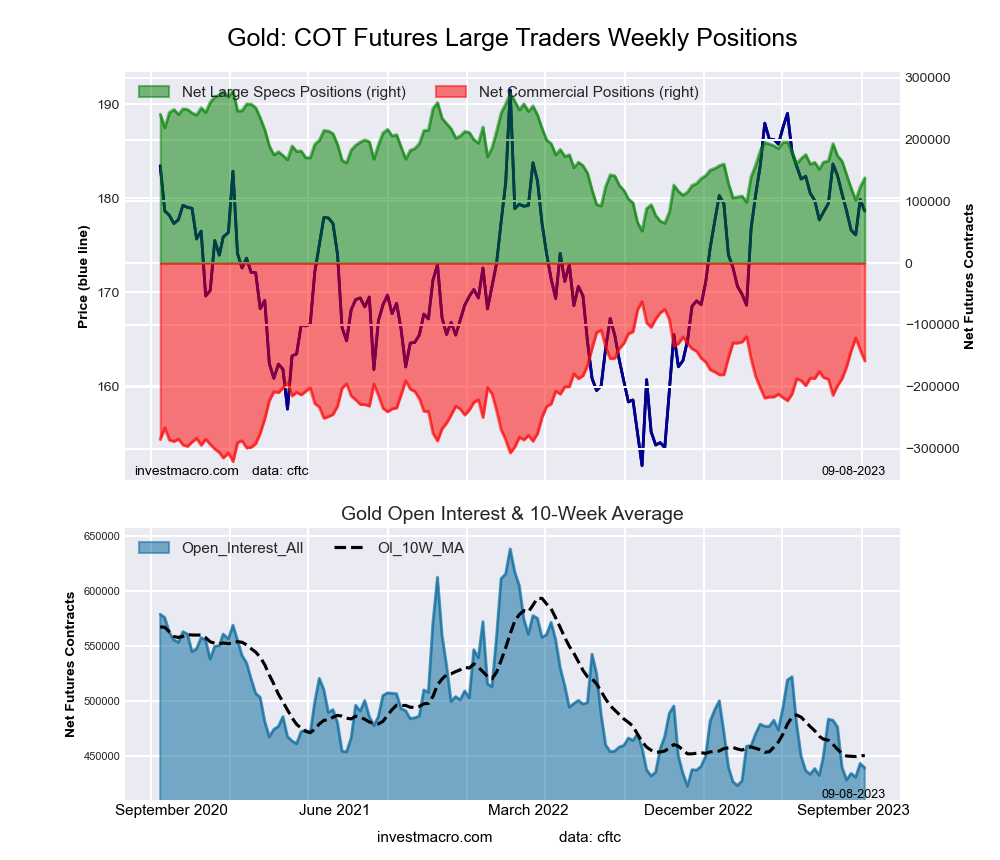 The Gold Comex Futures large speculator standing this week totaled a net position of 138,006 contracts in the data reported through Tuesday. This was a weekly increase of 14,734 contracts from the previous week which had a total of 123,272 net contracts.
This week’s current strength score (the trader positioning range over the past three years, measured from 0 to 100) shows the speculators are currently Bearish with a score of 37.8 percent. The commercials are Bullish with a score of 62.9 percent and the small traders (not shown in chart) are Bearish with a score of 30.6 percent.
Price Trend-Following Model: Downtrend
Our weekly trend-following model classifies the current market price position as: Downtrend. The current action for the model is considered to be: Hold – Maintain Short Position.
| Gold Futures Statistics | SPECULATORS | COMMERCIALS | SMALL TRADERS |
| – Percent of Open Interest Longs: | 53.8 | 25.4 | 10.5 |
| – Percent of Open Interest Shorts: | 22.3 | 61.5 | 5.9 |
| – Net Position: | 138,006 | -158,239 | 20,233 |
| – Gross Longs: | 235,802 | 111,456 | 45,966 |
| – Gross Shorts: | 97,796 | 269,695 | 25,733 |
| – Long to Short Ratio: | 2.4 to 1 | 0.4 to 1 | 1.8 to 1 |
| NET POSITION TREND: | |||
| – Strength Index Score (3 Year Range Pct): | 37.8 | 62.9 | 30.6 |
| – Strength Index Reading (3 Year Range): | Bearish | Bullish | Bearish |
| NET POSITION MOVEMENT INDEX: | |||
| – 6-Week Change in Strength Index: | -15.7 | 15.4 | -10.9 |
Silver Comex Futures:
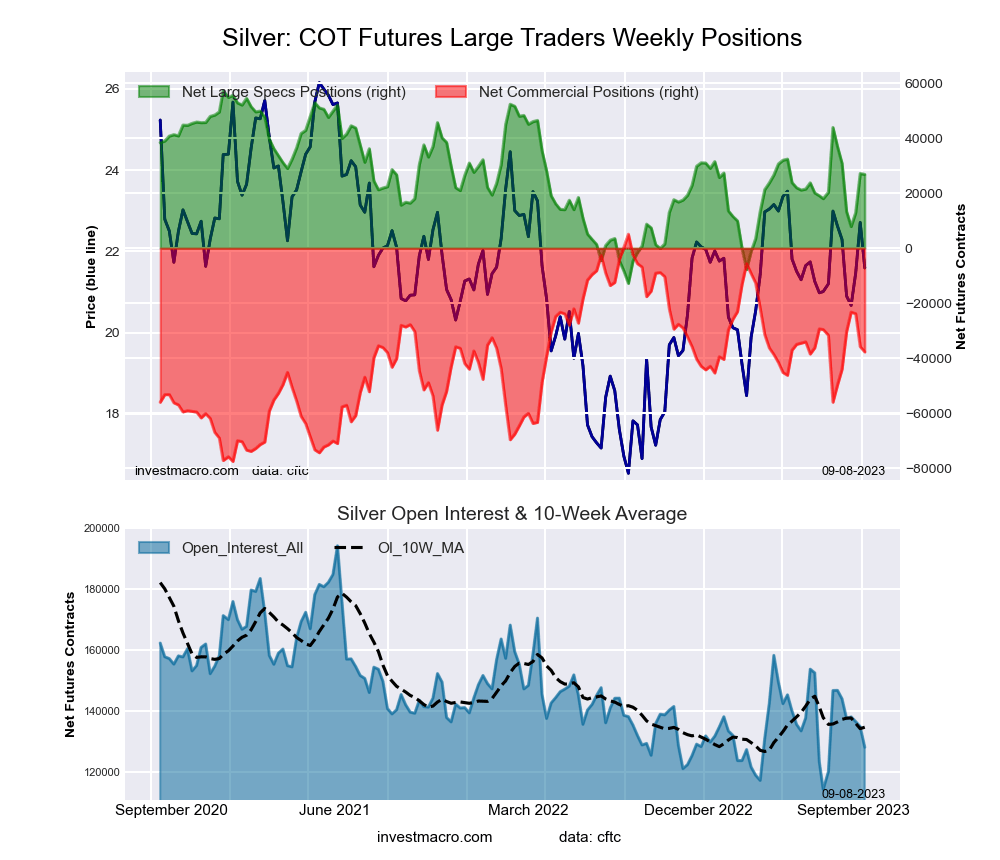 The Silver Comex Futures large speculator standing this week totaled a net position of 26,804 contracts in the data reported through Tuesday. This was a weekly decline of -329 contracts from the previous week which had a total of 27,133 net contracts.
This week’s current strength score (the trader positioning range over the past three years, measured from 0 to 100) shows the speculators are currently Bullish with a score of 56.5 percent. The commercials are Bearish with a score of 48.2 percent and the small traders (not shown in chart) are Bearish with a score of 26.9 percent.
Price Trend-Following Model: Strong Downtrend
Our weekly trend-following model classifies the current market price position as: Strong Downtrend. The current action for the model is considered to be: Hold – Maintain Short Position.
| Silver Futures Statistics | SPECULATORS | COMMERCIALS | SMALL TRADERS |
| – Percent of Open Interest Longs: | 44.9 | 31.2 | 18.6 |
| – Percent of Open Interest Shorts: | 24.0 | 60.6 | 10.1 |
| – Net Position: | 26,804 | -37,708 | 10,904 |
| – Gross Longs: | 57,558 | 40,052 | 23,814 |
| – Gross Shorts: | 30,754 | 77,760 | 12,910 |
| – Long to Short Ratio: | 1.9 to 1 | 0.5 to 1 | 1.8 to 1 |
| NET POSITION TREND: | |||
| – Strength Index Score (3 Year Range Pct): | 56.5 | 48.2 | 26.9 |
| – Strength Index Reading (3 Year Range): | Bullish | Bearish | Bearish |
| NET POSITION MOVEMENT INDEX: | |||
| – 6-Week Change in Strength Index: | -14.4 | 14.5 | -10.6 |
Copper Grade #1 Futures:
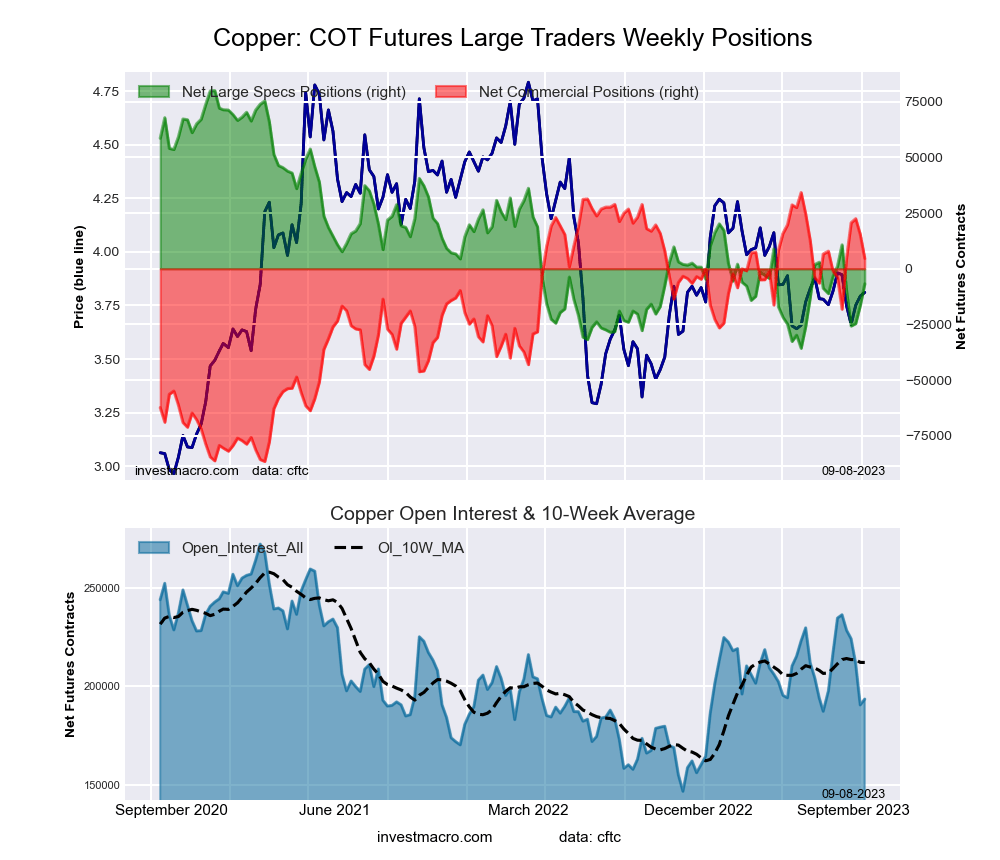 The Copper Grade #1 Futures large speculator standing this week totaled a net position of -6,770 contracts in the data reported through Tuesday. This was a weekly advance of 9,846 contracts from the previous week which had a total of -16,616 net contracts.
This week’s current strength score (the trader positioning range over the past three years, measured from 0 to 100) shows the speculators are currently Bearish with a score of 25.0 percent. The commercials are Bullish with a score of 75.5 percent and the small traders (not shown in chart) are Bearish with a score of 31.8 percent.
Price Trend-Following Model: Strong Downtrend
Our weekly trend-following model classifies the current market price position as: Strong Downtrend. The current action for the model is considered to be: Hold – Maintain Short Position.
| Copper Futures Statistics | SPECULATORS | COMMERCIALS | SMALL TRADERS |
| – Percent of Open Interest Longs: | 34.7 | 40.7 | 7.7 |
| – Percent of Open Interest Shorts: | 38.2 | 38.3 | 6.6 |
| – Net Position: | -6,770 | 4,659 | 2,111 |
| – Gross Longs: | 67,118 | 78,867 | 14,880 |
| – Gross Shorts: | 73,888 | 74,208 | 12,769 |
| – Long to Short Ratio: | 0.9 to 1 | 1.1 to 1 | 1.2 to 1 |
| NET POSITION TREND: | |||
| – Strength Index Score (3 Year Range Pct): | 25.0 | 75.5 | 31.8 |
| – Strength Index Reading (3 Year Range): | Bearish | Bullish | Bearish |
| NET POSITION MOVEMENT INDEX: | |||
| – 6-Week Change in Strength Index: | -6.9 | 7.1 | -4.0 |
Platinum Futures:
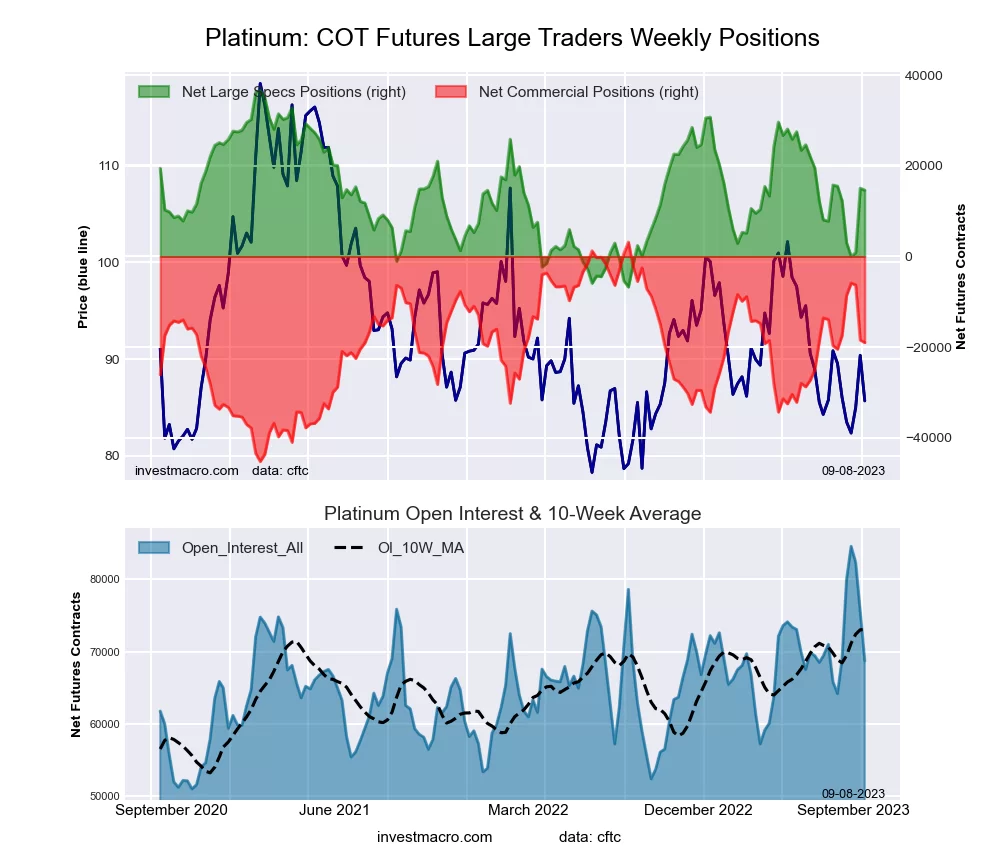 The Platinum Futures large speculator standing this week totaled a net position of 14,602 contracts in the data reported through Tuesday. This was a weekly decline of -436 contracts from the previous week which had a total of 15,038 net contracts.
This week’s current strength score (the trader positioning range over the past three years, measured from 0 to 100) shows the speculators are currently Bearish with a score of 49.3 percent. The commercials are Bullish with a score of 54.2 percent and the small traders (not shown in chart) are Bearish with a score of 27.1 percent.
Price Trend-Following Model: Downtrend
Our weekly trend-following model classifies the current market price position as: Downtrend. The current action for the model is considered to be: Hold – Maintain Short Position.
| Platinum Futures Statistics | SPECULATORS | COMMERCIALS | SMALL TRADERS |
| – Percent of Open Interest Longs: | 53.8 | 25.0 | 11.2 |
| – Percent of Open Interest Shorts: | 32.6 | 52.7 | 4.8 |
| – Net Position: | 14,602 | -19,001 | 4,399 |
| – Gross Longs: | 36,991 | 17,212 | 7,704 |
| – Gross Shorts: | 22,389 | 36,213 | 3,305 |
| – Long to Short Ratio: | 1.7 to 1 | 0.5 to 1 | 2.3 to 1 |
| NET POSITION TREND: | |||
| – Strength Index Score (3 Year Range Pct): | 49.3 | 54.2 | 27.1 |
| – Strength Index Reading (3 Year Range): | Bearish | Bullish | Bearish |
| NET POSITION MOVEMENT INDEX: | |||
| – 6-Week Change in Strength Index: | -2.0 | 3.0 | -7.4 |
Palladium Futures:
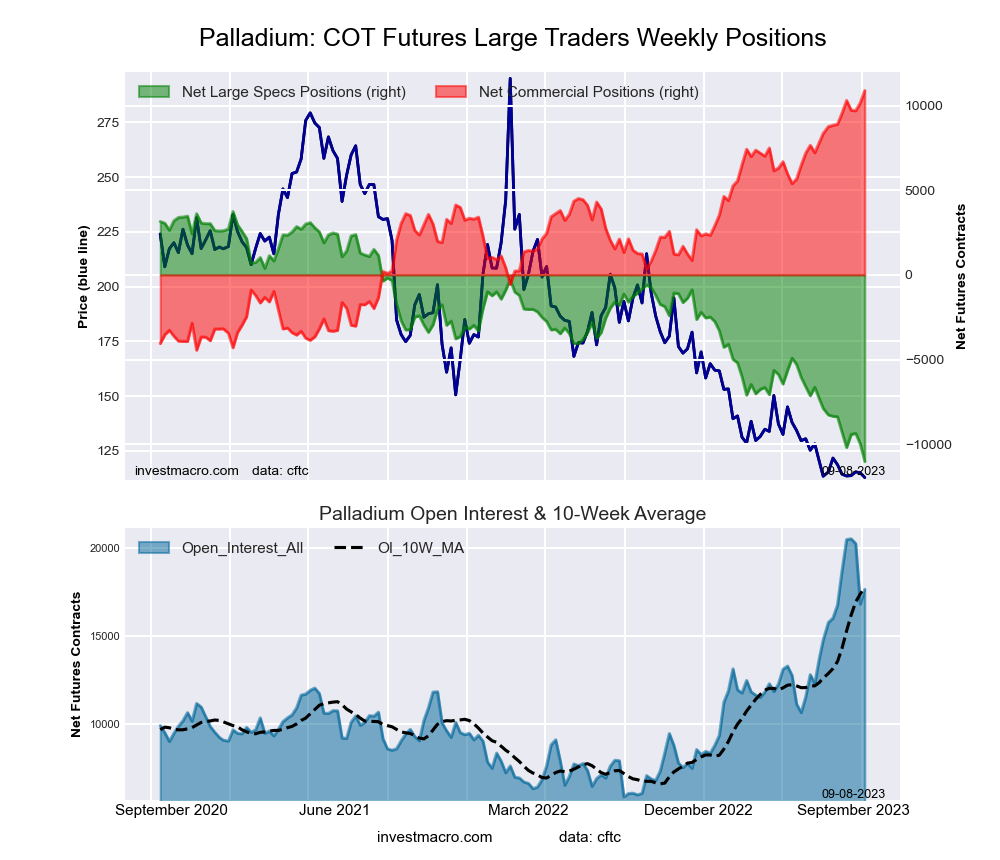 The Palladium Futures large speculator standing this week totaled a net position of -11,021 contracts in the data reported through Tuesday. This was a weekly reduction of -1,045 contracts from the previous week which had a total of -9,976 net contracts.
This week’s current strength score (the trader positioning range over the past three years, measured from 0 to 100) shows the speculators are currently Bearish-Extreme with a score of 0.0 percent. The commercials are Bullish-Extreme with a score of 100.0 percent and the small traders (not shown in chart) are Bearish with a score of 49.7 percent.
Price Trend-Following Model: Downtrend
Our weekly trend-following model classifies the current market price position as: Downtrend. The current action for the model is considered to be: Hold – Maintain Short Position.
| Palladium Futures Statistics | SPECULATORS | COMMERCIALS | SMALL TRADERS |
| – Percent of Open Interest Longs: | 22.7 | 64.0 | 9.9 |
| – Percent of Open Interest Shorts: | 85.2 | 2.3 | 9.1 |
| – Net Position: | -11,021 | 10,888 | 133 |
| – Gross Longs: | 4,008 | 11,296 | 1,746 |
| – Gross Shorts: | 15,029 | 408 | 1,613 |
| – Long to Short Ratio: | 0.3 to 1 | 27.7 to 1 | 1.1 to 1 |
| NET POSITION TREND: | |||
| – Strength Index Score (3 Year Range Pct): | 0.0 | 100.0 | 49.7 |
| – Strength Index Reading (3 Year Range): | Bearish-Extreme | Bullish-Extreme | Bearish |
| NET POSITION MOVEMENT INDEX: | |||
| – 6-Week Change in Strength Index: | -17.9 | 13.0 | 39.4 |
Steel Futures Futures:
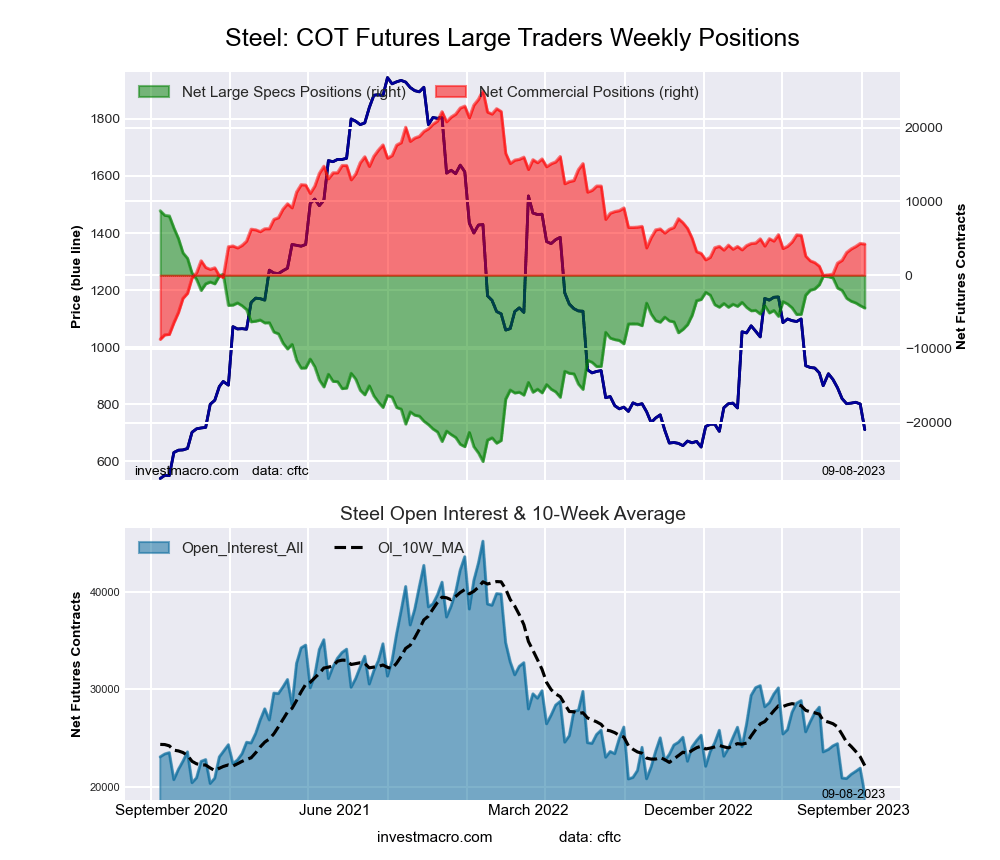 The Steel Futures large speculator standing this week totaled a net position of -4,442 contracts in the data reported through Tuesday. This was a weekly reduction of -320 contracts from the previous week which had a total of -4,122 net contracts.
This week’s current strength score (the trader positioning range over the past three years, measured from 0 to 100) shows the speculators are currently Bullish with a score of 61.2 percent. The commercials are Bearish with a score of 38.3 percent and the small traders (not shown in chart) are Bullish with a score of 50.9 percent.
Price Trend-Following Model: Downtrend
Our weekly trend-following model classifies the current market price position as: Downtrend. The current action for the model is considered to be: Hold – Maintain Short Position.
| Steel Futures Statistics | SPECULATORS | COMMERCIALS | SMALL TRADERS |
| – Percent of Open Interest Longs: | 5.5 | 87.6 | 3.1 |
| – Percent of Open Interest Shorts: | 28.6 | 65.7 | 1.9 |
| – Net Position: | -4,442 | 4,220 | 222 |
| – Gross Longs: | 1,058 | 16,848 | 587 |
| – Gross Shorts: | 5,500 | 12,628 | 365 |
| – Long to Short Ratio: | 0.2 to 1 | 1.3 to 1 | 1.6 to 1 |
| NET POSITION TREND: | |||
| – Strength Index Score (3 Year Range Pct): | 61.2 | 38.3 | 50.9 |
| – Strength Index Reading (3 Year Range): | Bullish | Bearish | Bullish |
| NET POSITION MOVEMENT INDEX: | |||
| – 6-Week Change in Strength Index: | -8.0 | 7.6 | 17.0 |
Article By InvestMacro – Receive our weekly COT Newsletter
*COT Report: The COT data, released weekly to the public each Friday, is updated through the most recent Tuesday (data is 3 days old) and shows a quick view of how large speculators or non-commercials (for-profit traders) were positioned in the futures markets.
The CFTC categorizes trader positions according to commercial hedgers (traders who use futures contracts for hedging as part of the business), non-commercials (large traders who speculate to realize trading profits) and nonreportable traders (usually small traders/speculators) as well as their open interest (contracts open in the market at time of reporting). See CFTC criteria here.

- COT Metals Charts: Weekly Speculator Changes led by Copper Jul 26, 2026
- COT Bonds Charts: Speculator Bets led by SOFR 3-Months & 5-Year Bonds Jul 26, 2026
- COT Energy Charts: Weekly Speculator Bets led by WTI Crude & Natural Gas Jul 26, 2026
- COT Soft Commodities Charts: Weekly Speculator Bets led by Corn & Soybeans Jul 26, 2026
- The US introduces new import tariffs for 60 countries. Brent crude surpasses $100 per barrel Jul 24, 2026
- USD/JPY Breaks Records: Nothing Slows the Yen’s Decline Jul 24, 2026
- Oil prices reached a 6‑week high. The AUD strengthened on the back of a strong labor‑market report Jul 23, 2026
- EUR/USD Recovers as Dollar Weakens Jul 23, 2026
- Bitcoin rose to $66,000. The New Zealand dollar continues to strengthen Jul 22, 2026
- Inflationary pressure is easing in Canada. In New Zealand, on the contrary, inflation is rising Jul 21, 2026