
By InvestMacro
Here are the latest charts and statistics for the Commitment of Traders (COT) reports data published by the Commodities Futures Trading Commission (CFTC).
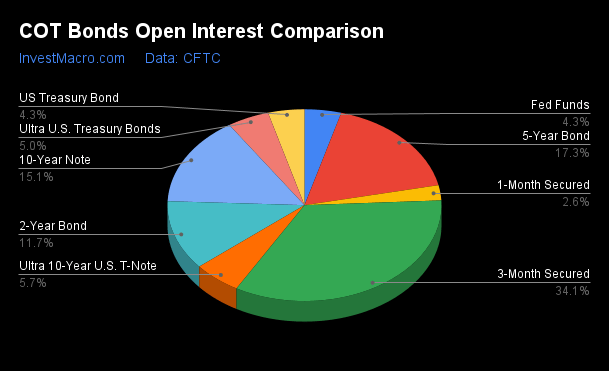
The latest COT data is updated through Tuesday September 5th and shows a quick view of how large traders (for-profit speculators and commercial hedgers) were positioned in the futures markets.
Weekly Speculator Changes led by Fed Funds & 10-Year Bonds
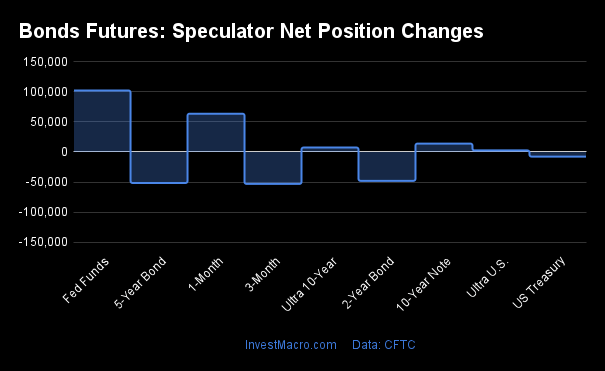
The COT bond market speculator bets were mixed this week as four out of the eight bond markets we cover had higher positioning while the other four markets had lower speculator contracts.
Free Reports:
 Download Our Metatrader 4 Indicators – Put Our Free MetaTrader 4 Custom Indicators on your charts when you join our Weekly Newsletter
 Get our Weekly Commitment of Traders Reports - See where the biggest traders (Hedge Funds and Commercial Hedgers) are positioned in the futures markets on a weekly basis.
Leading the gains for the bond markets was the Fed Funds (102,419 contracts) with the 10-Year Bonds (14,018 contracts), the Ultra 10-Year Bonds (7,444 contracts) and the Ultra Treasury Bonds (2,598 contracts) also showing positive weeks.
The bond markets with declines in speculator bets for the week were the US Treasury Bonds (-7,692 contracts), the 5-Year Bonds (-51,645 contracts), the SOFR 3-Months (-53,150 contracts) and the 2-Year Bonds (-48,034 contracts) also registering lower bets on the week.
| Sep-05-2023 | OI | OI-Index | Spec-Net | Spec-Index | Com-Net | COM-Index | Smalls-Net | Smalls-Index |
|---|---|---|---|---|---|---|---|---|
| SOFR-3-Months | 10,646,087 | 100 | 272,072 | 96 | -267,065 | 3 | -5,007 | 85 |
| FedFunds | 1,352,672 | 34 | -146,890 | 32 | 160,100 | 69 | -13,210 | 65 |
| 2-Year | 3,661,941 | 85 | -1,217,890 | 4 | 1,114,532 | 98 | 103,358 | 90 |
| Long T-Bond | 1,343,057 | 73 | -198,292 | 20 | 152,417 | 65 | 45,875 | 82 |
| 10-Year | 4,718,782 | 90 | -791,535 | 6 | 770,685 | 100 | 20,850 | 78 |
| 5-Year | 5,415,832 | 85 | -1,056,268 | 15 | 969,413 | 81 | 86,855 | 93 |
Strength Scores led by SOFR 3-Months & Fed Funds
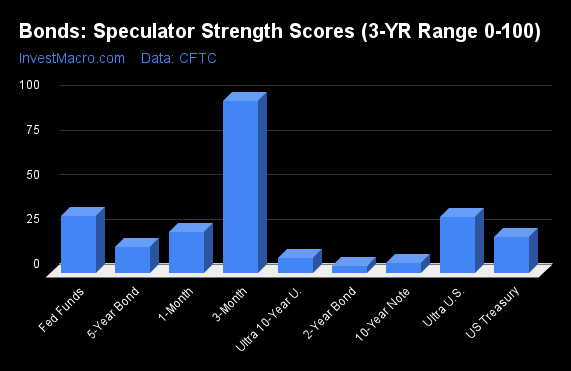
COT Strength Scores (a normalized measure of Speculator positions over a 3-Year range, from 0 to 100 where above 80 is Extreme-Bullish and below 20 is Extreme-Bearish) showed that the SOFR 3-Months (96 percent) and the Fed Funds (32 percent) lead the bond markets this week. The Ultra Treasury Bonds (32 percent) comes in as the next highest in the weekly strength scores.
On the downside, the 2-Year Bonds (4 percent) and the 10-Year Bonds (6 percent) come in at the lowest strength level currently and are in Extreme-Bearish territory (below 20 percent). The next lowest strength scores were the Ultra 10-Year Bonds (8 percent) and the 5-Year Bonds (15 percent).
Strength Statistics:
Fed Funds (31.9 percent) vs Fed Funds previous week (13.1 percent)
2-Year Bond (3.9 percent) vs 2-Year Bond previous week (7.4 percent)
5-Year Bond (14.8 percent) vs 5-Year Bond previous week (18.7 percent)
10-Year Bond (5.7 percent) vs 10-Year Bond previous week (4.3 percent)
Ultra 10-Year Bond (8.4 percent) vs Ultra 10-Year Bond previous week (6.9 percent)
US Treasury Bond (20.1 percent) vs US Treasury Bond previous week (22.6 percent)
Ultra US Treasury Bond (31.6 percent) vs Ultra US Treasury Bond previous week (30.5 percent)
SOFR 3-Months (96.4 percent) vs SOFR 3-Months previous week (100.0 percent)
Ultra Treasury Bonds & SOFR 3-Months top the 6-Week Strength Trends
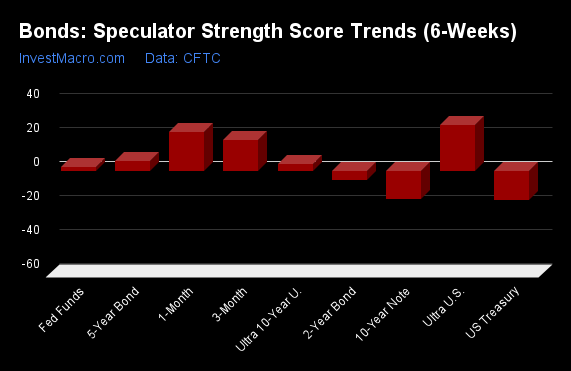
COT Strength Score Trends (or move index, calculates the 6-week changes in strength scores) showed that the Ultra Treasury Bonds (27 percent) and the SOFR 3-Months (18 percent) lead the past six weeks trends for bonds. The 5-Year Bonds (6 percent) and the are the next highest positive movers in the latest trends data.
The US Treasury Bonds (-17 percent) and the 10-Year Bonds (-16 percent) lead the downside trend scores currently with the 2-Year Bonds (-5 percent) and the Fed Funds (2 percent) following next with lower trend scores.
Strength Trend Statistics:
Fed Funds (2.2 percent) vs Fed Funds previous week (-16.3 percent)
2-Year Bond (-5.3 percent) vs 2-Year Bond previous week (-3.7 percent)
5-Year Bond (6.0 percent) vs 5-Year Bond previous week (10.4 percent)
10-Year Bond (-16.3 percent) vs 10-Year Bond previous week (-17.1 percent)
Ultra 10-Year Bond (4.3 percent) vs Ultra 10-Year Bond previous week (0.1 percent)
US Treasury Bond (-17.1 percent) vs US Treasury Bond previous week (-15.4 percent)
Ultra US Treasury Bond (26.8 percent) vs Ultra US Treasury Bond previous week (23.6 percent)
SOFR 3-Months (18.2 percent) vs SOFR 3-Months previous week (26.1 percent)
Secured Overnight Financing Rate (3-Month) Futures:
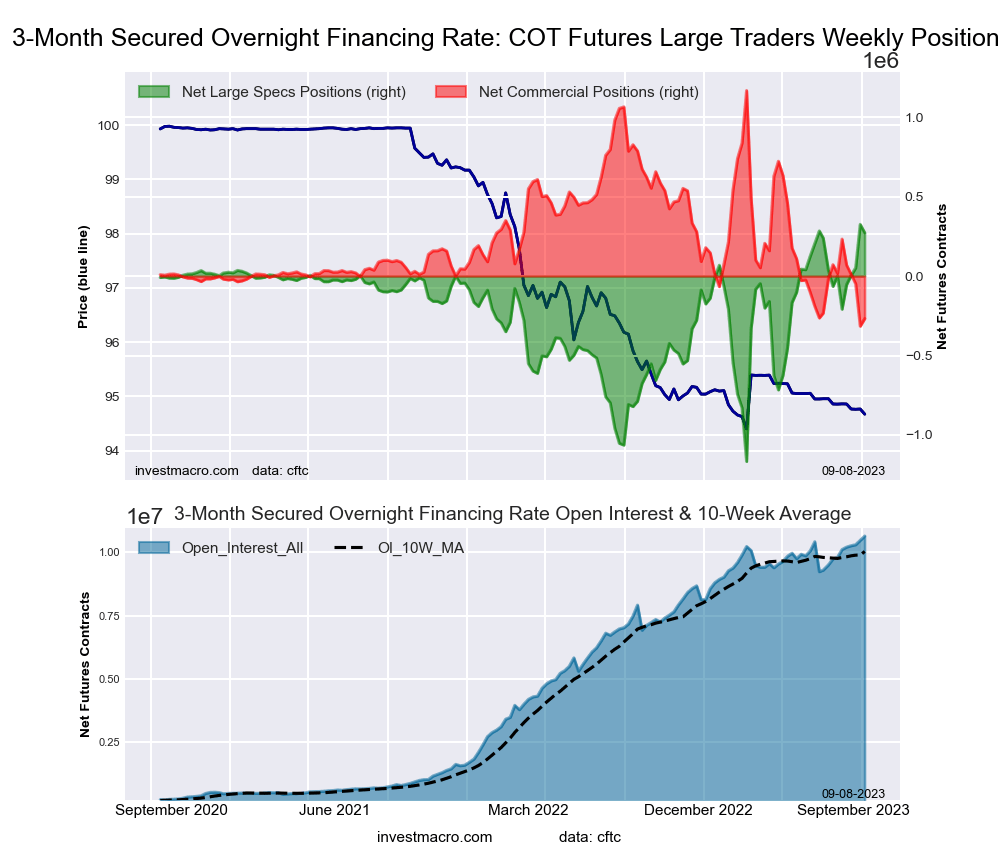 The Secured Overnight Financing Rate (3-Month) large speculator standing this week recorded a net position of 272,072 contracts in the data reported through Tuesday. This was a weekly reduction of -53,150 contracts from the previous week which had a total of 325,222 net contracts.
This week’s current strength score (the trader positioning range over the past three years, measured from 0 to 100) shows the speculators are currently Bullish-Extreme with a score of 96.4 percent. The commercials are Bearish-Extreme with a score of 3.3 percent and the small traders (not shown in chart) are Bullish-Extreme with a score of 85.1 percent.
Price Trend-Following Model: Weak Uptrend
Our weekly trend-following model classifies the current market price position as: Weak Uptrend. The current action for the model is considered to be: Hold – Maintain Long Position.
| SOFR 3-Months Statistics | SPECULATORS | COMMERCIALS | SMALL TRADERS |
| – Percent of Open Interest Longs: | 17.7 | 58.2 | 0.3 |
| – Percent of Open Interest Shorts: | 15.1 | 60.7 | 0.3 |
| – Net Position: | 272,072 | -267,065 | -5,007 |
| – Gross Longs: | 1,882,391 | 6,190,897 | 28,482 |
| – Gross Shorts: | 1,610,319 | 6,457,962 | 33,489 |
| – Long to Short Ratio: | 1.2 to 1 | 1.0 to 1 | 0.9 to 1 |
| NET POSITION TREND: | |||
| – Strength Index Score (3 Year Range Pct): | 96.4 | 3.3 | 85.1 |
| – Strength Index Reading (3 Year Range): | Bullish-Extreme | Bearish-Extreme | Bullish-Extreme |
| NET POSITION MOVEMENT INDEX: | |||
| – 6-Week Change in Strength Index: | 18.2 | -19.1 | 6.2 |
30-Day Federal Funds Futures:
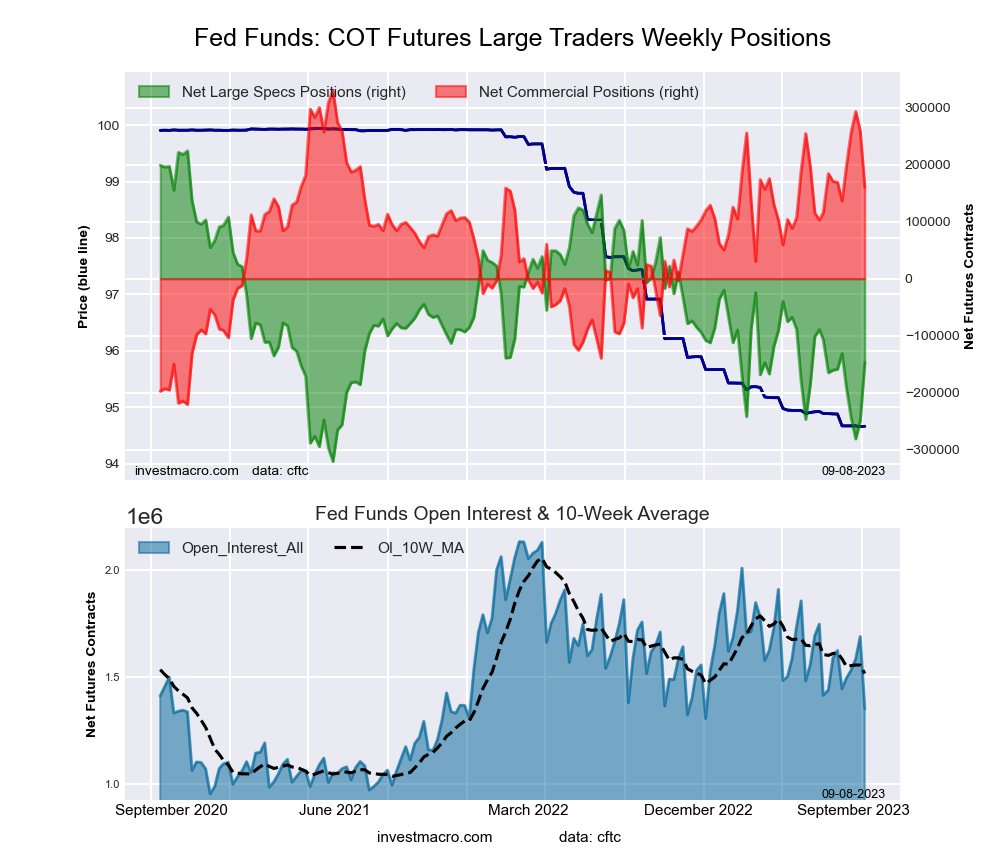 The 30-Day Federal Funds large speculator standing this week recorded a net position of -146,890 contracts in the data reported through Tuesday. This was a weekly rise of 102,419 contracts from the previous week which had a total of -249,309 net contracts.
This week’s current strength score (the trader positioning range over the past three years, measured from 0 to 100) shows the speculators are currently Bearish with a score of 31.9 percent. The commercials are Bullish with a score of 69.1 percent and the small traders (not shown in chart) are Bullish with a score of 65.1 percent.
Price Trend-Following Model: Downtrend
Our weekly trend-following model classifies the current market price position as: Downtrend. The current action for the model is considered to be: Hold – Maintain Short Position.
| 30-Day Federal Funds Statistics | SPECULATORS | COMMERCIALS | SMALL TRADERS |
| – Percent of Open Interest Longs: | 7.1 | 72.5 | 2.2 |
| – Percent of Open Interest Shorts: | 18.0 | 60.6 | 3.2 |
| – Net Position: | -146,890 | 160,100 | -13,210 |
| – Gross Longs: | 96,359 | 980,022 | 29,657 |
| – Gross Shorts: | 243,249 | 819,922 | 42,867 |
| – Long to Short Ratio: | 0.4 to 1 | 1.2 to 1 | 0.7 to 1 |
| NET POSITION TREND: | |||
| – Strength Index Score (3 Year Range Pct): | 31.9 | 69.1 | 65.1 |
| – Strength Index Reading (3 Year Range): | Bearish | Bullish | Bullish |
| NET POSITION MOVEMENT INDEX: | |||
| – 6-Week Change in Strength Index: | 2.2 | -1.7 | -5.2 |
2-Year Treasury Note Futures:
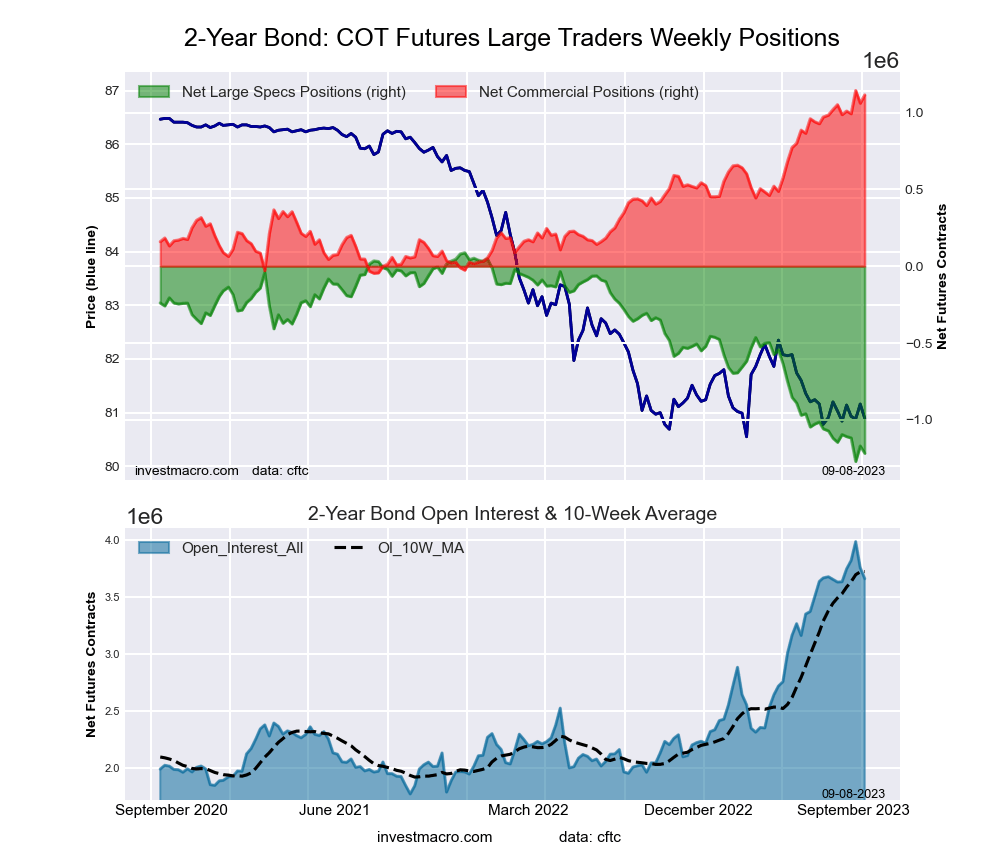 The 2-Year Treasury Note large speculator standing this week recorded a net position of -1,217,890 contracts in the data reported through Tuesday. This was a weekly fall of -48,034 contracts from the previous week which had a total of -1,169,856 net contracts.
This week’s current strength score (the trader positioning range over the past three years, measured from 0 to 100) shows the speculators are currently Bearish-Extreme with a score of 3.9 percent. The commercials are Bullish-Extreme with a score of 97.6 percent and the small traders (not shown in chart) are Bullish-Extreme with a score of 90.0 percent.
Price Trend-Following Model: Downtrend
Our weekly trend-following model classifies the current market price position as: Downtrend. The current action for the model is considered to be: Hold – Maintain Short Position.
| 2-Year Treasury Note Statistics | SPECULATORS | COMMERCIALS | SMALL TRADERS |
| – Percent of Open Interest Longs: | 9.3 | 82.3 | 7.0 |
| – Percent of Open Interest Shorts: | 42.6 | 51.8 | 4.2 |
| – Net Position: | -1,217,890 | 1,114,532 | 103,358 |
| – Gross Longs: | 341,198 | 3,013,032 | 255,487 |
| – Gross Shorts: | 1,559,088 | 1,898,500 | 152,129 |
| – Long to Short Ratio: | 0.2 to 1 | 1.6 to 1 | 1.7 to 1 |
| NET POSITION TREND: | |||
| – Strength Index Score (3 Year Range Pct): | 3.9 | 97.6 | 90.0 |
| – Strength Index Reading (3 Year Range): | Bearish-Extreme | Bullish-Extreme | Bullish-Extreme |
| NET POSITION MOVEMENT INDEX: | |||
| – 6-Week Change in Strength Index: | -5.3 | 5.3 | 3.4 |
5-Year Treasury Note Futures:
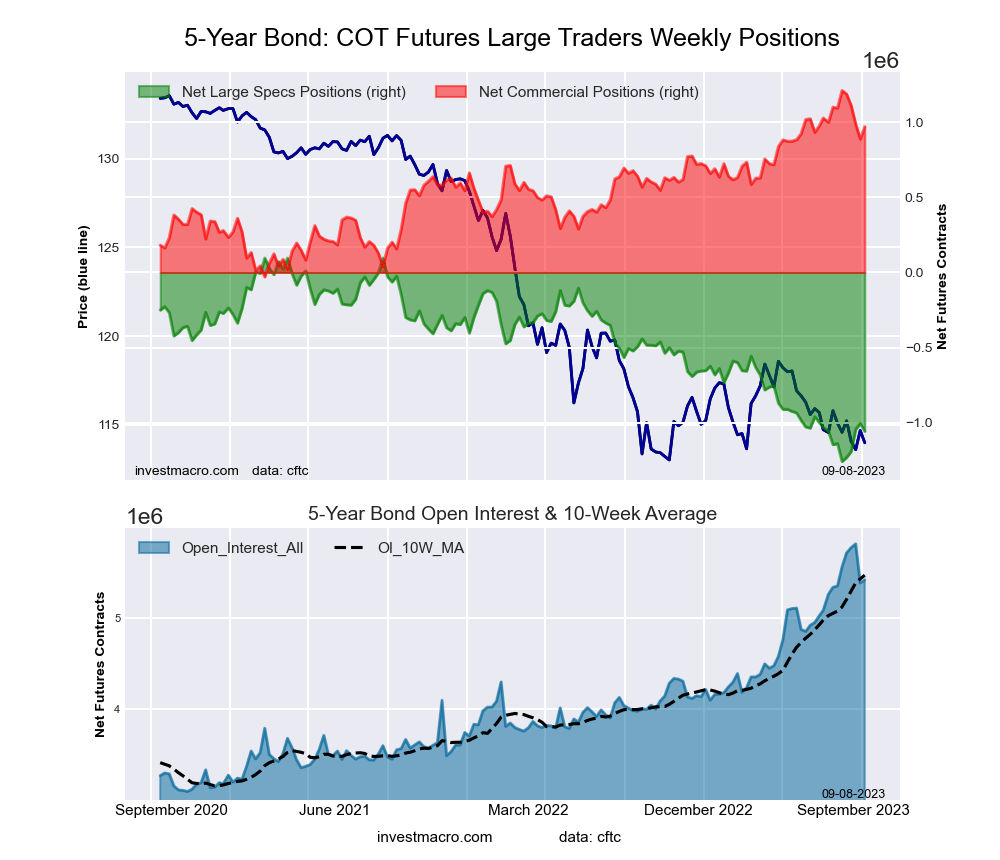 The 5-Year Treasury Note large speculator standing this week recorded a net position of -1,056,268 contracts in the data reported through Tuesday. This was a weekly decline of -51,645 contracts from the previous week which had a total of -1,004,623 net contracts.
This week’s current strength score (the trader positioning range over the past three years, measured from 0 to 100) shows the speculators are currently Bearish-Extreme with a score of 14.8 percent. The commercials are Bullish-Extreme with a score of 80.6 percent and the small traders (not shown in chart) are Bullish-Extreme with a score of 92.5 percent.
Price Trend-Following Model: Downtrend
Our weekly trend-following model classifies the current market price position as: Downtrend. The current action for the model is considered to be: Hold – Maintain Short Position.
| 5-Year Treasury Note Statistics | SPECULATORS | COMMERCIALS | SMALL TRADERS |
| – Percent of Open Interest Longs: | 7.8 | 83.6 | 7.7 |
| – Percent of Open Interest Shorts: | 27.3 | 65.7 | 6.1 |
| – Net Position: | -1,056,268 | 969,413 | 86,855 |
| – Gross Longs: | 424,157 | 4,525,006 | 414,910 |
| – Gross Shorts: | 1,480,425 | 3,555,593 | 328,055 |
| – Long to Short Ratio: | 0.3 to 1 | 1.3 to 1 | 1.3 to 1 |
| NET POSITION TREND: | |||
| – Strength Index Score (3 Year Range Pct): | 14.8 | 80.6 | 92.5 |
| – Strength Index Reading (3 Year Range): | Bearish-Extreme | Bullish-Extreme | Bullish-Extreme |
| NET POSITION MOVEMENT INDEX: | |||
| – 6-Week Change in Strength Index: | 6.0 | -10.0 | 10.2 |
10-Year Treasury Note Futures:
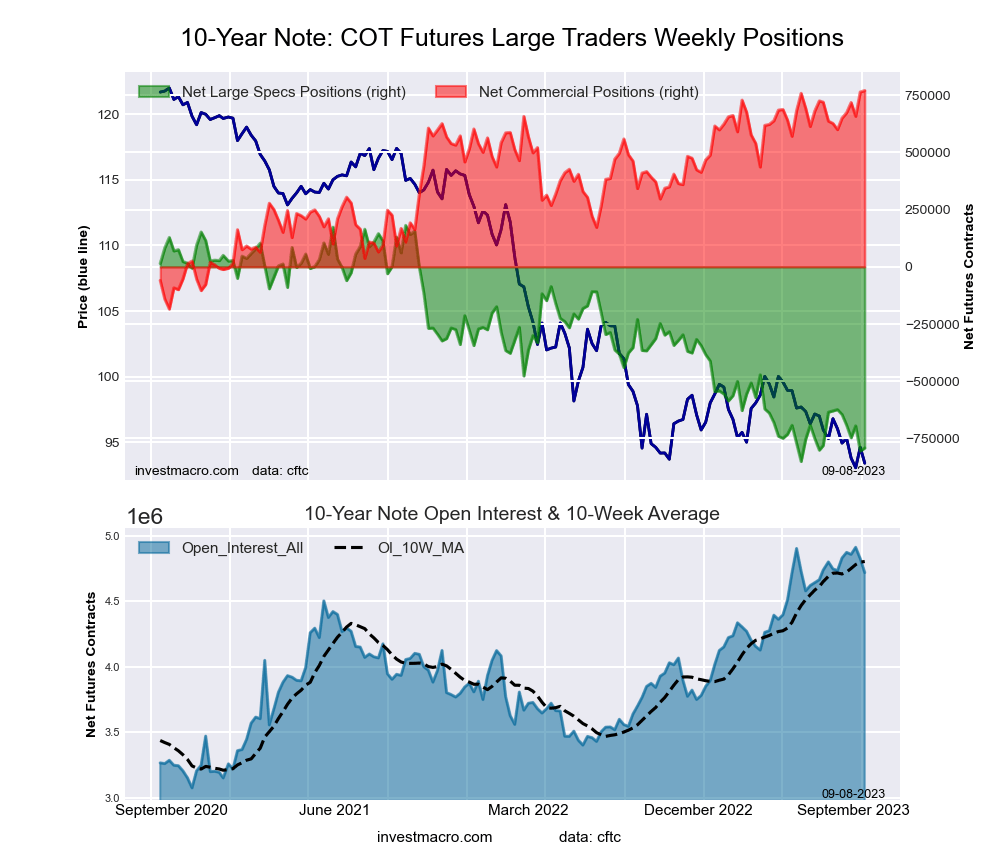 The 10-Year Treasury Note large speculator standing this week recorded a net position of -791,535 contracts in the data reported through Tuesday. This was a weekly increase of 14,018 contracts from the previous week which had a total of -805,553 net contracts.
This week’s current strength score (the trader positioning range over the past three years, measured from 0 to 100) shows the speculators are currently Bearish-Extreme with a score of 5.7 percent. The commercials are Bullish-Extreme with a score of 100.0 percent and the small traders (not shown in chart) are Bullish with a score of 78.1 percent.
Price Trend-Following Model: Downtrend
Our weekly trend-following model classifies the current market price position as: Downtrend. The current action for the model is considered to be: Hold – Maintain Short Position.
| 10-Year Treasury Note Statistics | SPECULATORS | COMMERCIALS | SMALL TRADERS |
| – Percent of Open Interest Longs: | 9.6 | 79.2 | 8.8 |
| – Percent of Open Interest Shorts: | 26.4 | 62.9 | 8.4 |
| – Net Position: | -791,535 | 770,685 | 20,850 |
| – Gross Longs: | 454,880 | 3,738,091 | 416,866 |
| – Gross Shorts: | 1,246,415 | 2,967,406 | 396,016 |
| – Long to Short Ratio: | 0.4 to 1 | 1.3 to 1 | 1.1 to 1 |
| NET POSITION TREND: | |||
| – Strength Index Score (3 Year Range Pct): | 5.7 | 100.0 | 78.1 |
| – Strength Index Reading (3 Year Range): | Bearish-Extreme | Bullish-Extreme | Bullish |
| NET POSITION MOVEMENT INDEX: | |||
| – 6-Week Change in Strength Index: | -16.3 | 17.9 | -0.7 |
Ultra 10-Year Notes Futures:
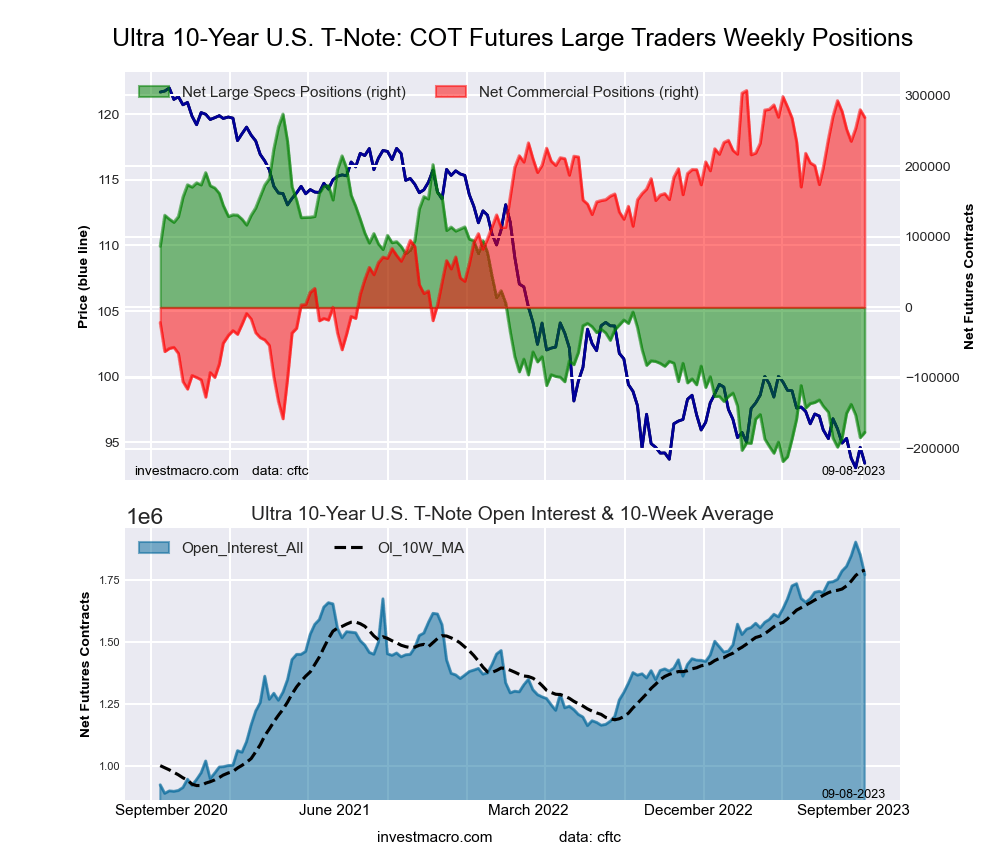 The Ultra 10-Year Notes large speculator standing this week recorded a net position of -177,048 contracts in the data reported through Tuesday. This was a weekly rise of 7,444 contracts from the previous week which had a total of -184,492 net contracts.
This week’s current strength score (the trader positioning range over the past three years, measured from 0 to 100) shows the speculators are currently Bearish-Extreme with a score of 8.4 percent. The commercials are Bullish-Extreme with a score of 91.8 percent and the small traders (not shown in chart) are Bullish with a score of 59.5 percent.
Price Trend-Following Model: Weak Uptrend
Our weekly trend-following model classifies the current market price position as: Weak Uptrend. The current action for the model is considered to be: Hold – Maintain Long Position.
| Ultra 10-Year Notes Statistics | SPECULATORS | COMMERCIALS | SMALL TRADERS |
| – Percent of Open Interest Longs: | 11.6 | 76.8 | 10.1 |
| – Percent of Open Interest Shorts: | 21.6 | 61.6 | 15.3 |
| – Net Position: | -177,048 | 268,877 | -91,829 |
| – Gross Longs: | 206,129 | 1,360,518 | 179,479 |
| – Gross Shorts: | 383,177 | 1,091,641 | 271,308 |
| – Long to Short Ratio: | 0.5 to 1 | 1.2 to 1 | 0.7 to 1 |
| NET POSITION TREND: | |||
| – Strength Index Score (3 Year Range Pct): | 8.4 | 91.8 | 59.5 |
| – Strength Index Reading (3 Year Range): | Bearish-Extreme | Bullish-Extreme | Bullish |
| NET POSITION MOVEMENT INDEX: | |||
| – 6-Week Change in Strength Index: | 4.3 | -5.1 | 1.6 |
US Treasury Bonds Futures:
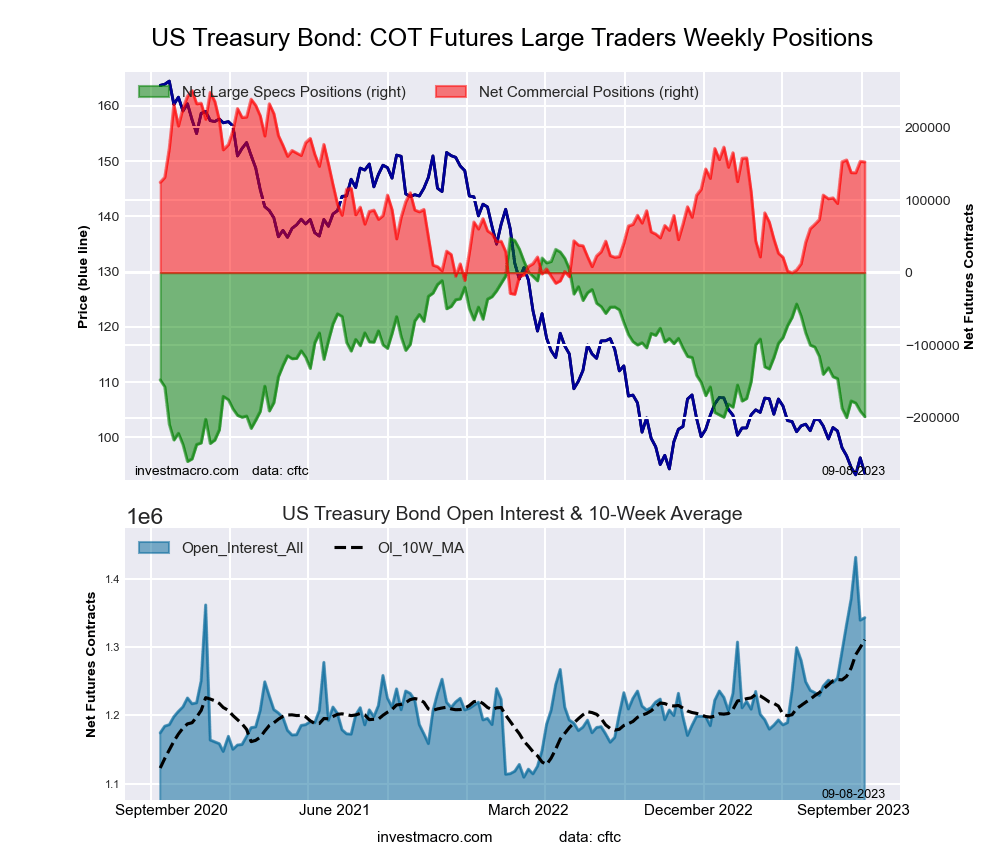 The US Treasury Bonds large speculator standing this week recorded a net position of -198,292 contracts in the data reported through Tuesday. This was a weekly lowering of -7,692 contracts from the previous week which had a total of -190,600 net contracts.
This week’s current strength score (the trader positioning range over the past three years, measured from 0 to 100) shows the speculators are currently Bearish with a score of 20.1 percent. The commercials are Bullish with a score of 65.0 percent and the small traders (not shown in chart) are Bullish-Extreme with a score of 81.8 percent.
Price Trend-Following Model: Strong Downtrend
Our weekly trend-following model classifies the current market price position as: Strong Downtrend. The current action for the model is considered to be: Hold – Maintain Short Position.
| US Treasury Bonds Statistics | SPECULATORS | COMMERCIALS | SMALL TRADERS |
| – Percent of Open Interest Longs: | 6.2 | 78.5 | 14.3 |
| – Percent of Open Interest Shorts: | 21.0 | 67.1 | 10.9 |
| – Net Position: | -198,292 | 152,417 | 45,875 |
| – Gross Longs: | 83,153 | 1,053,899 | 191,920 |
| – Gross Shorts: | 281,445 | 901,482 | 146,045 |
| – Long to Short Ratio: | 0.3 to 1 | 1.2 to 1 | 1.3 to 1 |
| NET POSITION TREND: | |||
| – Strength Index Score (3 Year Range Pct): | 20.1 | 65.0 | 81.8 |
| – Strength Index Reading (3 Year Range): | Bearish | Bullish | Bullish-Extreme |
| NET POSITION MOVEMENT INDEX: | |||
| – 6-Week Change in Strength Index: | -17.1 | 20.4 | -3.5 |
Ultra US Treasury Bonds Futures:
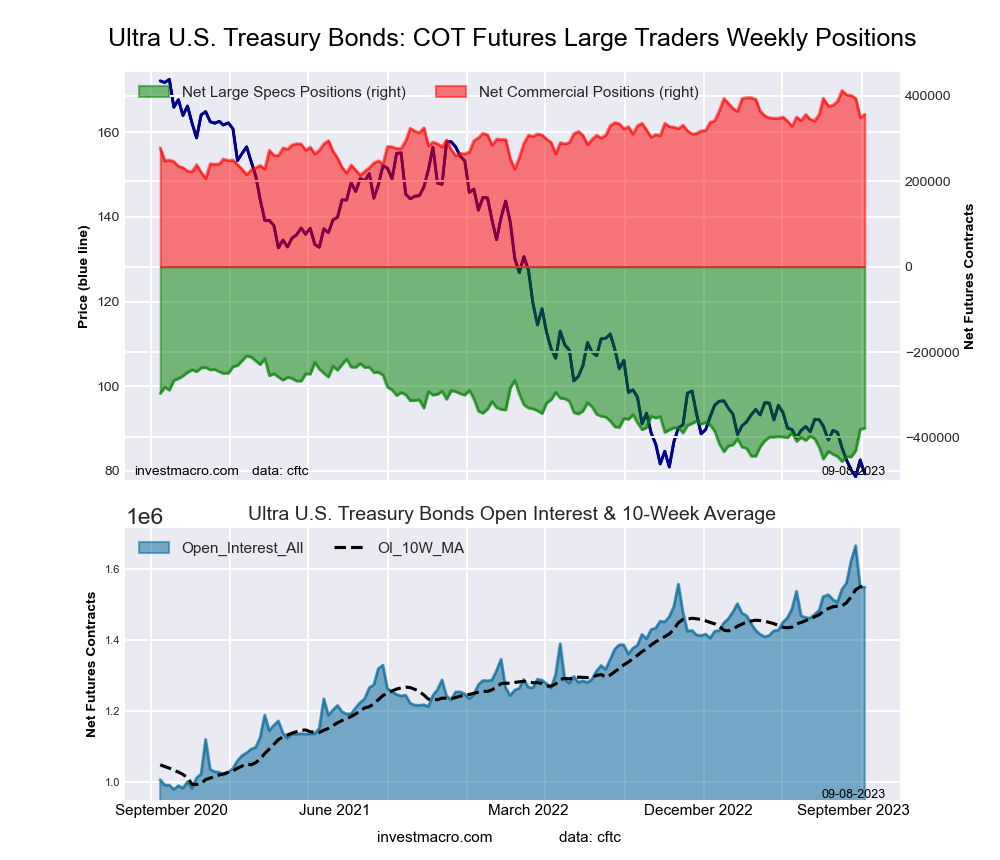 The Ultra US Treasury Bonds large speculator standing this week recorded a net position of -378,271 contracts in the data reported through Tuesday. This was a weekly boost of 2,598 contracts from the previous week which had a total of -380,869 net contracts.
This week’s current strength score (the trader positioning range over the past three years, measured from 0 to 100) shows the speculators are currently Bearish with a score of 31.6 percent. The commercials are Bullish with a score of 72.9 percent and the small traders (not shown in chart) are Bullish with a score of 57.4 percent.
Price Trend-Following Model: Strong Downtrend
Our weekly trend-following model classifies the current market price position as: Strong Downtrend. The current action for the model is considered to be: Hold – Maintain Short Position.
| Ultra US Treasury Bonds Statistics | SPECULATORS | COMMERCIALS | SMALL TRADERS |
| – Percent of Open Interest Longs: | 5.6 | 82.6 | 11.1 |
| – Percent of Open Interest Shorts: | 30.0 | 59.6 | 9.7 |
| – Net Position: | -378,271 | 356,792 | 21,479 |
| – Gross Longs: | 86,222 | 1,279,191 | 171,723 |
| – Gross Shorts: | 464,493 | 922,399 | 150,244 |
| – Long to Short Ratio: | 0.2 to 1 | 1.4 to 1 | 1.1 to 1 |
| NET POSITION TREND: | |||
| – Strength Index Score (3 Year Range Pct): | 31.6 | 72.9 | 57.4 |
| – Strength Index Reading (3 Year Range): | Bearish | Bullish | Bullish |
| NET POSITION MOVEMENT INDEX: | |||
| – 6-Week Change in Strength Index: | 26.8 | -14.9 | -33.6 |
Article By InvestMacro – Receive our weekly COT Newsletter
*COT Report: The COT data, released weekly to the public each Friday, is updated through the most recent Tuesday (data is 3 days old) and shows a quick view of how large speculators or non-commercials (for-profit traders) were positioned in the futures markets.
The CFTC categorizes trader positions according to commercial hedgers (traders who use futures contracts for hedging as part of the business), non-commercials (large traders who speculate to realize trading profits) and nonreportable traders (usually small traders/speculators) as well as their open interest (contracts open in the market at time of reporting). See CFTC criteria here.

- COT Metals Charts: Weekly Speculator Changes led by Copper Jul 26, 2026
- COT Bonds Charts: Speculator Bets led by SOFR 3-Months & 5-Year Bonds Jul 26, 2026
- COT Energy Charts: Weekly Speculator Bets led by WTI Crude & Natural Gas Jul 26, 2026
- COT Soft Commodities Charts: Weekly Speculator Bets led by Corn & Soybeans Jul 26, 2026
- The US introduces new import tariffs for 60 countries. Brent crude surpasses $100 per barrel Jul 24, 2026
- USD/JPY Breaks Records: Nothing Slows the Yen’s Decline Jul 24, 2026
- Oil prices reached a 6‑week high. The AUD strengthened on the back of a strong labor‑market report Jul 23, 2026
- EUR/USD Recovers as Dollar Weakens Jul 23, 2026
- Bitcoin rose to $66,000. The New Zealand dollar continues to strengthen Jul 22, 2026
- Inflationary pressure is easing in Canada. In New Zealand, on the contrary, inflation is rising Jul 21, 2026