
By InvestMacro
Here are the latest charts and statistics for the Commitment of Traders (COT) reports data published by the Commodities Futures Trading Commission (CFTC).
The latest COT data is updated through Tuesday October 3rd and shows a quick view of how large traders (for-profit speculators and commercial entities) were positioned in the futures markets.
Weekly Speculator Changes led by Cotton & Corn
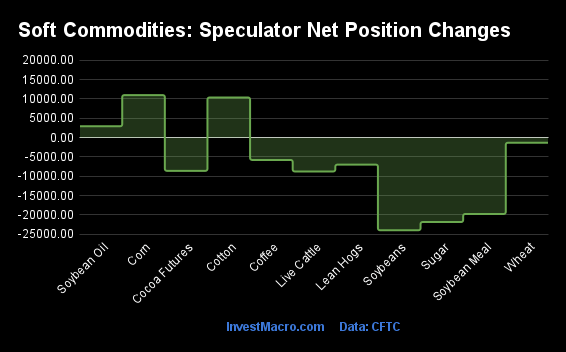
The COT soft commodities markets speculator bets were lower this week as three out of the eleven softs markets we cover had higher positioning while the other eight markets had lower speculator contracts.
Leading the gains for the softs markets was Corn (10,996 contracts) with Cotton (10,382 contracts) and Soybean Oil (2,936 contracts) also showing positive weeks.
The markets with the declines in speculator bets this week were Soybeans (-23,985 contracts) with Sugar (-21,858 contracts), Soybean Meal (-19,769 contracts), Live Cattle (-8,766 contracts), Cocoa (-8,605 contracts) and Lean Hogs (-6,998 contracts), Coffee (-5,787 contracts) and Wheat (-1,333 contracts) also registering lower bets on the week.
| Oct-03-2023 | OI | OI-Index | Spec-Net | Spec-Index | Com-Net | COM-Index | Smalls-Net | Smalls-Index |
|---|---|---|---|---|---|---|---|---|
| WTI Crude | 1,787,495 | 35 | 349,560 | 53 | -381,946 | 50 | 32,386 | 45 |
| Gold | 431,226 | 4 | 91,226 | 17 | -111,982 | 81 | 20,756 | 32 |
| Silver | 125,847 | 14 | 15,344 | 40 | -30,358 | 57 | 15,014 | 50 |
| Copper | 208,795 | 49 | -21,912 | 12 | 19,952 | 88 | 1,960 | 31 |
| Palladium | 18,421 | 86 | -9,718 | 9 | 9,861 | 93 | -143 | 33 |
| Platinum | 81,529 | 85 | 2,616 | 22 | -7,514 | 78 | 4,898 | 34 |
| Natural Gas | 1,174,386 | 44 | -79,200 | 40 | 61,763 | 64 | 17,437 | 22 |
| Brent | 118,926 | 0 | -36,543 | 41 | 35,921 | 65 | 622 | 18 |
| Heating Oil | 330,825 | 48 | 38,946 | 93 | -66,348 | 5 | 27,402 | 93 |
| Soybeans | 803,439 | 49 | 22,503 | 0 | -5,880 | 95 | -16,623 | 64 |
| Corn | 1,367,904 | 23 | -107,544 | 2 | 140,803 | 98 | -33,259 | 86 |
| Coffee | 210,215 | 25 | -14,449 | 13 | 13,474 | 89 | 975 | 24 |
| Sugar | 820,468 | 30 | 217,382 | 68 | -255,129 | 32 | 37,747 | 52 |
| Wheat | 429,333 | 83 | -61,347 | 23 | 58,242 | 76 | 3,105 | 82 |
Strength Scores led by Cocoa & Live Cattle
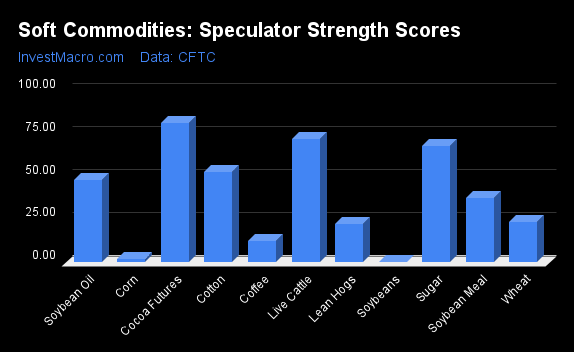
COT Strength Scores (a normalized measure of Speculator positions over a 3-Year range, from 0 to 100 where above 80 is Extreme-Bullish and below 20 is Extreme-Bearish) showed that Cocoa (81 percent) and Live Cattle (72 percent) lead the softs markets this week. Sugar (68 percent), Cotton (52 percent) and Soybean Oil (48 percent) come in as the next highest in the weekly strength scores.
On the downside, Soybeans (0 percent), Corn (2 percent) and Coffee (13 percent) come in at the lowest strength levels currently and are in Extreme-Bearish territory (below 20 percent).
Strength Statistics:
Corn (1.7 percent) vs Corn previous week (0.0 percent)
Sugar (67.7 percent) vs Sugar previous week (75.5 percent)
Coffee (12.6 percent) vs Coffee previous week (18.5 percent)
Soybeans (0.0 percent) vs Soybeans previous week (9.2 percent)
Soybean Oil (47.7 percent) vs Soybean Oil previous week (46.0 percent)
Soybean Meal (37.5 percent) vs Soybean Meal previous week (48.5 percent)
Live Cattle (72.1 percent) vs Live Cattle previous week (81.5 percent)
Lean Hogs (22.2 percent) vs Lean Hogs previous week (28.0 percent)
Cotton (52.5 percent) vs Cotton previous week (44.7 percent)
Cocoa (81.3 percent) vs Cocoa previous week (90.1 percent)
Wheat (23.2 percent) vs Wheat previous week (24.1 percent)
Cotton & Sugar top the 6-Week Strength Trends
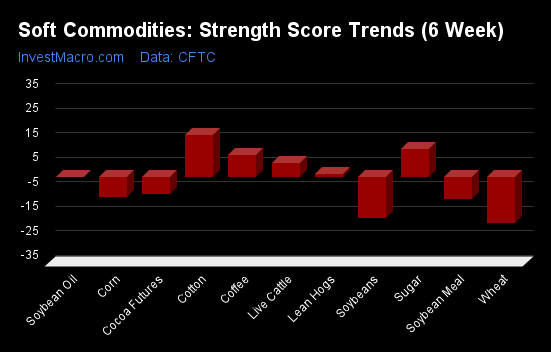
COT Strength Score Trends (or move index, calculates the 6-week changes in strength scores) showed that Cotton (17 percent) and Sugar (11 percent) lead the past six weeks trends for soft commodities. Coffee (9 percent), Live Cattle (6 percent) and Lean Hogs (1 percent) are the next highest positive movers in the latest trends data.
Wheat (-19 percent) leads the downside trend scores currently with Soybeans (-17 percent), Soybean Meal (-9 percent) and Corn (-8 percent) following next with lower trend scores.
Strength Trend Statistics:
Corn (-8.4 percent) vs Corn previous week (-13.7 percent)
Sugar (11.4 percent) vs Sugar previous week (16.9 percent)
Coffee (8.8 percent) vs Coffee previous week (10.3 percent)
Soybeans (-16.8 percent) vs Soybeans previous week (-7.3 percent)
Soybean Oil (-0.4 percent) vs Soybean Oil previous week (-1.2 percent)
Soybean Meal (-9.0 percent) vs Soybean Meal previous week (-2.9 percent)
Live Cattle (5.7 percent) vs Live Cattle previous week (4.8 percent)
Lean Hogs (1.1 percent) vs Lean Hogs previous week (7.1 percent)
Cotton (16.9 percent) vs Cotton previous week (5.3 percent)
Cocoa (-7.2 percent) vs Cocoa previous week (1.4 percent)
Wheat (-18.9 percent) vs Wheat previous week (-20.0 percent)
Individual Soft Commodities Markets:
CORN Futures:
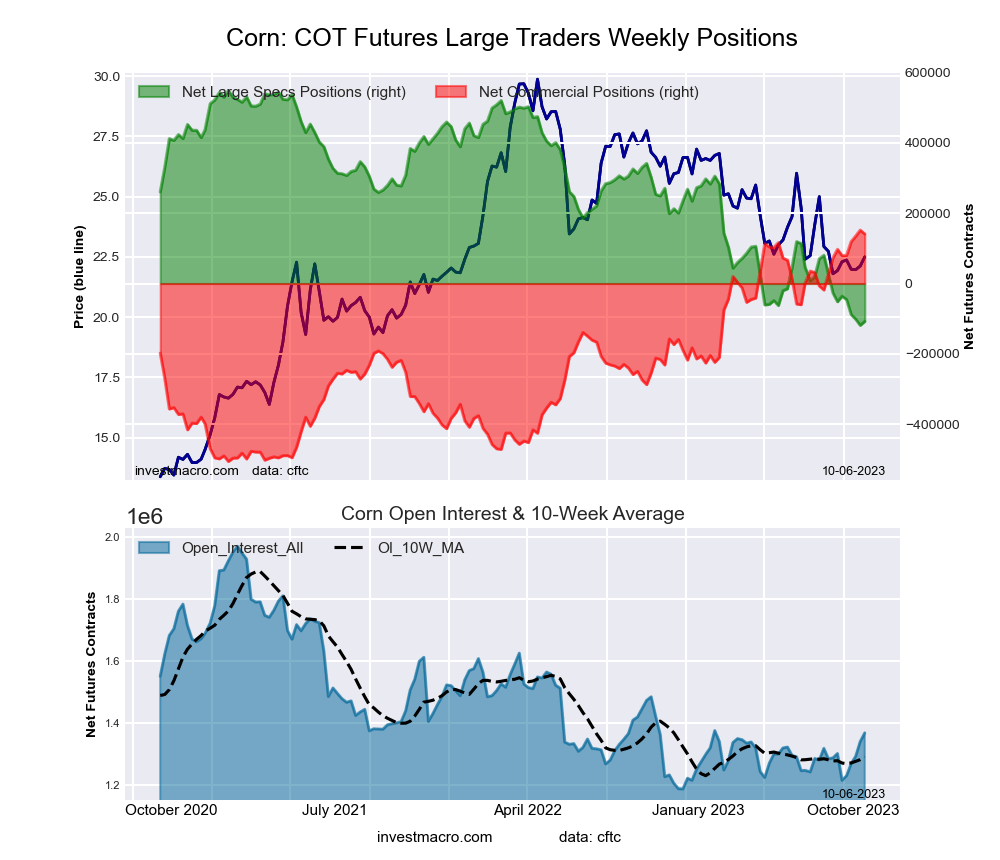 The CORN large speculator standing this week reached a net position of -107,544 contracts in the data reported through Tuesday. This was a weekly increase of 10,996 contracts from the previous week which had a total of -118,540 net contracts.
This week’s current strength score (the trader positioning range over the past three years, measured from 0 to 100) shows the speculators are currently Bearish-Extreme with a score of 1.7 percent. The commercials are Bullish-Extreme with a score of 98.4 percent and the small traders (not shown in chart) are Bullish-Extreme with a score of 85.6 percent.
Price Trend-Following Model: Downtrend
Our weekly trend-following model classifies the current market price position as: Downtrend. The current action for the model is considered to be: Hold – Maintain Short Position.
| CORN Futures Statistics | SPECULATORS | COMMERCIALS | SMALL TRADERS |
| – Percent of Open Interest Longs: | 20.6 | 49.2 | 10.0 |
| – Percent of Open Interest Shorts: | 28.4 | 38.9 | 12.5 |
| – Net Position: | -107,544 | 140,803 | -33,259 |
| – Gross Longs: | 281,318 | 672,709 | 137,063 |
| – Gross Shorts: | 388,862 | 531,906 | 170,322 |
| – Long to Short Ratio: | 0.7 to 1 | 1.3 to 1 | 0.8 to 1 |
| NET POSITION TREND: | |||
| – Strength Index Score (3 Year Range Pct): | 1.7 | 98.4 | 85.6 |
| – Strength Index Reading (3 Year Range): | Bearish-Extreme | Bullish-Extreme | Bullish-Extreme |
| NET POSITION MOVEMENT INDEX: | |||
| – 6-Week Change in Strength Index: | -8.4 | 6.7 | 21.7 |
SUGAR Futures:
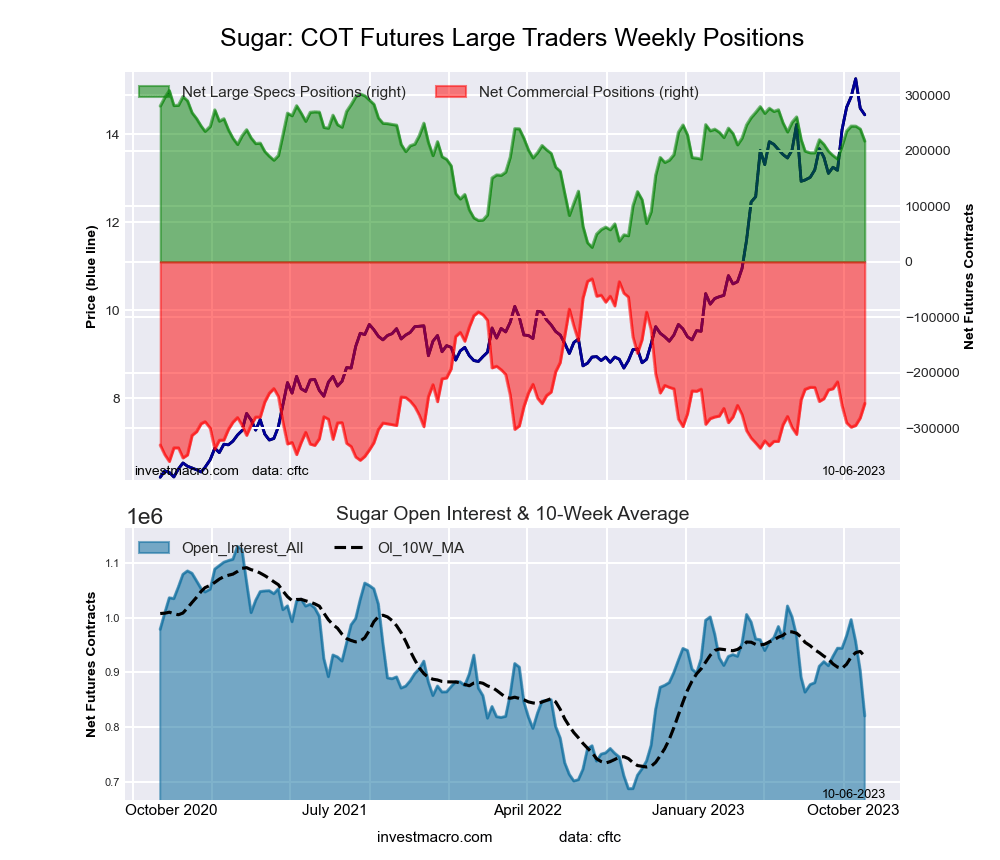 The SUGAR large speculator standing this week reached a net position of 217,382 contracts in the data reported through Tuesday. This was a weekly lowering of -21,858 contracts from the previous week which had a total of 239,240 net contracts.
This week’s current strength score (the trader positioning range over the past three years, measured from 0 to 100) shows the speculators are currently Bullish with a score of 67.7 percent. The commercials are Bearish with a score of 31.7 percent and the small traders (not shown in chart) are Bullish with a score of 51.6 percent.
Price Trend-Following Model: Strong Uptrend
Our weekly trend-following model classifies the current market price position as: Strong Uptrend. The current action for the model is considered to be: Hold – Maintain Long Position.
| SUGAR Futures Statistics | SPECULATORS | COMMERCIALS | SMALL TRADERS |
| – Percent of Open Interest Longs: | 37.2 | 39.0 | 10.4 |
| – Percent of Open Interest Shorts: | 10.7 | 70.1 | 5.8 |
| – Net Position: | 217,382 | -255,129 | 37,747 |
| – Gross Longs: | 305,051 | 320,294 | 85,730 |
| – Gross Shorts: | 87,669 | 575,423 | 47,983 |
| – Long to Short Ratio: | 3.5 to 1 | 0.6 to 1 | 1.8 to 1 |
| NET POSITION TREND: | |||
| – Strength Index Score (3 Year Range Pct): | 67.7 | 31.7 | 51.6 |
| – Strength Index Reading (3 Year Range): | Bullish | Bearish | Bullish |
| NET POSITION MOVEMENT INDEX: | |||
| – 6-Week Change in Strength Index: | 11.4 | -11.8 | 8.9 |
COFFEE Futures:
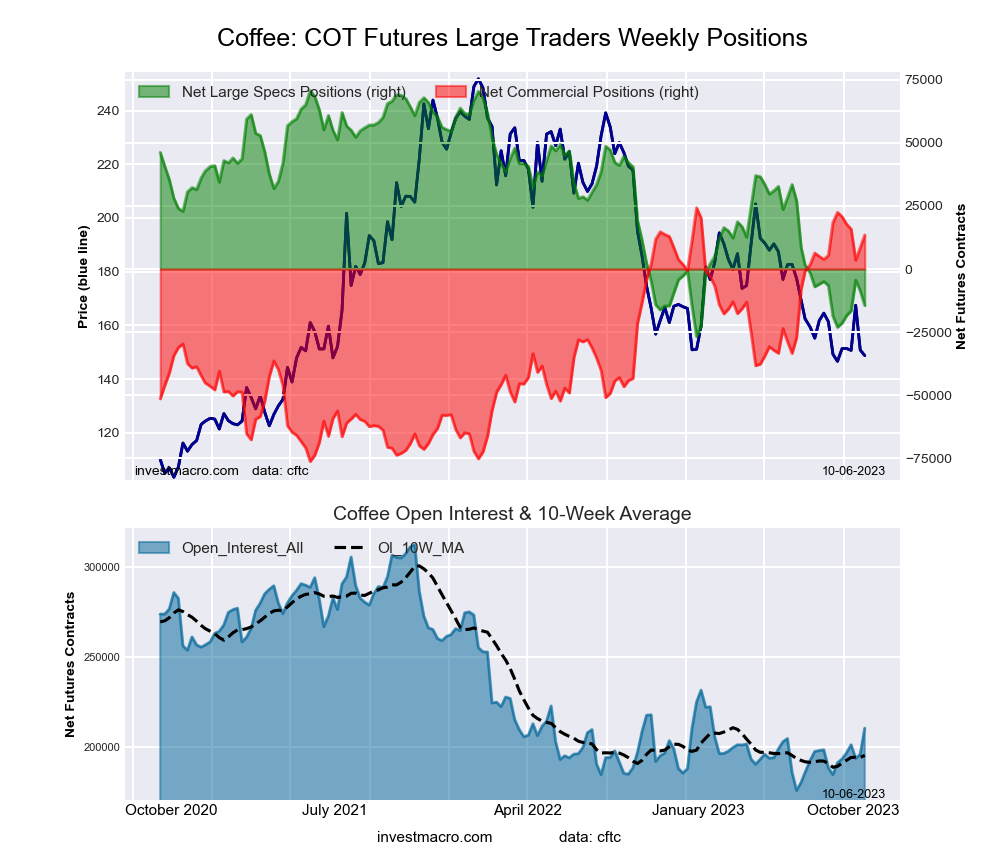 The COFFEE large speculator standing this week reached a net position of -14,449 contracts in the data reported through Tuesday. This was a weekly decline of -5,787 contracts from the previous week which had a total of -8,662 net contracts.
This week’s current strength score (the trader positioning range over the past three years, measured from 0 to 100) shows the speculators are currently Bearish-Extreme with a score of 12.6 percent. The commercials are Bullish-Extreme with a score of 89.3 percent and the small traders (not shown in chart) are Bearish with a score of 24.4 percent.
Price Trend-Following Model: Downtrend
Our weekly trend-following model classifies the current market price position as: Downtrend. The current action for the model is considered to be: Hold – Maintain Short Position.
| COFFEE Futures Statistics | SPECULATORS | COMMERCIALS | SMALL TRADERS |
| – Percent of Open Interest Longs: | 25.7 | 45.8 | 4.8 |
| – Percent of Open Interest Shorts: | 32.5 | 39.4 | 4.3 |
| – Net Position: | -14,449 | 13,474 | 975 |
| – Gross Longs: | 53,926 | 96,217 | 10,119 |
| – Gross Shorts: | 68,375 | 82,743 | 9,144 |
| – Long to Short Ratio: | 0.8 to 1 | 1.2 to 1 | 1.1 to 1 |
| NET POSITION TREND: | |||
| – Strength Index Score (3 Year Range Pct): | 12.6 | 89.3 | 24.4 |
| – Strength Index Reading (3 Year Range): | Bearish-Extreme | Bullish-Extreme | Bearish |
| NET POSITION MOVEMENT INDEX: | |||
| – 6-Week Change in Strength Index: | 8.8 | -8.9 | 4.5 |
SOYBEANS Futures:
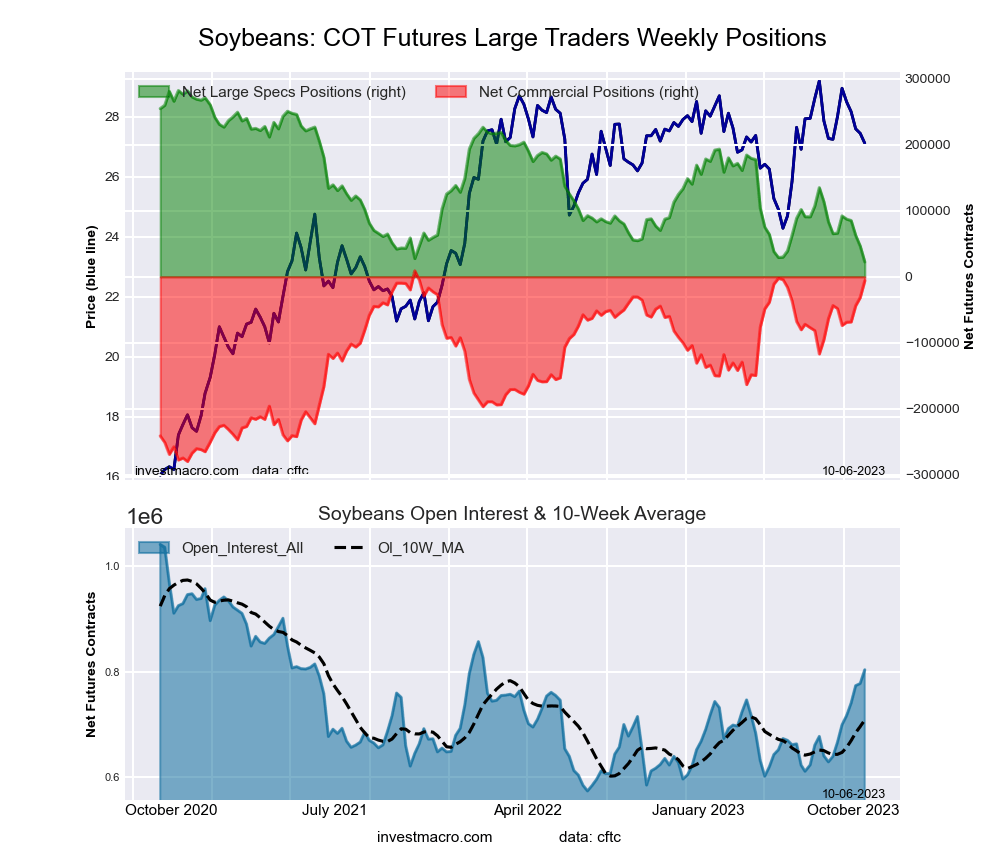 The SOYBEANS large speculator standing this week reached a net position of 22,503 contracts in the data reported through Tuesday. This was a weekly fall of -23,985 contracts from the previous week which had a total of 46,488 net contracts.
This week’s current strength score (the trader positioning range over the past three years, measured from 0 to 100) shows the speculators are currently Bearish-Extreme with a score of 0.0 percent. The commercials are Bullish-Extreme with a score of 94.8 percent and the small traders (not shown in chart) are Bullish with a score of 64.0 percent.
Price Trend-Following Model: Weak Uptrend
Our weekly trend-following model classifies the current market price position as: Weak Uptrend. The current action for the model is considered to be: Hold – Maintain Long Position.
| SOYBEANS Futures Statistics | SPECULATORS | COMMERCIALS | SMALL TRADERS |
| – Percent of Open Interest Longs: | 15.4 | 50.9 | 6.5 |
| – Percent of Open Interest Shorts: | 12.6 | 51.6 | 8.6 |
| – Net Position: | 22,503 | -5,880 | -16,623 |
| – Gross Longs: | 123,800 | 408,742 | 52,183 |
| – Gross Shorts: | 101,297 | 414,622 | 68,806 |
| – Long to Short Ratio: | 1.2 to 1 | 1.0 to 1 | 0.8 to 1 |
| NET POSITION TREND: | |||
| – Strength Index Score (3 Year Range Pct): | 0.0 | 94.8 | 64.0 |
| – Strength Index Reading (3 Year Range): | Bearish-Extreme | Bullish-Extreme | Bullish |
| NET POSITION MOVEMENT INDEX: | |||
| – 6-Week Change in Strength Index: | -16.8 | 14.6 | 3.3 |
SOYBEAN OIL Futures:
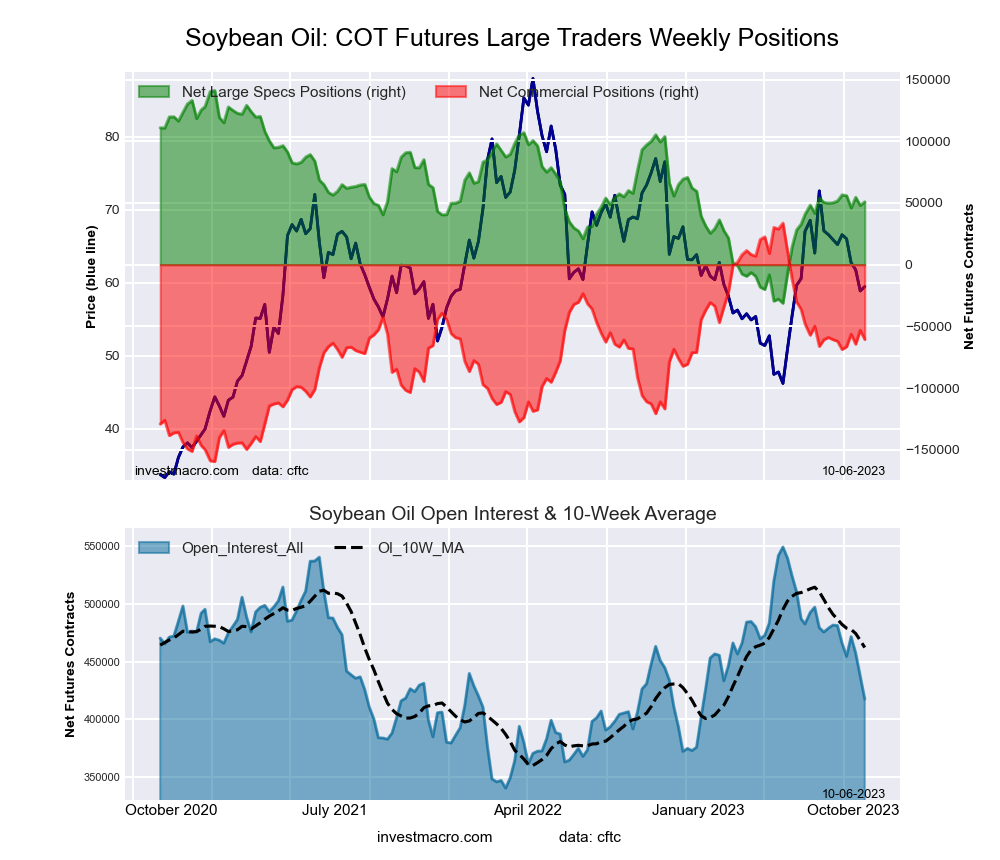 The SOYBEAN OIL large speculator standing this week reached a net position of 50,941 contracts in the data reported through Tuesday. This was a weekly boost of 2,936 contracts from the previous week which had a total of 48,005 net contracts.
This week’s current strength score (the trader positioning range over the past three years, measured from 0 to 100) shows the speculators are currently Bearish with a score of 47.7 percent. The commercials are Bullish with a score of 51.2 percent and the small traders (not shown in chart) are Bearish with a score of 49.8 percent.
Price Trend-Following Model: Weak Uptrend
Our weekly trend-following model classifies the current market price position as: Weak Uptrend. The current action for the model is considered to be: Hold – Maintain Long Position.
| SOYBEAN OIL Futures Statistics | SPECULATORS | COMMERCIALS | SMALL TRADERS |
| – Percent of Open Interest Longs: | 23.2 | 46.9 | 7.4 |
| – Percent of Open Interest Shorts: | 11.0 | 61.4 | 5.0 |
| – Net Position: | 50,941 | -60,657 | 9,716 |
| – Gross Longs: | 96,922 | 195,665 | 30,768 |
| – Gross Shorts: | 45,981 | 256,322 | 21,052 |
| – Long to Short Ratio: | 2.1 to 1 | 0.8 to 1 | 1.5 to 1 |
| NET POSITION TREND: | |||
| – Strength Index Score (3 Year Range Pct): | 47.7 | 51.2 | 49.8 |
| – Strength Index Reading (3 Year Range): | Bearish | Bullish | Bearish |
| NET POSITION MOVEMENT INDEX: | |||
| – 6-Week Change in Strength Index: | -0.4 | 0.7 | -2.4 |
SOYBEAN MEAL Futures:
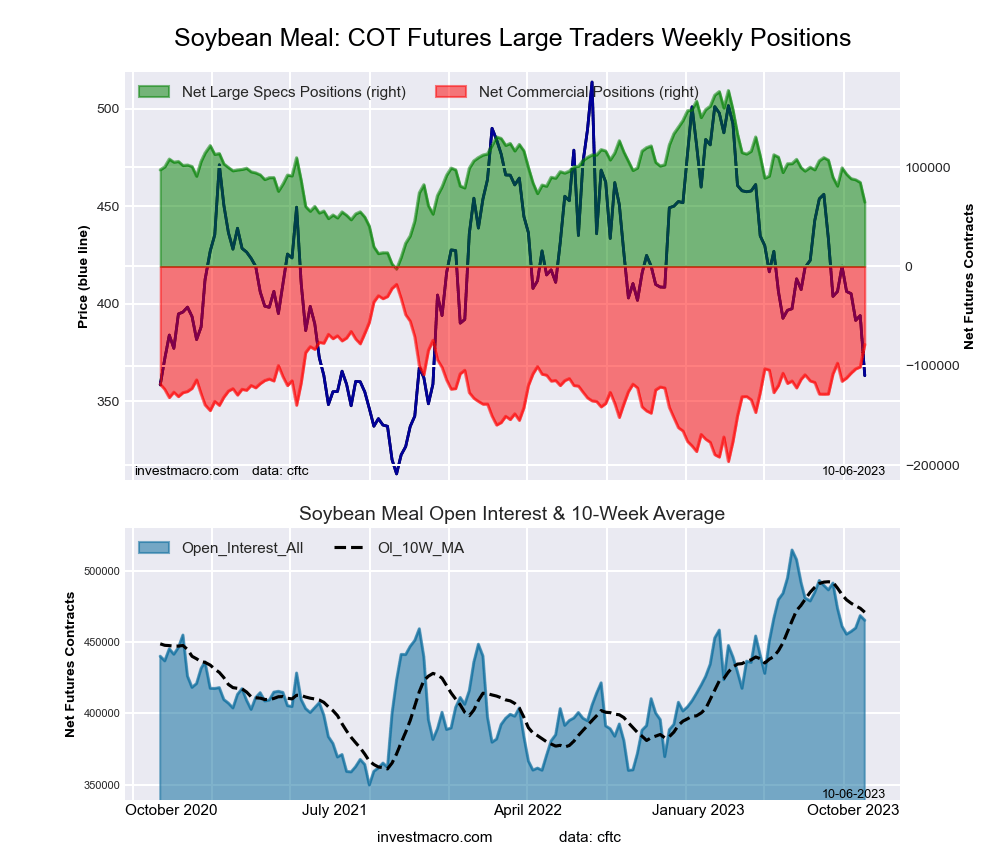 The SOYBEAN MEAL large speculator standing this week reached a net position of 64,775 contracts in the data reported through Tuesday. This was a weekly lowering of -19,769 contracts from the previous week which had a total of 84,544 net contracts.
This week’s current strength score (the trader positioning range over the past three years, measured from 0 to 100) shows the speculators are currently Bearish with a score of 37.5 percent. The commercials are Bullish with a score of 66.0 percent and the small traders (not shown in chart) are Bearish-Extreme with a score of 17.6 percent.
Price Trend-Following Model: Strong Downtrend
Our weekly trend-following model classifies the current market price position as: Strong Downtrend. The current action for the model is considered to be: Hold – Maintain Short Position.
| SOYBEAN MEAL Futures Statistics | SPECULATORS | COMMERCIALS | SMALL TRADERS |
| – Percent of Open Interest Longs: | 22.4 | 43.6 | 8.9 |
| – Percent of Open Interest Shorts: | 8.5 | 60.5 | 5.9 |
| – Net Position: | 64,775 | -78,589 | 13,814 |
| – Gross Longs: | 104,312 | 203,000 | 41,307 |
| – Gross Shorts: | 39,537 | 281,589 | 27,493 |
| – Long to Short Ratio: | 2.6 to 1 | 0.7 to 1 | 1.5 to 1 |
| NET POSITION TREND: | |||
| – Strength Index Score (3 Year Range Pct): | 37.5 | 66.0 | 17.6 |
| – Strength Index Reading (3 Year Range): | Bearish | Bullish | Bearish-Extreme |
| NET POSITION MOVEMENT INDEX: | |||
| – 6-Week Change in Strength Index: | -9.0 | 10.5 | -11.9 |
LIVE CATTLE Futures:
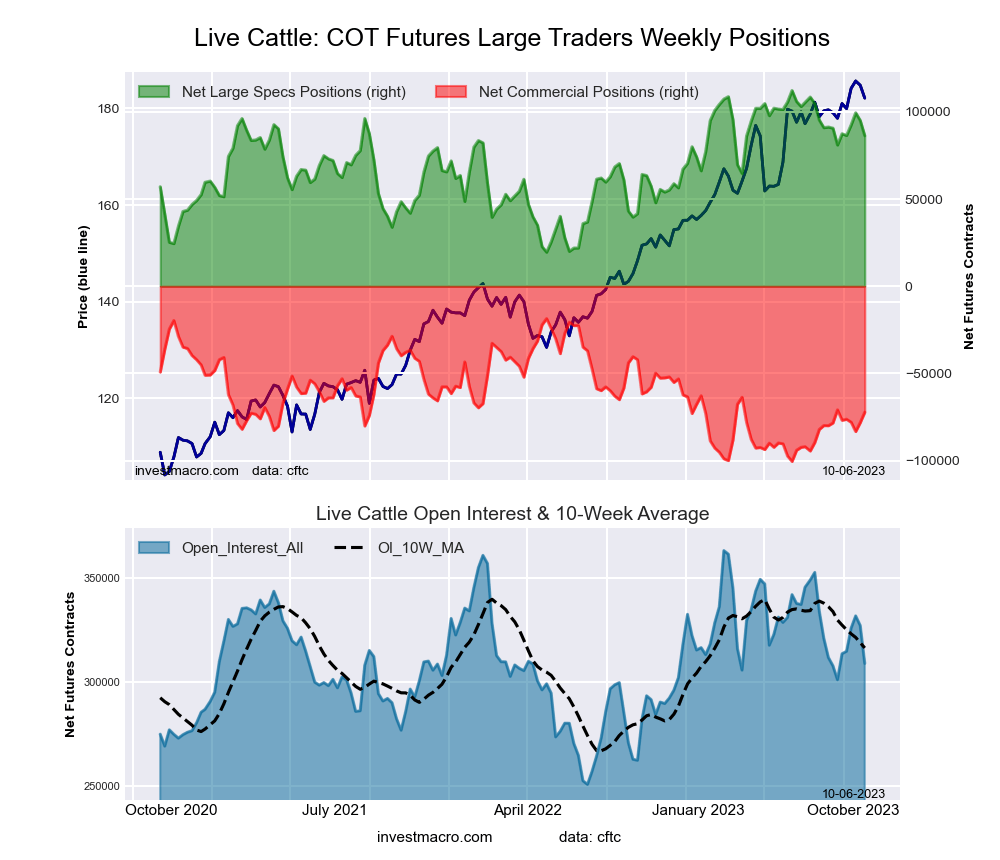 The LIVE CATTLE large speculator standing this week reached a net position of 86,338 contracts in the data reported through Tuesday. This was a weekly reduction of -8,766 contracts from the previous week which had a total of 95,104 net contracts.
This week’s current strength score (the trader positioning range over the past three years, measured from 0 to 100) shows the speculators are currently Bullish with a score of 72.1 percent. The commercials are Bearish with a score of 34.5 percent and the small traders (not shown in chart) are Bearish-Extreme with a score of 14.6 percent.
Price Trend-Following Model: Uptrend
Our weekly trend-following model classifies the current market price position as: Uptrend. The current action for the model is considered to be: Hold – Maintain Long Position.
| LIVE CATTLE Futures Statistics | SPECULATORS | COMMERCIALS | SMALL TRADERS |
| – Percent of Open Interest Longs: | 44.8 | 30.4 | 8.4 |
| – Percent of Open Interest Shorts: | 16.9 | 53.7 | 12.9 |
| – Net Position: | 86,338 | -72,244 | -14,094 |
| – Gross Longs: | 138,419 | 93,825 | 25,803 |
| – Gross Shorts: | 52,081 | 166,069 | 39,897 |
| – Long to Short Ratio: | 2.7 to 1 | 0.6 to 1 | 0.6 to 1 |
| NET POSITION TREND: | |||
| – Strength Index Score (3 Year Range Pct): | 72.1 | 34.5 | 14.6 |
| – Strength Index Reading (3 Year Range): | Bullish | Bearish | Bearish-Extreme |
| NET POSITION MOVEMENT INDEX: | |||
| – 6-Week Change in Strength Index: | 5.7 | -1.6 | -21.2 |
LEAN HOGS Futures:
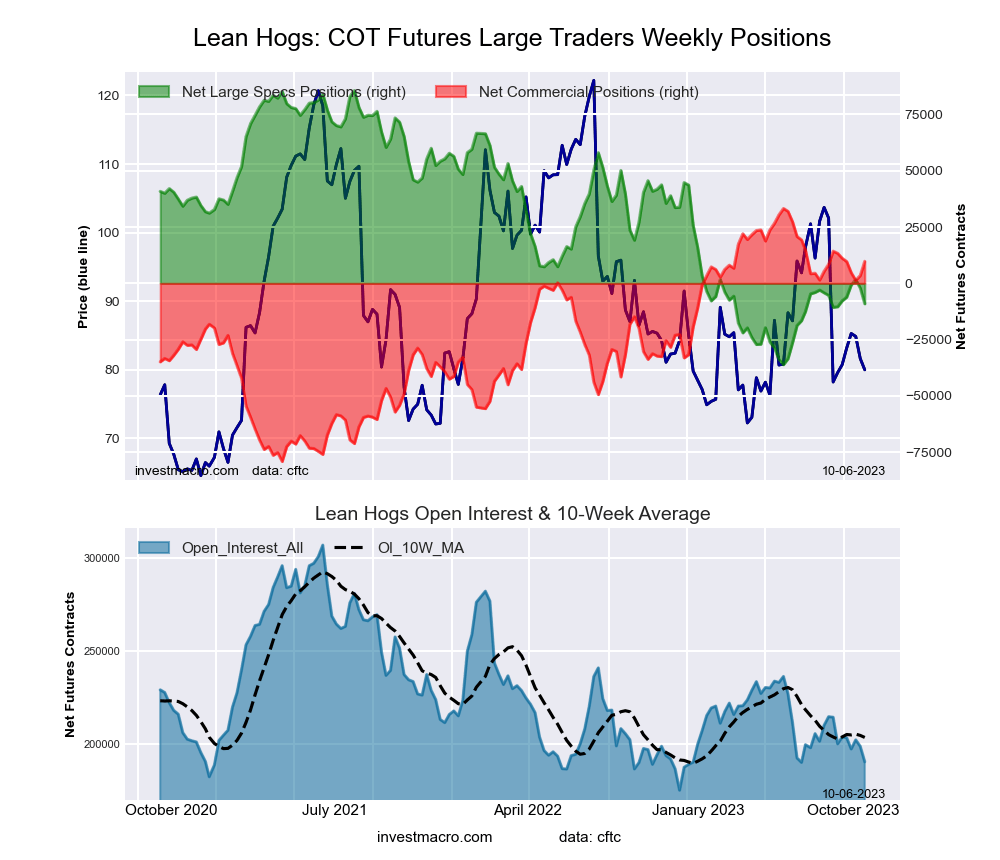 The LEAN HOGS large speculator standing this week reached a net position of -9,091 contracts in the data reported through Tuesday. This was a weekly fall of -6,998 contracts from the previous week which had a total of -2,093 net contracts.
This week’s current strength score (the trader positioning range over the past three years, measured from 0 to 100) shows the speculators are currently Bearish with a score of 22.2 percent. The commercials are Bullish with a score of 79.1 percent and the small traders (not shown in chart) are Bullish-Extreme with a score of 80.4 percent.
Price Trend-Following Model: Strong Downtrend
Our weekly trend-following model classifies the current market price position as: Strong Downtrend. The current action for the model is considered to be: Hold – Maintain Short Position.
| LEAN HOGS Futures Statistics | SPECULATORS | COMMERCIALS | SMALL TRADERS |
| – Percent of Open Interest Longs: | 29.2 | 37.8 | 10.5 |
| – Percent of Open Interest Shorts: | 34.0 | 32.7 | 10.8 |
| – Net Position: | -9,091 | 9,750 | -659 |
| – Gross Longs: | 55,656 | 72,012 | 19,895 |
| – Gross Shorts: | 64,747 | 62,262 | 20,554 |
| – Long to Short Ratio: | 0.9 to 1 | 1.2 to 1 | 1.0 to 1 |
| NET POSITION TREND: | |||
| – Strength Index Score (3 Year Range Pct): | 22.2 | 79.1 | 80.4 |
| – Strength Index Reading (3 Year Range): | Bearish | Bullish | Bullish-Extreme |
| NET POSITION MOVEMENT INDEX: | |||
| – 6-Week Change in Strength Index: | 1.1 | -3.2 | 10.1 |
COTTON Futures:
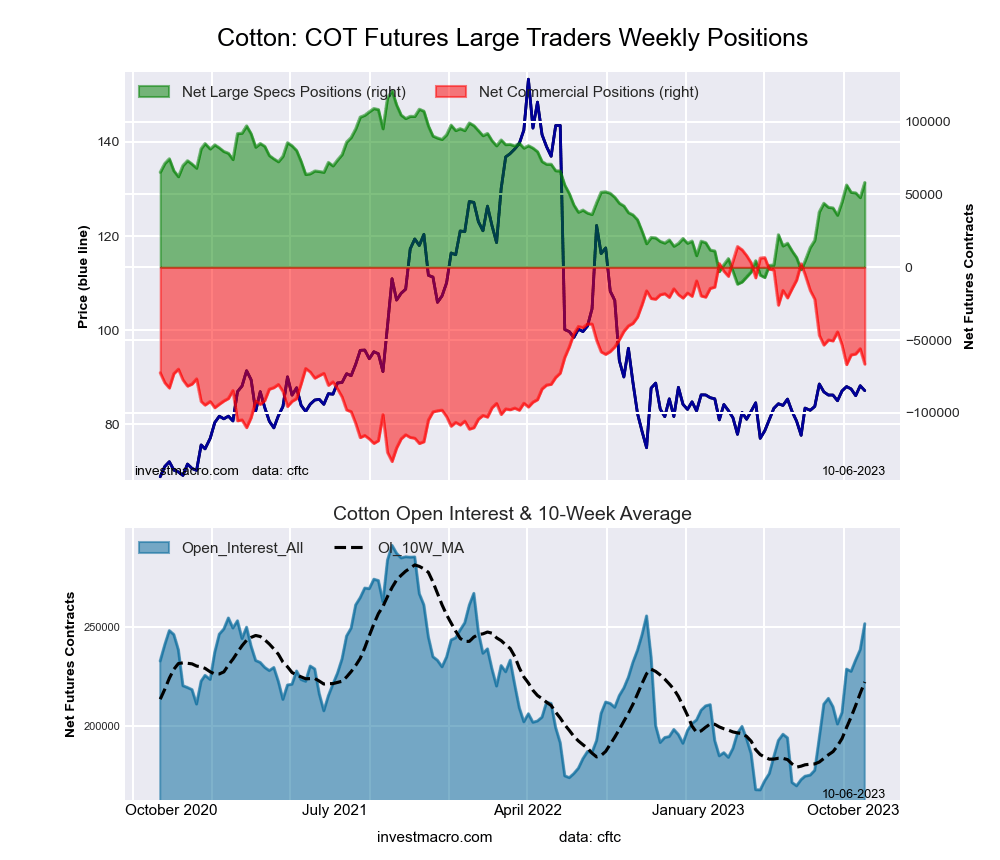 The COTTON large speculator standing this week reached a net position of 58,162 contracts in the data reported through Tuesday. This was a weekly gain of 10,382 contracts from the previous week which had a total of 47,780 net contracts.
This week’s current strength score (the trader positioning range over the past three years, measured from 0 to 100) shows the speculators are currently Bullish with a score of 52.5 percent. The commercials are Bearish with a score of 45.3 percent and the small traders (not shown in chart) are Bullish with a score of 66.4 percent.
Price Trend-Following Model: Uptrend
Our weekly trend-following model classifies the current market price position as: Uptrend. The current action for the model is considered to be: Hold – Maintain Long Position.
| COTTON Futures Statistics | SPECULATORS | COMMERCIALS | SMALL TRADERS |
| – Percent of Open Interest Longs: | 35.2 | 42.6 | 6.5 |
| – Percent of Open Interest Shorts: | 12.0 | 69.0 | 3.2 |
| – Net Position: | 58,162 | -66,471 | 8,309 |
| – Gross Longs: | 88,465 | 107,180 | 16,235 |
| – Gross Shorts: | 30,303 | 173,651 | 7,926 |
| – Long to Short Ratio: | 2.9 to 1 | 0.6 to 1 | 2.0 to 1 |
| NET POSITION TREND: | |||
| – Strength Index Score (3 Year Range Pct): | 52.5 | 45.3 | 66.4 |
| – Strength Index Reading (3 Year Range): | Bullish | Bearish | Bullish |
| NET POSITION MOVEMENT INDEX: | |||
| – 6-Week Change in Strength Index: | 16.9 | -15.0 | -2.4 |
COCOA Futures:
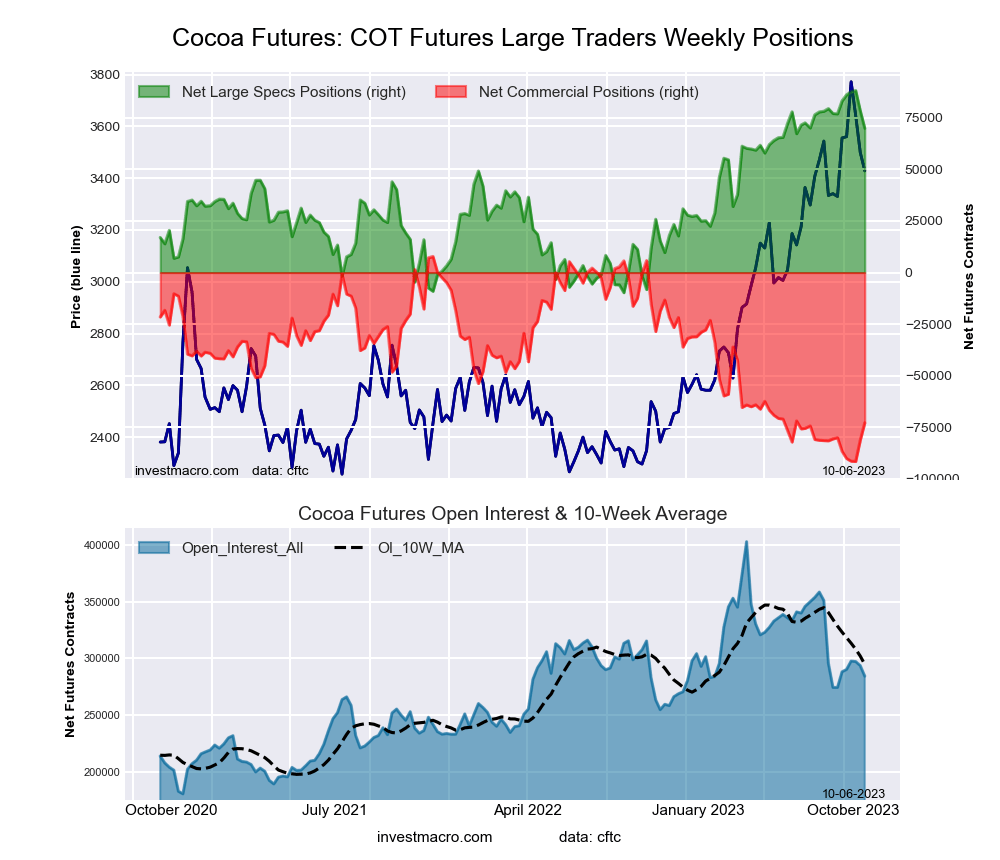 The COCOA large speculator standing this week reached a net position of 69,933 contracts in the data reported through Tuesday. This was a weekly decrease of -8,605 contracts from the previous week which had a total of 78,538 net contracts.
This week’s current strength score (the trader positioning range over the past three years, measured from 0 to 100) shows the speculators are currently Bullish-Extreme with a score of 81.3 percent. The commercials are Bearish-Extreme with a score of 18.9 percent and the small traders (not shown in chart) are Bearish with a score of 25.8 percent.
Price Trend-Following Model: Uptrend
Our weekly trend-following model classifies the current market price position as: Uptrend. The current action for the model is considered to be: Hold – Maintain Long Position.
| COCOA Futures Statistics | SPECULATORS | COMMERCIALS | SMALL TRADERS |
| – Percent of Open Interest Longs: | 41.3 | 29.7 | 4.5 |
| – Percent of Open Interest Shorts: | 16.7 | 55.4 | 3.5 |
| – Net Position: | 69,933 | -72,861 | 2,928 |
| – Gross Longs: | 117,419 | 84,488 | 12,822 |
| – Gross Shorts: | 47,486 | 157,349 | 9,894 |
| – Long to Short Ratio: | 2.5 to 1 | 0.5 to 1 | 1.3 to 1 |
| NET POSITION TREND: | |||
| – Strength Index Score (3 Year Range Pct): | 81.3 | 18.9 | 25.8 |
| – Strength Index Reading (3 Year Range): | Bullish-Extreme | Bearish-Extreme | Bearish |
| NET POSITION MOVEMENT INDEX: | |||
| – 6-Week Change in Strength Index: | -7.2 | 7.3 | -2.0 |
WHEAT Futures:
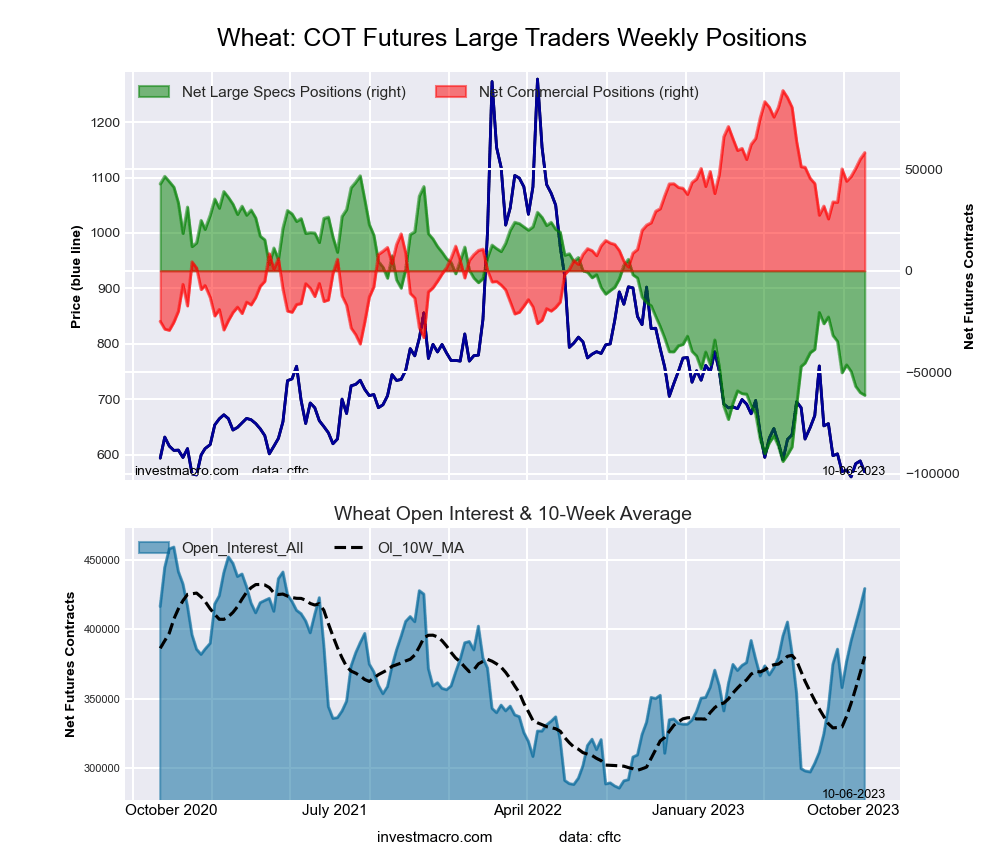 The WHEAT large speculator standing this week reached a net position of -61,347 contracts in the data reported through Tuesday. This was a weekly decline of -1,333 contracts from the previous week which had a total of -60,014 net contracts.
This week’s current strength score (the trader positioning range over the past three years, measured from 0 to 100) shows the speculators are currently Bearish with a score of 23.2 percent. The commercials are Bullish with a score of 75.5 percent and the small traders (not shown in chart) are Bullish-Extreme with a score of 81.6 percent.
Price Trend-Following Model: Strong Downtrend
Our weekly trend-following model classifies the current market price position as: Strong Downtrend. The current action for the model is considered to be: Hold – Maintain Short Position.
| WHEAT Futures Statistics | SPECULATORS | COMMERCIALS | SMALL TRADERS |
| – Percent of Open Interest Longs: | 28.6 | 33.8 | 9.0 |
| – Percent of Open Interest Shorts: | 42.9 | 20.2 | 8.3 |
| – Net Position: | -61,347 | 58,242 | 3,105 |
| – Gross Longs: | 122,733 | 144,907 | 38,732 |
| – Gross Shorts: | 184,080 | 86,665 | 35,627 |
| – Long to Short Ratio: | 0.7 to 1 | 1.7 to 1 | 1.1 to 1 |
| NET POSITION TREND: | |||
| – Strength Index Score (3 Year Range Pct): | 23.2 | 75.5 | 81.6 |
| – Strength Index Reading (3 Year Range): | Bearish | Bullish | Bullish-Extreme |
| NET POSITION MOVEMENT INDEX: | |||
| – 6-Week Change in Strength Index: | -18.9 | 19.6 | 8.1 |
Article By InvestMacro – Receive our weekly COT Newsletter
*COT Report: The COT data, released weekly to the public each Friday, is updated through the most recent Tuesday (data is 3 days old) and shows a quick view of how large speculators or non-commercials (for-profit traders) were positioned in the futures markets.
The CFTC categorizes trader positions according to commercial hedgers (traders who use futures contracts for hedging as part of the business), non-commercials (large traders who speculate to realize trading profits) and nonreportable traders (usually small traders/speculators) as well as their open interest (contracts open in the market at time of reporting). See CFTC criteria here.


.png)
.png)

