By InvestMacro
Here are the latest charts and statistics for the Commitment of Traders (COT) data published by the Commodities Futures Trading Commission (CFTC).
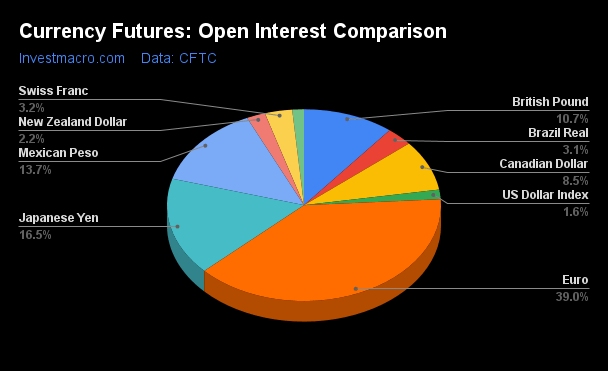
The latest COT data is updated through Tuesday February 20th and shows a quick view of how large market participants (for-profit speculators and commercial traders) were positioned in the futures markets. All currency positions are in direct relation to the US dollar where, for example, a bet for the euro is a bet that the euro will rise versus the dollar while a bet against the euro will be a bet that the euro will decline versus the dollar.
Weekly Speculator Changes led by Euro, Canadian Dollar & New Zealand Dollar
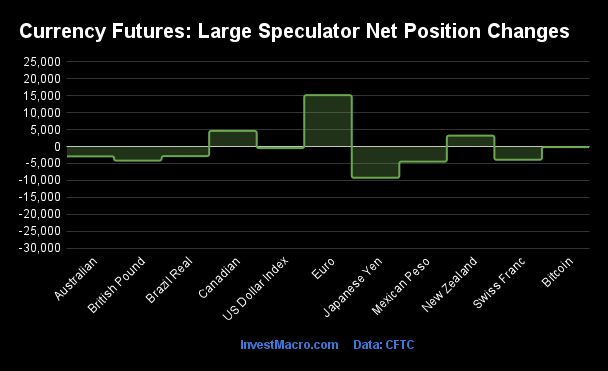
The COT currency market speculator bets were overall lower this week as three out of the eleven currency markets we cover had higher positioning while the other eight markets had lower speculator contracts.
Leading the gains for the currency markets was the EuroFX (15,178 contracts) with the Canadian Dollar (4,619 contracts) and the New Zealand Dollar (3,219 contracts) also having positive weeks.
The currencies seeing declines in speculator bets on the week were the Japanese Yen (-9,242 contracts), the Mexican Peso (-4,449 contracts), the British Pound (-4,160 contracts), the Swiss Franc (-3,909 contracts), the Australian Dollar (-2,899 contracts), the Brazilian Real (-2,826 contracts), the US Dollar Index (-456 contracts) and Bitcoin (-177 contracts) also seeing lower bets on the week.
Speculators push New Zealand Dollar bets to highest in just about a year
Highlighting the COT currency’s data this week is the recent increase in the speculator’s positioning for the New Zealand Dollar. The large speculative New Zealand Dollar (NZD) currency positions gained this week by over +3,000 net contracts and have now climbed for six consecutive weeks. The NZD bets have also risen in nine out of the past twelve weeks, going from a total net position of -16,450 contracts on December 5th to a total of +6,626 contracts this week.
This improvement has taken the NZD to it’s most bullish level in the past fifty-one weeks, dating back to February 28th of 2023.
Helping the NZD speculator sentiment is the possibility that the Reserve Bank of New Zealand (RBNZ) may increase the bank’s interest rate at the next policy meeting. The RBNZ is on schedule to hold its next meeting on February 27th with the official cash rate residing at 5.5 percent. Investment services such as ANZ Bank and TD Bank are anticipating the RBNZ to increase the cash rate by 25 basis points because of high inflation. The New Zealand consumer price index (most recently at 4.7 percent for December) continues to be higher than the bank’s target range of between 1-3 percent annually. However, weak economic growth that unexpectedly contracted by -0.60 percent (annual) in the third quarter of 2023 may help to persuade the RBNZ to hold the rate steady.
The NZD exchange rate versus the US Dollar has been on the rise recently with a weekly close just below 0.6200 level. The NZDUSD hit a multi-year low of 0.5558 in October of 2022 and more recently hit a low of 0.5809 in October of 2023. Since then, the currency pair has been able to rise and break through the 0.6000 major resistance and bounce off the 200-day moving average. The currency has ridden an eight-day win-streak to rise into this week’s close near 0.6200.
Currencies Net Speculators Leaderboard
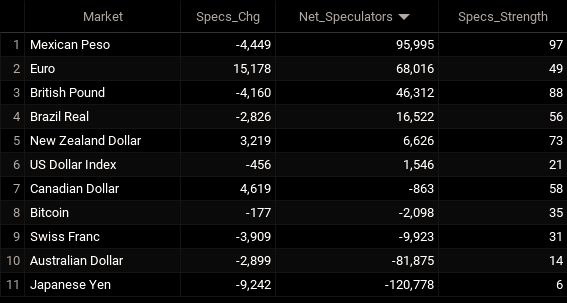
Legend: Weekly Speculators Change | Speculators Current Net Position | Speculators Strength Score compared to last 3-Years (0-100 range)
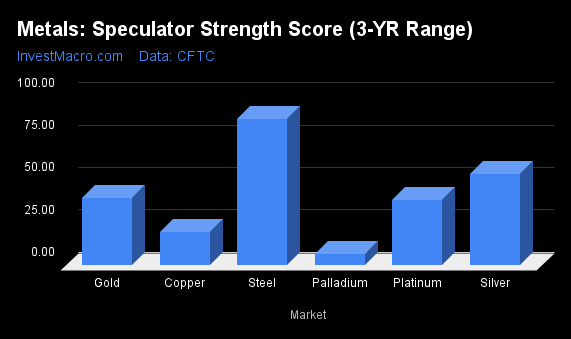
Strength Scores led by Mexican Peso & British Pound
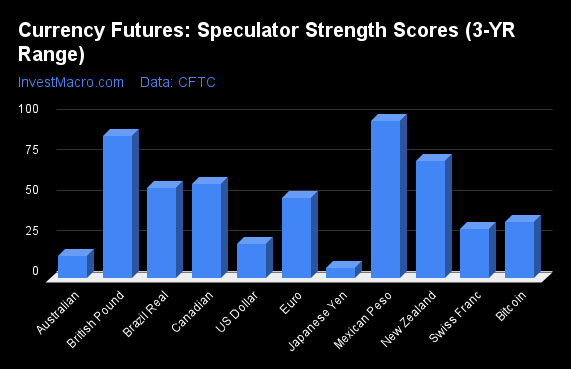
COT Strength Scores (a normalized measure of Speculator positions over a 3-Year range, from 0 to 100 where above 80 is Extreme-Bullish and below 20 is Extreme-Bearish) showed that the Mexican Peso (97 percent) and the British Pound (88 percent) lead the currency markets this week. The New Zealand Dollar (73 percent), Canadian Dollar (58 percent) and the Brazilian Real (56 percent) come in as the next highest in the weekly strength scores.
On the downside, the Japanese Yen (6 percent) and the Australian Dollar (14 percent) come in at the lowest strength levels currently and are in Extreme-Bearish territory (below 20 percent). The next lowest strength scores are the US Dollar Index (21 percent) and the Swiss Franc (31 percent).
Strength Statistics:
US Dollar Index (21.1 percent) vs US Dollar Index previous week (22.0 percent)
EuroFX (49.3 percent) vs EuroFX previous week (42.8 percent)
British Pound Sterling (87.9 percent) vs British Pound Sterling previous week (90.8 percent)
Japanese Yen (6.3 percent) vs Japanese Yen previous week (12.5 percent)
Swiss Franc (30.6 percent) vs Swiss Franc previous week (41.8 percent)
Canadian Dollar (58.4 percent) vs Canadian Dollar previous week (54.5 percent)
Australian Dollar (13.8 percent) vs Australian Dollar previous week (16.5 percent)
New Zealand Dollar (72.7 percent) vs New Zealand Dollar previous week (64.3 percent)
Mexican Peso (97.3 percent) vs Mexican Peso previous week (100.0 percent)
Brazilian Real (55.9 percent) vs Brazilian Real previous week (59.6 percent)
Bitcoin (34.8 percent) vs Bitcoin previous week (37.5 percent)
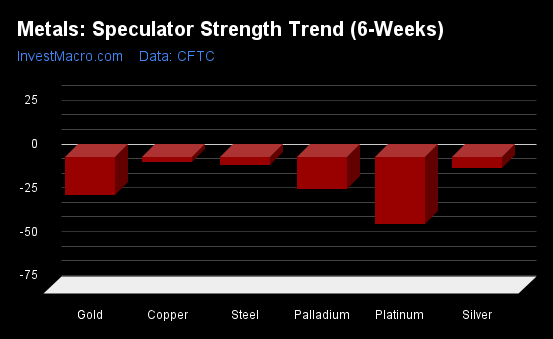
New Zealand Dollar & British Pound top the 6-Week Strength Trends
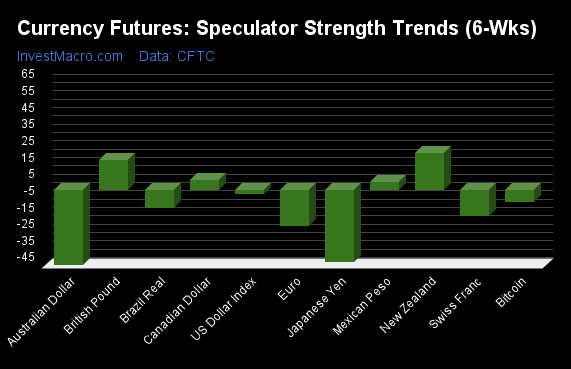
COT Strength Score Trends (or move index, calculates the 6-week changes in strength scores) showed that the New Zealand Dollar (22 percent) and the British Pound (18 percent) lead the past six weeks trends for the currencies. The Canadian Dollar (5 percent) and the Mexican Peso (5 percent) are the next highest positive movers in the latest trends data.
The Australian Dollar (-45 percent) leads the downside trend scores currently with the Japanese Yen (-43 percent), the EuroFX (-22 percent) and the Swiss Franc (-16 percent) following next with lower trend scores.
Strength Trend Statistics:
US Dollar Index (-2.5 percent) vs US Dollar Index previous week (-0.8 percent)
EuroFX (-21.7 percent) vs EuroFX previous week (-28.4 percent)
British Pound Sterling (17.8 percent) vs British Pound Sterling previous week (24.5 percent)
Japanese Yen (-43.4 percent) vs Japanese Yen previous week (-36.3 percent)
Swiss Franc (-15.8 percent) vs Swiss Franc previous week (-2.3 percent)
Canadian Dollar (5.5 percent) vs Canadian Dollar previous week (13.1 percent)
Australian Dollar (-45.4 percent) vs Australian Dollar previous week (-33.0 percent)
New Zealand Dollar (21.9 percent) vs New Zealand Dollar previous week (10.3 percent)
Mexican Peso (4.6 percent) vs Mexican Peso previous week (6.9 percent)
Brazilian Real (-11.1 percent) vs Brazilian Real previous week (-19.4 percent)
Bitcoin (-7.2 percent) vs Bitcoin previous week (4.5 percent)
Individual COT Forex Markets:
US Dollar Index Futures:
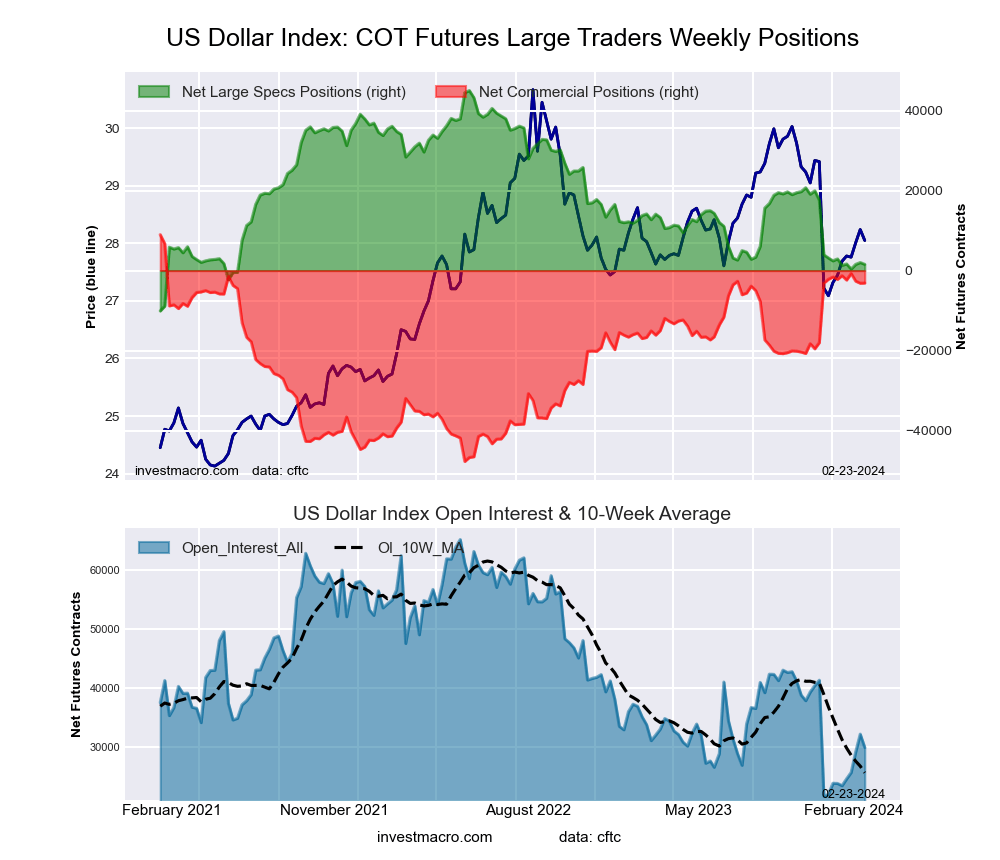 The US Dollar Index large speculator standing this week totaled a net position of 1,546 contracts in the data reported through Tuesday. This was a weekly decrease of -456 contracts from the previous week which had a total of 2,002 net contracts.
This week’s current strength score (the trader positioning range over the past three years, measured from 0 to 100) shows the speculators are currently Bearish with a score of 21.1 percent. The commercials are Bullish with a score of 78.6 percent and the small traders (not shown in chart) are Bearish with a score of 29.6 percent.
Price Trend-Following Model: Downtrend
Our weekly trend-following model classifies the current market price position as: Downtrend. The current action for the model is considered to be: Hold – Maintain Short Position.
| US DOLLAR INDEX Statistics | SPECULATORS | COMMERCIALS | SMALL TRADERS |
| – Percent of Open Interest Longs: | 62.5 | 18.8 | 13.1 |
| – Percent of Open Interest Shorts: | 57.4 | 29.2 | 7.8 |
| – Net Position: | 1,546 | -3,126 | 1,580 |
| – Gross Longs: | 18,732 | 5,625 | 3,916 |
| – Gross Shorts: | 17,186 | 8,751 | 2,336 |
| – Long to Short Ratio: | 1.1 to 1 | 0.6 to 1 | 1.7 to 1 |
| NET POSITION TREND: | | | |
| – Strength Index Score (3 Year Range Pct): | 21.1 | 78.6 | 29.6 |
| – Strength Index Reading (3 Year Range): | Bearish | Bullish | Bearish |
| NET POSITION MOVEMENT INDEX: | | | |
| – 6-Week Change in Strength Index: | -2.5 | -1.6 | 26.5 |
Euro Currency Futures:
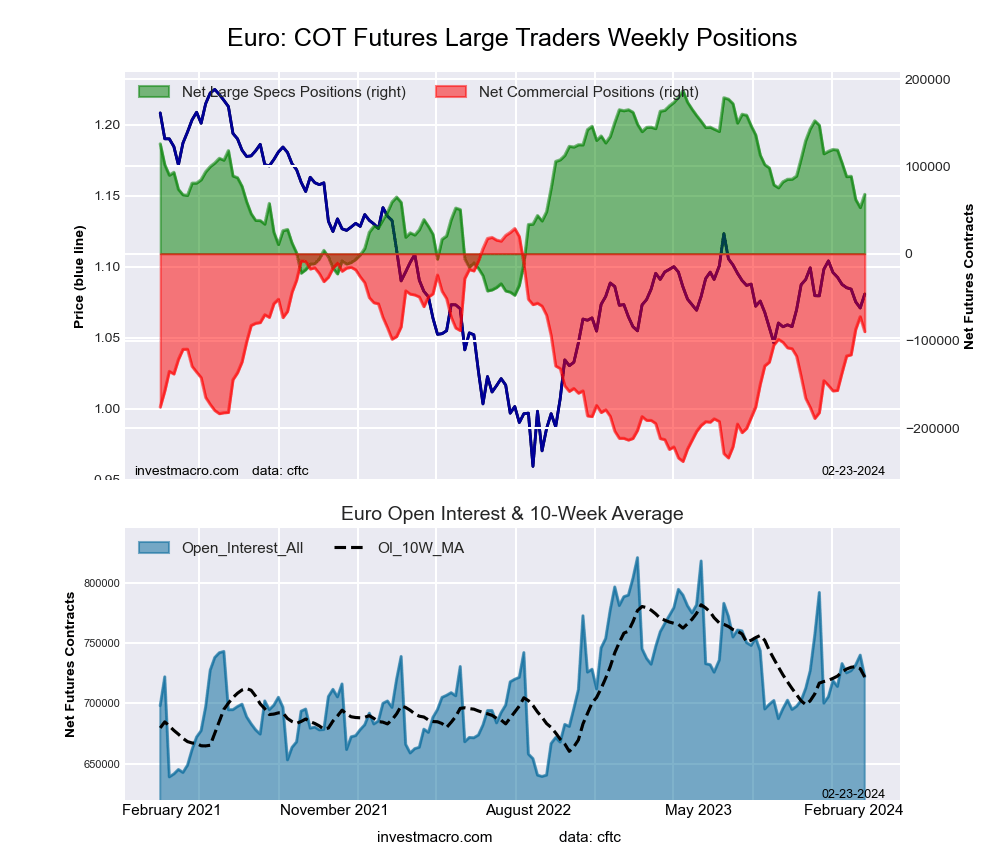 The Euro Currency large speculator standing this week totaled a net position of 68,016 contracts in the data reported through Tuesday. This was a weekly rise of 15,178 contracts from the previous week which had a total of 52,838 net contracts.
This week’s current strength score (the trader positioning range over the past three years, measured from 0 to 100) shows the speculators are currently Bearish with a score of 49.3 percent. The commercials are Bullish with a score of 55.7 percent and the small traders (not shown in chart) are Bearish-Extreme with a score of 13.2 percent.
Price Trend-Following Model: Uptrend
Our weekly trend-following model classifies the current market price position as: Uptrend. The current action for the model is considered to be: Hold – Maintain Long Position.
| EURO Currency Statistics | SPECULATORS | COMMERCIALS | SMALL TRADERS |
| – Percent of Open Interest Longs: | 29.5 | 57.6 | 10.8 |
| – Percent of Open Interest Shorts: | 20.1 | 70.0 | 7.8 |
| – Net Position: | 68,016 | -89,451 | 21,435 |
| – Gross Longs: | 213,194 | 416,183 | 77,957 |
| – Gross Shorts: | 145,178 | 505,634 | 56,522 |
| – Long to Short Ratio: | 1.5 to 1 | 0.8 to 1 | 1.4 to 1 |
| NET POSITION TREND: | | | |
| – Strength Index Score (3 Year Range Pct): | 49.3 | 55.7 | 13.2 |
| – Strength Index Reading (3 Year Range): | Bearish | Bullish | Bearish-Extreme |
| NET POSITION MOVEMENT INDEX: | | | |
| – 6-Week Change in Strength Index: | -21.7 | 25.2 | -26.4 |
British Pound Sterling Futures:
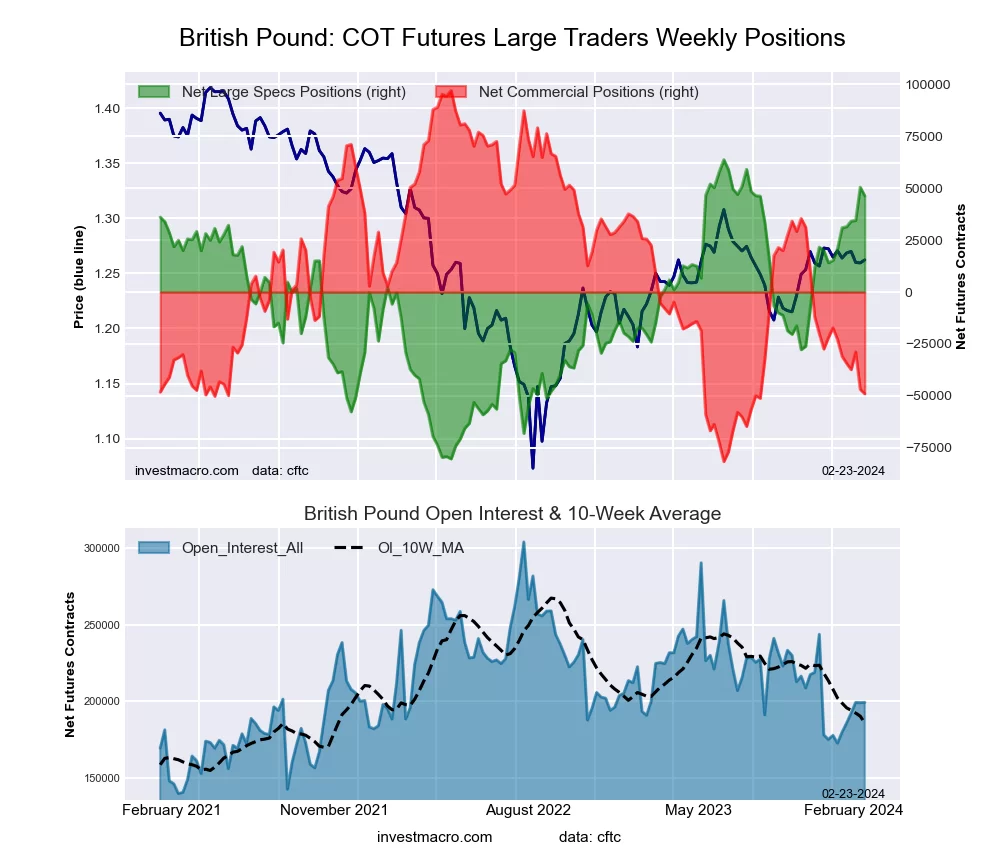 The British Pound Sterling large speculator standing this week totaled a net position of 46,312 contracts in the data reported through Tuesday. This was a weekly reduction of -4,160 contracts from the previous week which had a total of 50,472 net contracts.
This week’s current strength score (the trader positioning range over the past three years, measured from 0 to 100) shows the speculators are currently Bullish-Extreme with a score of 87.9 percent. The commercials are Bearish-Extreme with a score of 18.2 percent and the small traders (not shown in chart) are Bullish with a score of 63.3 percent.
Price Trend-Following Model: Uptrend
Our weekly trend-following model classifies the current market price position as: Uptrend. The current action for the model is considered to be: Hold – Maintain Long Position.
| BRITISH POUND Statistics | SPECULATORS | COMMERCIALS | SMALL TRADERS |
| – Percent of Open Interest Longs: | 44.0 | 36.6 | 15.1 |
| – Percent of Open Interest Shorts: | 20.7 | 61.2 | 13.7 |
| – Net Position: | 46,312 | -49,006 | 2,694 |
| – Gross Longs: | 87,602 | 72,901 | 30,014 |
| – Gross Shorts: | 41,290 | 121,907 | 27,320 |
| – Long to Short Ratio: | 2.1 to 1 | 0.6 to 1 | 1.1 to 1 |
| NET POSITION TREND: | | | |
| – Strength Index Score (3 Year Range Pct): | 87.9 | 18.2 | 63.3 |
| – Strength Index Reading (3 Year Range): | Bullish-Extreme | Bearish-Extreme | Bullish |
| NET POSITION MOVEMENT INDEX: | | | |
| – 6-Week Change in Strength Index: | 17.8 | -14.6 | 1.1 |
Japanese Yen Futures:
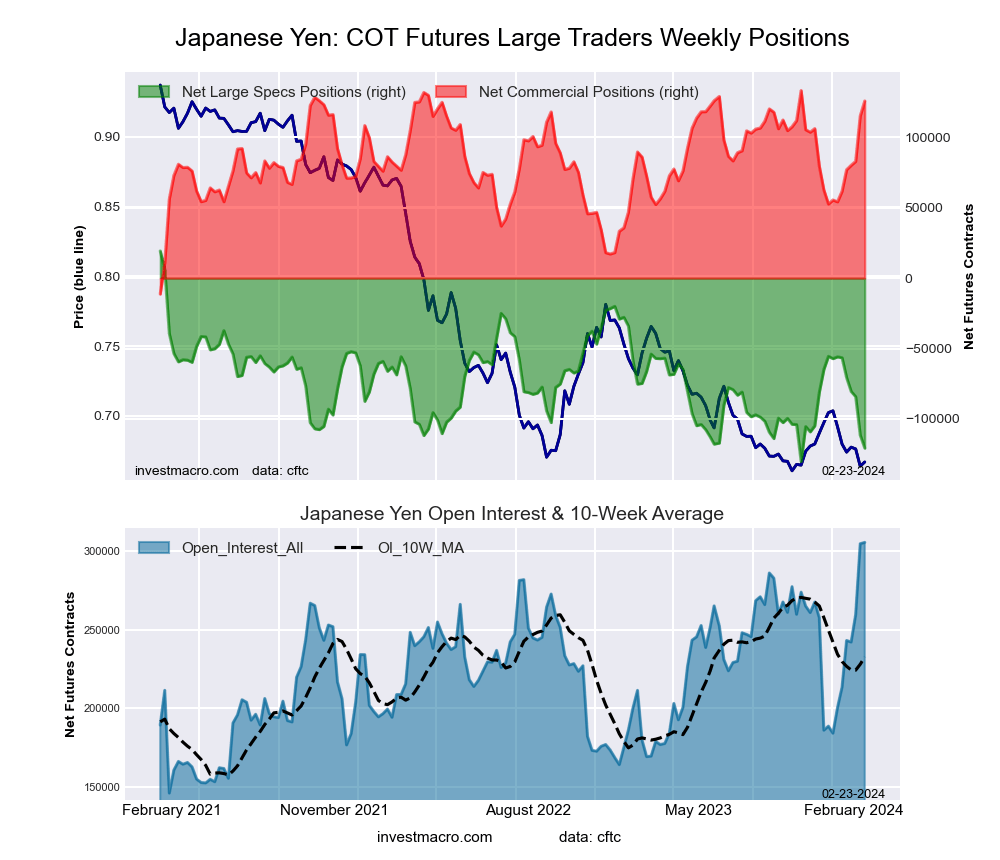 The Japanese Yen large speculator standing this week totaled a net position of -120,778 contracts in the data reported through Tuesday. This was a weekly decrease of -9,242 contracts from the previous week which had a total of -111,536 net contracts.
This week’s current strength score (the trader positioning range over the past three years, measured from 0 to 100) shows the speculators are currently Bearish-Extreme with a score of 6.3 percent. The commercials are Bullish-Extreme with a score of 94.9 percent and the small traders (not shown in chart) are Bullish with a score of 66.7 percent.
Price Trend-Following Model: Weak Uptrend
Our weekly trend-following model classifies the current market price position as: Weak Uptrend. The current action for the model is considered to be: Hold – Maintain Long Position.
| JAPANESE YEN Statistics | SPECULATORS | COMMERCIALS | SMALL TRADERS |
| – Percent of Open Interest Longs: | 17.6 | 65.2 | 13.6 |
| – Percent of Open Interest Shorts: | 57.2 | 24.0 | 15.3 |
| – Net Position: | -120,778 | 125,854 | -5,076 |
| – Gross Longs: | 53,862 | 199,061 | 41,618 |
| – Gross Shorts: | 174,640 | 73,207 | 46,694 |
| – Long to Short Ratio: | 0.3 to 1 | 2.7 to 1 | 0.9 to 1 |
| NET POSITION TREND: | | | |
| – Strength Index Score (3 Year Range Pct): | 6.3 | 94.9 | 66.7 |
| – Strength Index Reading (3 Year Range): | Bearish-Extreme | Bullish-Extreme | Bullish |
| NET POSITION MOVEMENT INDEX: | | | |
| – 6-Week Change in Strength Index: | -43.4 | 49.6 | -21.5 |
Swiss Franc Futures:
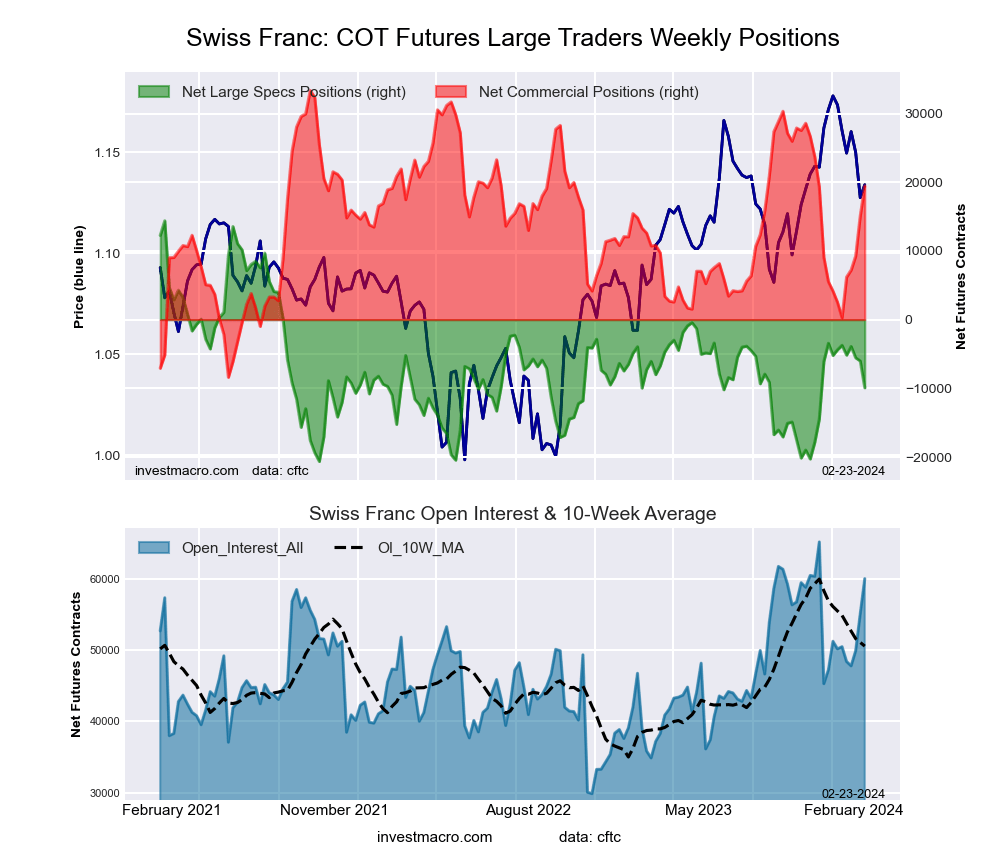 The Swiss Franc large speculator standing this week totaled a net position of -9,923 contracts in the data reported through Tuesday. This was a weekly reduction of -3,909 contracts from the previous week which had a total of -6,014 net contracts.
This week’s current strength score (the trader positioning range over the past three years, measured from 0 to 100) shows the speculators are currently Bearish with a score of 30.6 percent. The commercials are Bullish with a score of 66.8 percent and the small traders (not shown in chart) are Bearish with a score of 33.8 percent.
Price Trend-Following Model: Weak Uptrend
Our weekly trend-following model classifies the current market price position as: Weak Uptrend. The current action for the model is considered to be: Hold – Maintain Long Position.
| SWISS FRANC Statistics | SPECULATORS | COMMERCIALS | SMALL TRADERS |
| – Percent of Open Interest Longs: | 21.7 | 62.4 | 15.7 |
| – Percent of Open Interest Shorts: | 38.2 | 29.9 | 31.6 |
| – Net Position: | -9,923 | 19,476 | -9,553 |
| – Gross Longs: | 13,036 | 37,455 | 9,413 |
| – Gross Shorts: | 22,959 | 17,979 | 18,966 |
| – Long to Short Ratio: | 0.6 to 1 | 2.1 to 1 | 0.5 to 1 |
| NET POSITION TREND: | | | |
| – Strength Index Score (3 Year Range Pct): | 30.6 | 66.8 | 33.8 |
| – Strength Index Reading (3 Year Range): | Bearish | Bullish | Bearish |
| NET POSITION MOVEMENT INDEX: | | | |
| – 6-Week Change in Strength Index: | -15.8 | 40.6 | -51.9 |
Canadian Dollar Futures:
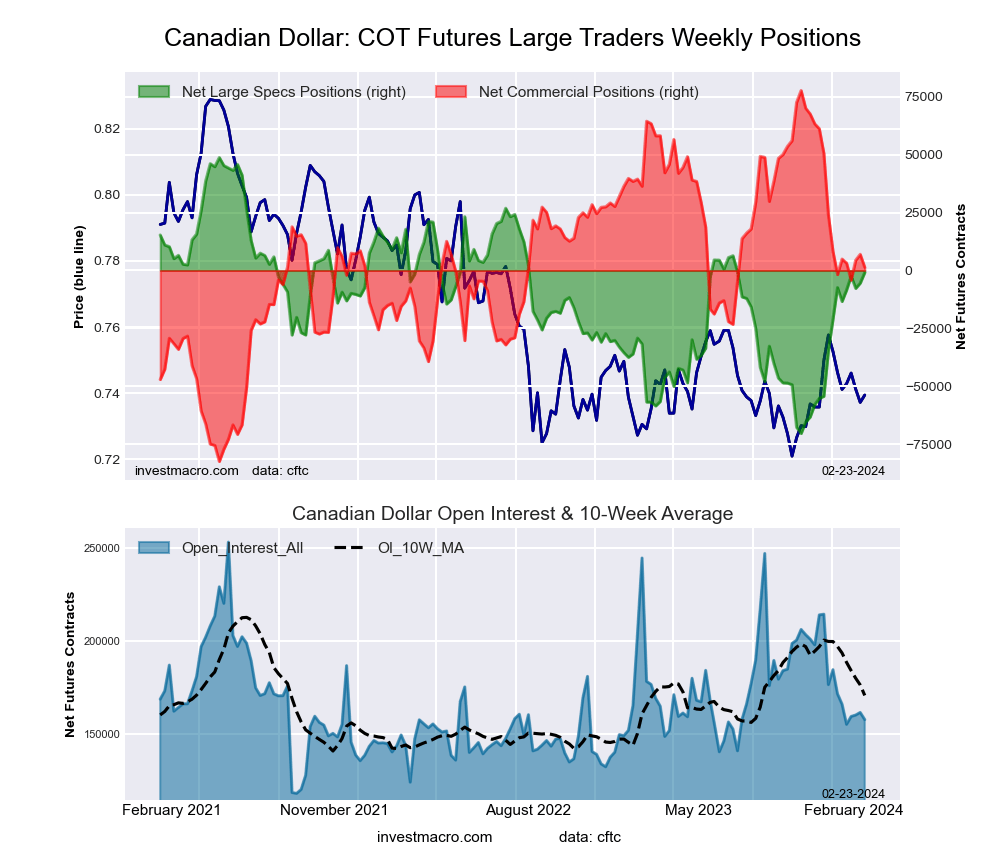 The Canadian Dollar large speculator standing this week totaled a net position of -863 contracts in the data reported through Tuesday. This was a weekly boost of 4,619 contracts from the previous week which had a total of -5,482 net contracts.
This week’s current strength score (the trader positioning range over the past three years, measured from 0 to 100) shows the speculators are currently Bullish with a score of 58.4 percent. The commercials are Bullish with a score of 52.3 percent and the small traders (not shown in chart) are Bearish with a score of 21.7 percent.
Price Trend-Following Model: Uptrend
Our weekly trend-following model classifies the current market price position as: Uptrend. The current action for the model is considered to be: Hold – Maintain Long Position.
| CANADIAN DOLLAR Statistics | SPECULATORS | COMMERCIALS | SMALL TRADERS |
| – Percent of Open Interest Longs: | 23.5 | 55.9 | 18.5 |
| – Percent of Open Interest Shorts: | 24.1 | 55.1 | 18.8 |
| – Net Position: | -863 | 1,345 | -482 |
| – Gross Longs: | 37,108 | 88,205 | 29,192 |
| – Gross Shorts: | 37,971 | 86,860 | 29,674 |
| – Long to Short Ratio: | 1.0 to 1 | 1.0 to 1 | 1.0 to 1 |
| NET POSITION TREND: | | | |
| – Strength Index Score (3 Year Range Pct): | 58.4 | 52.3 | 21.7 |
| – Strength Index Reading (3 Year Range): | Bullish | Bullish | Bearish |
| NET POSITION MOVEMENT INDEX: | | | |
| – 6-Week Change in Strength Index: | 5.5 | 2.0 | -21.4 |
Australian Dollar Futures:
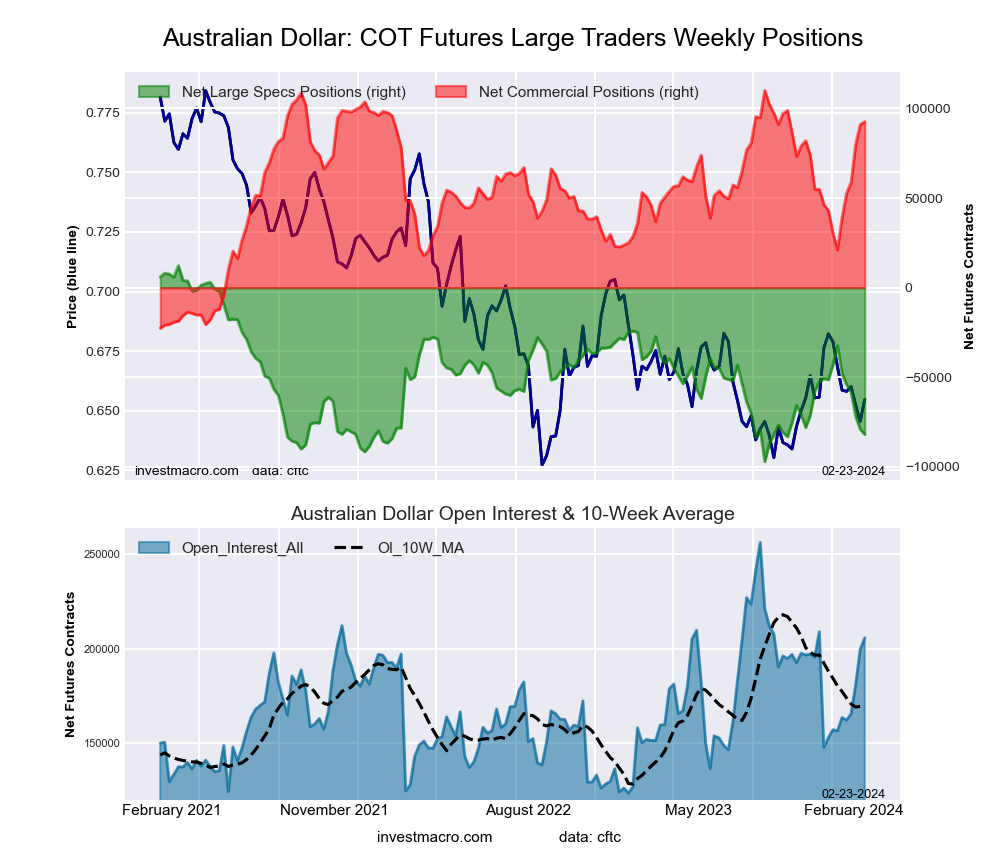 The Australian Dollar large speculator standing this week totaled a net position of -81,875 contracts in the data reported through Tuesday. This was a weekly fall of -2,899 contracts from the previous week which had a total of -78,976 net contracts.
This week’s current strength score (the trader positioning range over the past three years, measured from 0 to 100) shows the speculators are currently Bearish-Extreme with a score of 13.8 percent. The commercials are Bullish-Extreme with a score of 86.9 percent and the small traders (not shown in chart) are Bearish with a score of 27.2 percent.
Price Trend-Following Model: Uptrend
Our weekly trend-following model classifies the current market price position as: Uptrend. The current action for the model is considered to be: Hold – Maintain Long Position.
| AUSTRALIAN DOLLAR Statistics | SPECULATORS | COMMERCIALS | SMALL TRADERS |
| – Percent of Open Interest Longs: | 23.9 | 64.0 | 9.4 |
| – Percent of Open Interest Shorts: | 63.7 | 19.0 | 14.6 |
| – Net Position: | -81,875 | 92,611 | -10,736 |
| – Gross Longs: | 49,100 | 131,694 | 19,375 |
| – Gross Shorts: | 130,975 | 39,083 | 30,111 |
| – Long to Short Ratio: | 0.4 to 1 | 3.4 to 1 | 0.6 to 1 |
| NET POSITION TREND: | | | |
| – Strength Index Score (3 Year Range Pct): | 13.8 | 86.9 | 27.2 |
| – Strength Index Reading (3 Year Range): | Bearish-Extreme | Bullish-Extreme | Bearish |
| NET POSITION MOVEMENT INDEX: | | | |
| – 6-Week Change in Strength Index: | -45.4 | 53.9 | -55.3 |
New Zealand Dollar Futures:
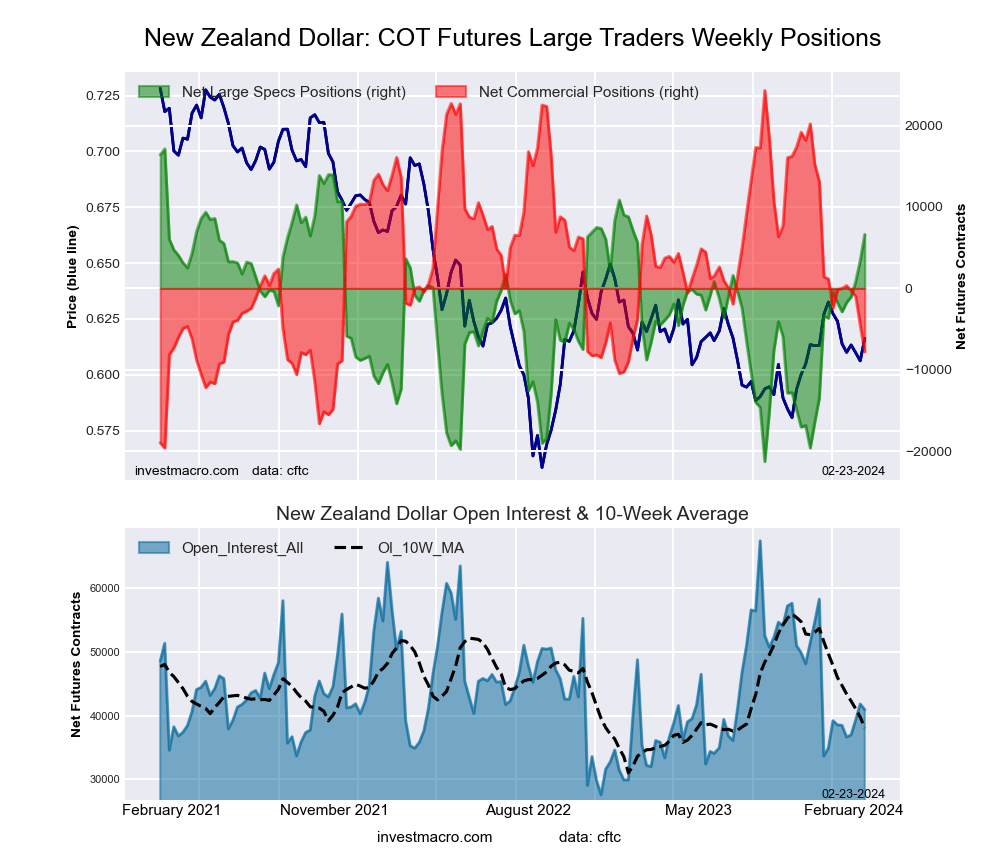 The New Zealand Dollar large speculator standing this week totaled a net position of 6,626 contracts in the data reported through Tuesday. This was a weekly rise of 3,219 contracts from the previous week which had a total of 3,407 net contracts.
This week’s current strength score (the trader positioning range over the past three years, measured from 0 to 100) shows the speculators are currently Bullish with a score of 72.7 percent. The commercials are Bearish with a score of 26.9 percent and the small traders (not shown in chart) are Bullish with a score of 69.3 percent.
Price Trend-Following Model: Uptrend
Our weekly trend-following model classifies the current market price position as: Uptrend. The current action for the model is considered to be: Hold – Maintain Long Position.
| NEW ZEALAND DOLLAR Statistics | SPECULATORS | COMMERCIALS | SMALL TRADERS |
| – Percent of Open Interest Longs: | 48.2 | 35.0 | 11.2 |
| – Percent of Open Interest Shorts: | 32.1 | 54.1 | 8.3 |
| – Net Position: | 6,626 | -7,799 | 1,173 |
| – Gross Longs: | 19,758 | 14,341 | 4,580 |
| – Gross Shorts: | 13,132 | 22,140 | 3,407 |
| – Long to Short Ratio: | 1.5 to 1 | 0.6 to 1 | 1.3 to 1 |
| NET POSITION TREND: | | | |
| – Strength Index Score (3 Year Range Pct): | 72.7 | 26.9 | 69.3 |
| – Strength Index Reading (3 Year Range): | Bullish | Bearish | Bullish |
| NET POSITION MOVEMENT INDEX: | | | |
| – 6-Week Change in Strength Index: | 21.9 | -17.3 | -10.3 |
Mexican Peso Futures:
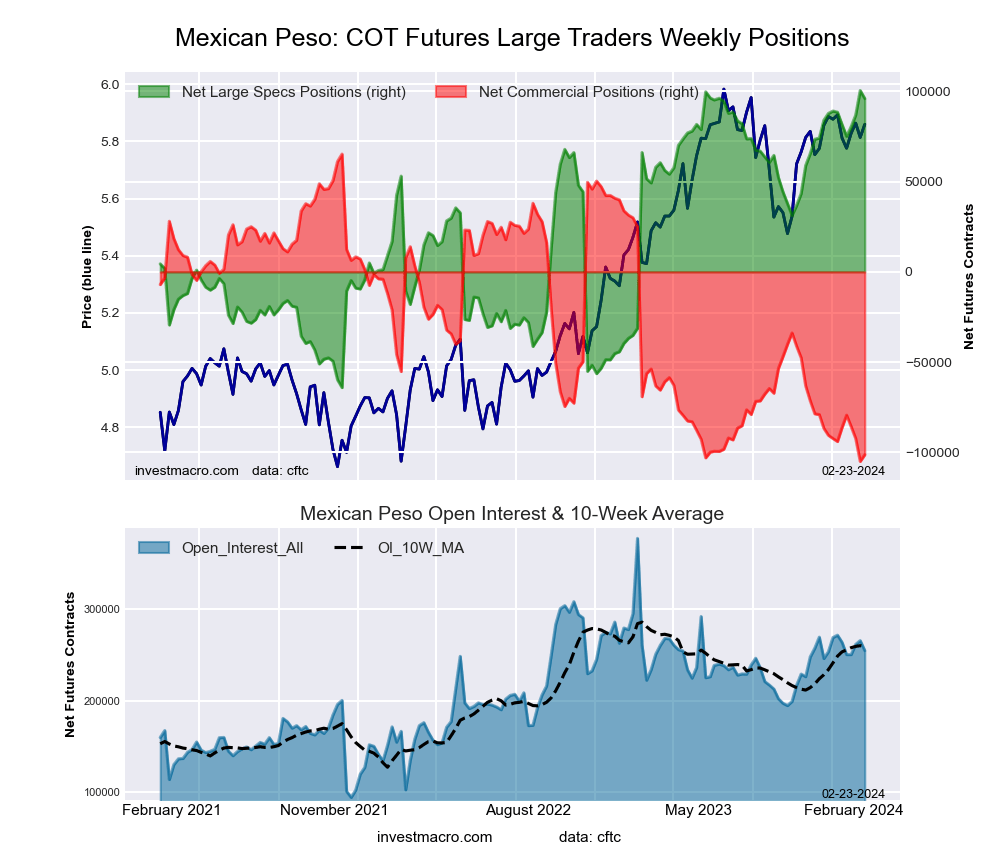 The Mexican Peso large speculator standing this week totaled a net position of 95,995 contracts in the data reported through Tuesday. This was a weekly decline of -4,449 contracts from the previous week which had a total of 100,444 net contracts.
This week’s current strength score (the trader positioning range over the past three years, measured from 0 to 100) shows the speculators are currently Bullish-Extreme with a score of 97.3 percent. The commercials are Bearish-Extreme with a score of 2.2 percent and the small traders (not shown in chart) are Bearish with a score of 45.2 percent.
Price Trend-Following Model: Uptrend
Our weekly trend-following model classifies the current market price position as: Uptrend. The current action for the model is considered to be: Hold – Maintain Long Position.
| MEXICAN PESO Statistics | SPECULATORS | COMMERCIALS | SMALL TRADERS |
| – Percent of Open Interest Longs: | 55.6 | 40.1 | 3.2 |
| – Percent of Open Interest Shorts: | 17.9 | 79.9 | 1.1 |
| – Net Position: | 95,995 | -101,330 | 5,335 |
| – Gross Longs: | 141,528 | 102,096 | 8,061 |
| – Gross Shorts: | 45,533 | 203,426 | 2,726 |
| – Long to Short Ratio: | 3.1 to 1 | 0.5 to 1 | 3.0 to 1 |
| NET POSITION TREND: | | | |
| – Strength Index Score (3 Year Range Pct): | 97.3 | 2.2 | 45.2 |
| – Strength Index Reading (3 Year Range): | Bullish-Extreme | Bearish-Extreme | Bearish |
| NET POSITION MOVEMENT INDEX: | | | |
| – 6-Week Change in Strength Index: | 4.6 | -4.3 | -1.5 |
Brazilian Real Futures:
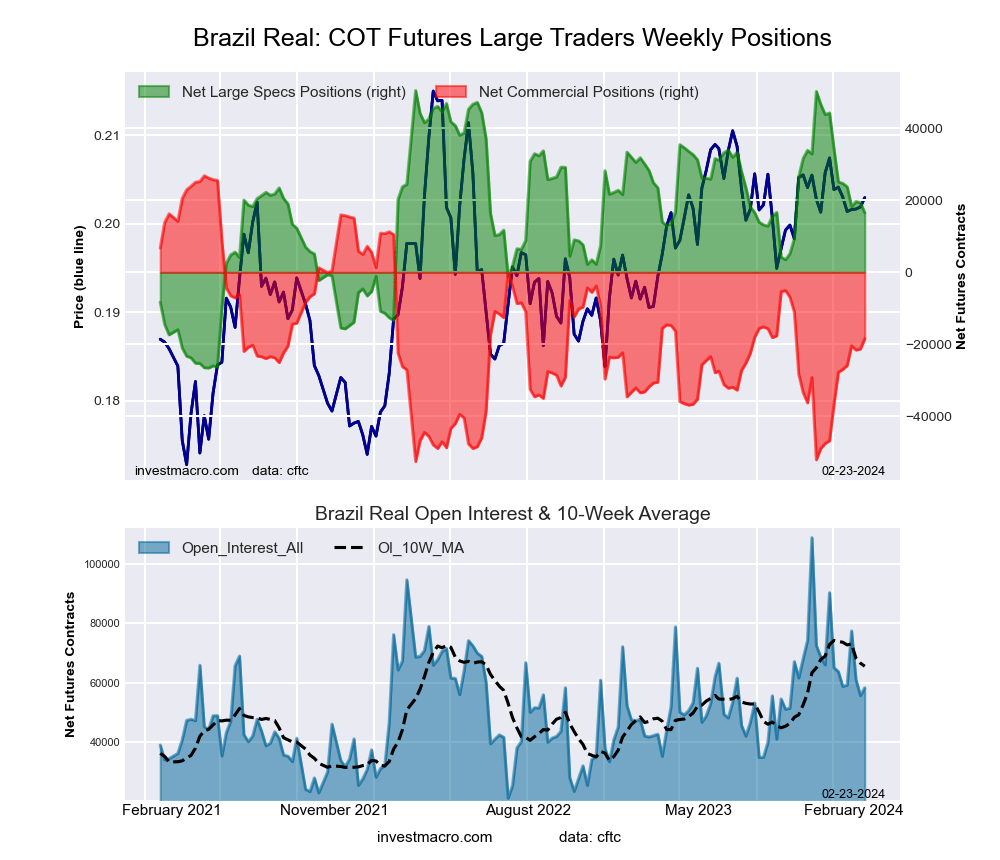 The Brazilian Real large speculator standing this week totaled a net position of 16,522 contracts in the data reported through Tuesday. This was a weekly fall of -2,826 contracts from the previous week which had a total of 19,348 net contracts.
This week’s current strength score (the trader positioning range over the past three years, measured from 0 to 100) shows the speculators are currently Bullish with a score of 55.9 percent. The commercials are Bearish with a score of 43.0 percent and the small traders (not shown in chart) are Bullish with a score of 52.4 percent.
Price Trend-Following Model: Weak Uptrend
Our weekly trend-following model classifies the current market price position as: Weak Uptrend. The current action for the model is considered to be: Hold – Maintain Long Position.
| BRAZIL REAL Statistics | SPECULATORS | COMMERCIALS | SMALL TRADERS |
| – Percent of Open Interest Longs: | 55.7 | 38.8 | 5.2 |
| – Percent of Open Interest Shorts: | 27.3 | 70.5 | 1.9 |
| – Net Position: | 16,522 | -18,453 | 1,931 |
| – Gross Longs: | 32,457 | 22,619 | 3,031 |
| – Gross Shorts: | 15,935 | 41,072 | 1,100 |
| – Long to Short Ratio: | 2.0 to 1 | 0.6 to 1 | 2.8 to 1 |
| NET POSITION TREND: | | | |
| – Strength Index Score (3 Year Range Pct): | 55.9 | 43.0 | 52.4 |
| – Strength Index Reading (3 Year Range): | Bullish | Bearish | Bullish |
| NET POSITION MOVEMENT INDEX: | | | |
| – 6-Week Change in Strength Index: | -11.1 | 11.7 | -6.6 |
Bitcoin Futures:
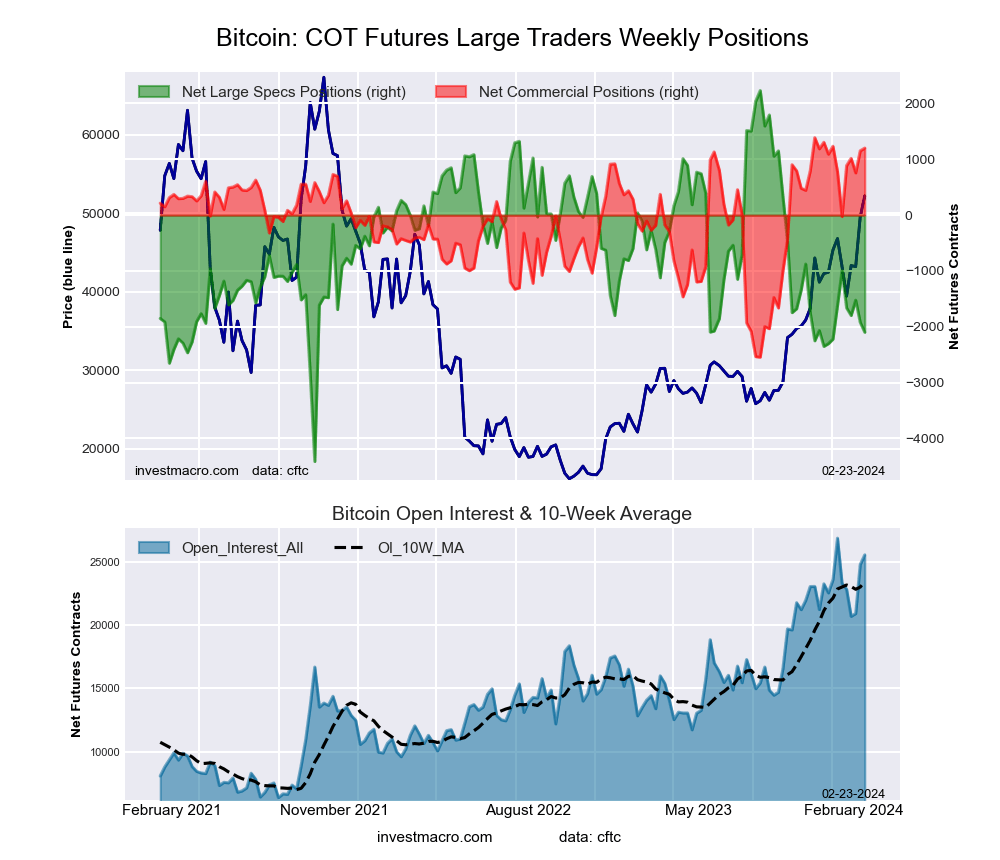 The Bitcoin large speculator standing this week totaled a net position of -2,098 contracts in the data reported through Tuesday. This was a weekly decline of -177 contracts from the previous week which had a total of -1,921 net contracts.
This week’s current strength score (the trader positioning range over the past three years, measured from 0 to 100) shows the speculators are currently Bearish with a score of 34.8 percent. The commercials are Bullish-Extreme with a score of 95.3 percent and the small traders (not shown in chart) are Bearish with a score of 33.3 percent.
Price Trend-Following Model: Strong Uptrend
Our weekly trend-following model classifies the current market price position as: Strong Uptrend. The current action for the model is considered to be: Hold – Maintain Long Position.
| BITCOIN Statistics | SPECULATORS | COMMERCIALS | SMALL TRADERS |
| – Percent of Open Interest Longs: | 76.9 | 7.3 | 6.8 |
| – Percent of Open Interest Shorts: | 85.1 | 2.6 | 3.2 |
| – Net Position: | -2,098 | 1,202 | 896 |
| – Gross Longs: | 19,624 | 1,862 | 1,724 |
| – Gross Shorts: | 21,722 | 660 | 828 |
| – Long to Short Ratio: | 0.9 to 1 | 2.8 to 1 | 2.1 to 1 |
| NET POSITION TREND: | | | |
| – Strength Index Score (3 Year Range Pct): | 34.8 | 95.3 | 33.3 |
| – Strength Index Reading (3 Year Range): | Bearish | Bullish-Extreme | Bearish |
| NET POSITION MOVEMENT INDEX: | | | |
| – 6-Week Change in Strength Index: | -7.2 | 10.8 | 1.3 |
Article By InvestMacro – Receive our weekly COT Newsletter
*COT Report: The COT data, released weekly to the public each Friday, is updated through the most recent Tuesday (data is 3 days old) and shows a quick view of how large speculators or non-commercials (for-profit traders) were positioned in the futures markets.
The CFTC categorizes trader positions according to commercial hedgers (traders who use futures contracts for hedging as part of the business), non-commercials (large traders who speculate to realize trading profits) and nonreportable traders (usually small traders/speculators) as well as their open interest (contracts open in the market at time of reporting). See CFTC criteria here.