
By InvestMacro
Here are the latest charts and statistics for the Commitment of Traders (COT) reports data published by the Commodities Futures Trading Commission (CFTC).
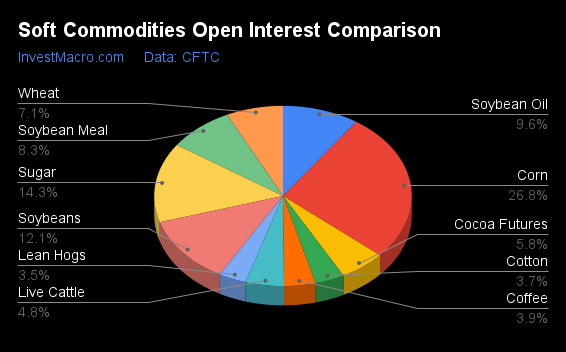
The latest COT data is updated through Tuesday January 16th and shows a quick view of how large traders (for-profit speculators and commercial entities) were positioned in the futures markets.
Weekly Speculator Changes led lower by Soybeans & Corn
The COT soft commodities markets speculator bets were lower this week as four out of the eleven softs markets we cover had higher positioning while the other seven markets had lower speculator contracts.
Free Reports:
 Get our Weekly Commitment of Traders Reports - See where the biggest traders (Hedge Funds and Commercial Hedgers) are positioned in the futures markets on a weekly basis.
 Download Our Metatrader 4 Indicators – Put Our Free MetaTrader 4 Custom Indicators on your charts when you join our Weekly Newsletter
Leading the gains for the softs markets was Cotton (5,473 contracts) with Coffee (3,794 contracts), Soybean Oil (1,621 contracts) and Cocoa (1,316 contracts) also recording positive weeks.
The markets with the declines in speculator bets this week were Soybeans (-55,619 contracts), Corn (-46,935 contracts), Wheat (-13,221 contracts), Soybean Meal (-8,752 contracts), Sugar (-8,743 contracts), Lean Hogs (-987 contracts) and Live Cattle (-559 contracts) also registering lower bets on the week.
Major Softs – Speculators Leaderboard
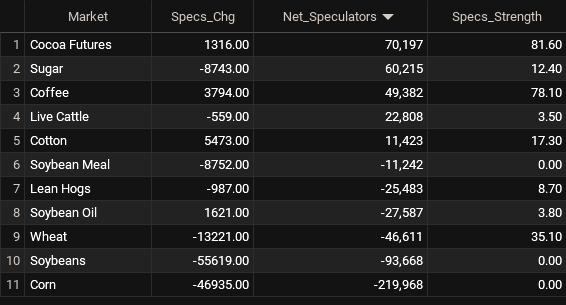
Legend: Weekly Speculators Change | Speculators Current Net Position | Speculators Strength Score compared to last 3-Years (0-100 range)
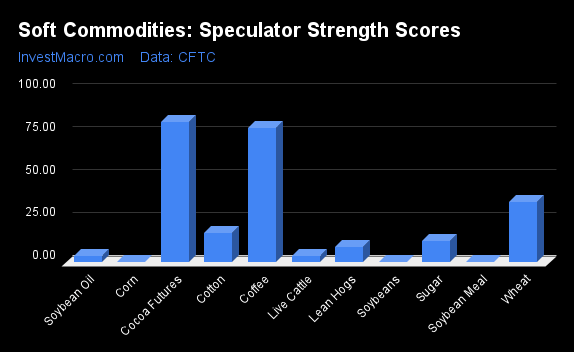
Strength Scores led by Cocoa & Coffee
COT Strength Scores (a normalized measure of Speculator positions over a 3-Year range, from 0 to 100 where above 80 is Extreme-Bullish and below 20 is Extreme-Bearish) showed that Cocoa (82 percent) and Coffee (78 percent) lead the softs markets this week. Wheat (35 percent), Cotton (17 percent) and Sugar (12 percent) come in as the next highest in the weekly strength scores.
On the downside, Soybean Meal (0 percent), Corn (0 percent), Soybeans (0 percent), Live Cattle (4 percent), Soybean Oil (4 percent), Lean Hogs (9 percent), Sugar (12 percent) and Cotton (17 percent) come in at the lowest strength levels currently and are all in Extreme-Bearish territory (below 20 percent).
Strength Statistics:
Corn (0.0 percent) vs Corn previous week (6.1 percent)
Sugar (12.4 percent) vs Sugar previous week (15.5 percent)
Coffee (78.1 percent) vs Coffee previous week (74.2 percent)
Soybeans (0.0 percent) vs Soybeans previous week (16.2 percent)
Soybean Oil (3.8 percent) vs Soybean Oil previous week (2.8 percent)
Soybean Meal (0.0 percent) vs Soybean Meal previous week (4.6 percent)
Live Cattle (3.5 percent) vs Live Cattle previous week (4.1 percent)
Lean Hogs (8.7 percent) vs Lean Hogs previous week (9.5 percent)
Cotton (17.3 percent) vs Cotton previous week (13.2 percent)
Cocoa (81.6 percent) vs Cocoa previous week (80.2 percent)
Wheat (35.1 percent) vs Wheat previous week (44.3 percent)
Coffee & Wheat top the 6-Week Strength Trends
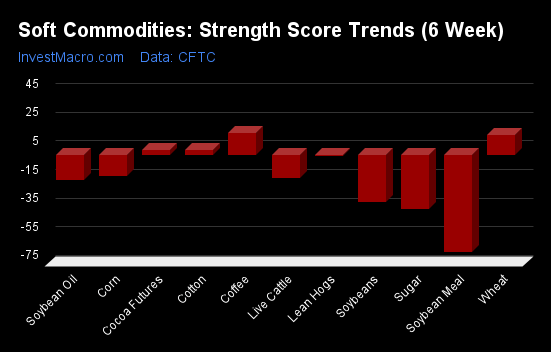
COT Strength Score Trends (or move index, calculates the 6-week changes in strength scores) showed that Coffee (16 percent) and Wheat (14 percent) lead the past six weeks trends for soft commodities. Cotton (4 percent) and Cocoa (3 percent) are the next highest positive movers in the latest trends data.
Soybean Meal (-68 percent) leads the downside trend scores currently with Sugar (-38 percent), Soybeans (-33 percent) and Soybean Oil (-18 percent) following next with lower trend scores.
Strength Trend Statistics:
Corn (-14.3 percent) vs Corn previous week (-2.1 percent)
Sugar (-38.1 percent) vs Sugar previous week (-49.3 percent)
Coffee (15.5 percent) vs Coffee previous week (15.4 percent)
Soybeans (-33.1 percent) vs Soybeans previous week (-25.8 percent)
Soybean Oil (-17.7 percent) vs Soybean Oil previous week (-26.5 percent)
Soybean Meal (-67.9 percent) vs Soybean Meal previous week (-70.7 percent)
Live Cattle (-15.8 percent) vs Live Cattle previous week (-17.8 percent)
Lean Hogs (-0.7 percent) vs Lean Hogs previous week (0.6 percent)
Cotton (3.7 percent) vs Cotton previous week (-0.2 percent)
Cocoa (3.4 percent) vs Cocoa previous week (-2.8 percent)
Wheat (14.2 percent) vs Wheat previous week (44.3 percent)
Individual Soft Commodities Markets:
CORN Futures:
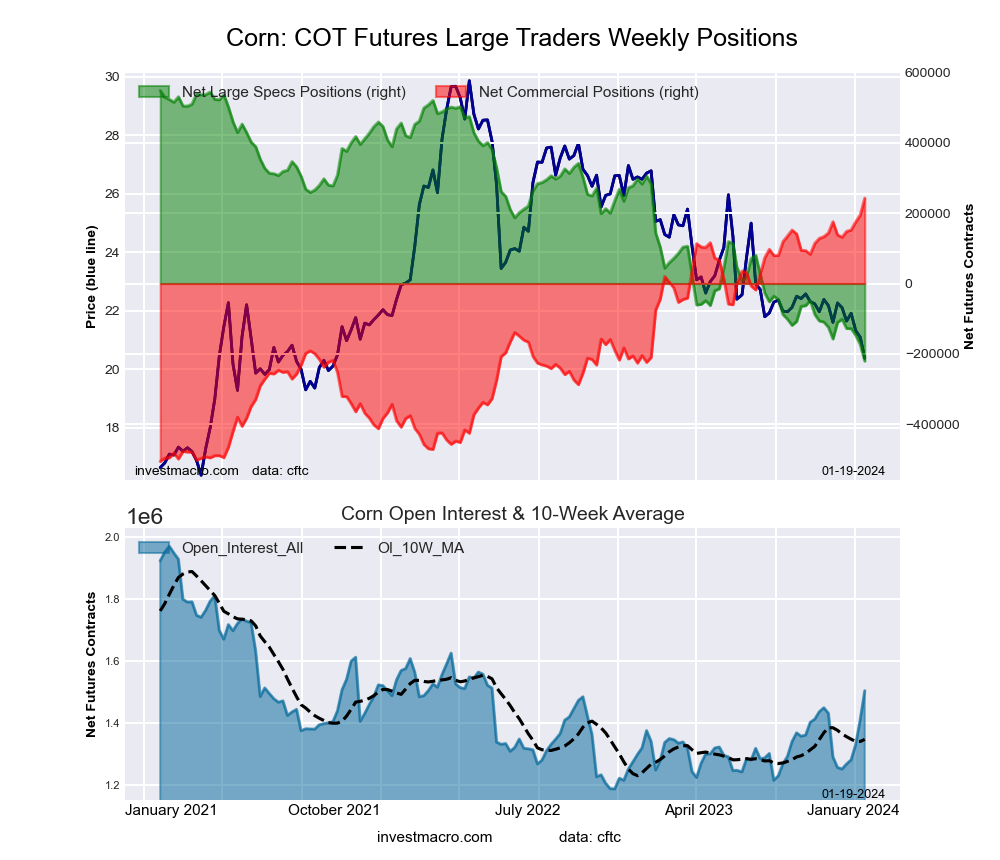 The CORN large speculator standing this week reached a net position of -219,968 contracts in the data reported through Tuesday. This was a weekly lowering of -46,935 contracts from the previous week which had a total of -173,033 net contracts.
This week’s current strength score (the trader positioning range over the past three years, measured from 0 to 100) shows the speculators are currently Bearish-Extreme with a score of 0.0 percent. The commercials are Bullish-Extreme with a score of 100.0 percent and the small traders (not shown in chart) are Bullish-Extreme with a score of 93.3 percent.
Price Trend-Following Model: Strong Downtrend
Our weekly trend-following model classifies the current market price position as: Strong Downtrend. The current action for the model is considered to be: Hold – Maintain Short Position.
| CORN Futures Statistics | SPECULATORS | COMMERCIALS | SMALL TRADERS |
| – Percent of Open Interest Longs: | 16.8 | 47.8 | 9.9 |
| – Percent of Open Interest Shorts: | 31.4 | 31.7 | 11.4 |
| – Net Position: | -219,968 | 242,217 | -22,249 |
| – Gross Longs: | 252,825 | 718,815 | 148,520 |
| – Gross Shorts: | 472,793 | 476,598 | 170,769 |
| – Long to Short Ratio: | 0.5 to 1 | 1.5 to 1 | 0.9 to 1 |
| NET POSITION TREND: | |||
| – Strength Index Score (3 Year Range Pct): | 0.0 | 100.0 | 93.3 |
| – Strength Index Reading (3 Year Range): | Bearish-Extreme | Bullish-Extreme | Bullish-Extreme |
| NET POSITION MOVEMENT INDEX: | |||
| – 6-Week Change in Strength Index: | -14.3 | 14.0 | 8.0 |
SUGAR Futures:
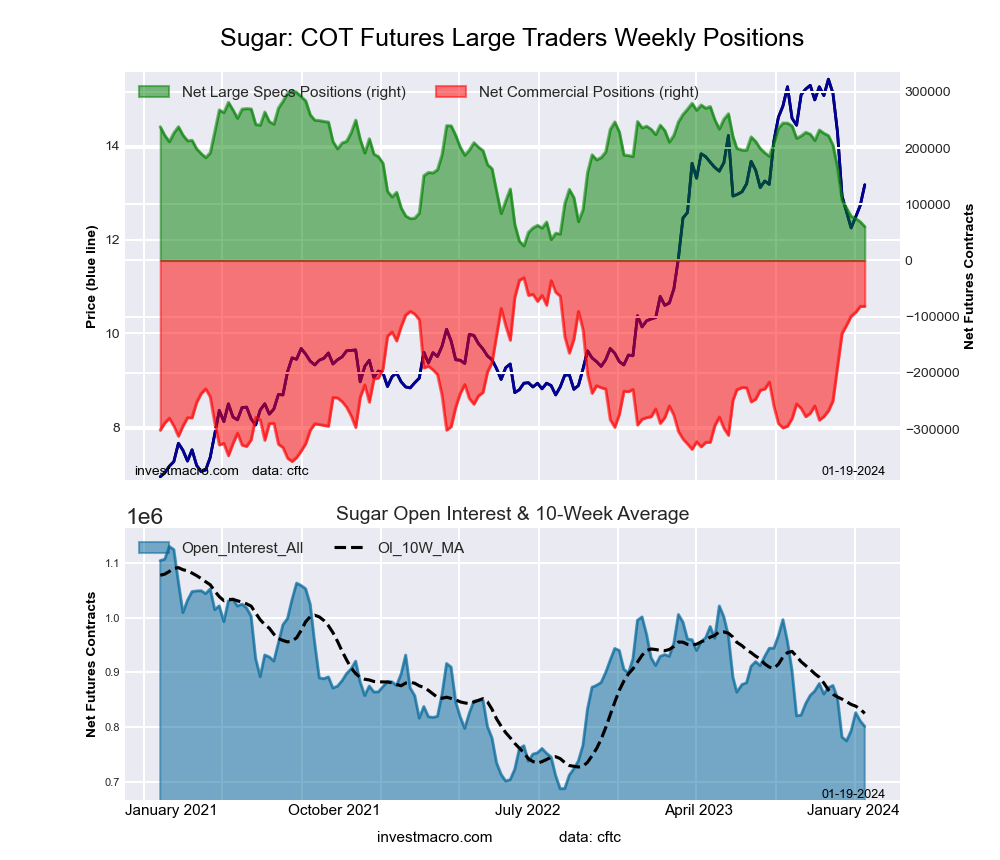 The SUGAR large speculator standing this week reached a net position of 60,215 contracts in the data reported through Tuesday. This was a weekly reduction of -8,743 contracts from the previous week which had a total of 68,958 net contracts.
This week’s current strength score (the trader positioning range over the past three years, measured from 0 to 100) shows the speculators are currently Bearish-Extreme with a score of 12.4 percent. The commercials are Bullish-Extreme with a score of 84.4 percent and the small traders (not shown in chart) are Bearish with a score of 30.0 percent.
Price Trend-Following Model: Downtrend
Our weekly trend-following model classifies the current market price position as: Downtrend. The current action for the model is considered to be: Hold – Maintain Short Position.
| SUGAR Futures Statistics | SPECULATORS | COMMERCIALS | SMALL TRADERS |
| – Percent of Open Interest Longs: | 20.9 | 57.8 | 9.5 |
| – Percent of Open Interest Shorts: | 13.4 | 68.0 | 6.8 |
| – Net Position: | 60,215 | -81,568 | 21,353 |
| – Gross Longs: | 167,220 | 463,362 | 75,786 |
| – Gross Shorts: | 107,005 | 544,930 | 54,433 |
| – Long to Short Ratio: | 1.6 to 1 | 0.9 to 1 | 1.4 to 1 |
| NET POSITION TREND: | |||
| – Strength Index Score (3 Year Range Pct): | 12.4 | 84.4 | 30.0 |
| – Strength Index Reading (3 Year Range): | Bearish-Extreme | Bullish-Extreme | Bearish |
| NET POSITION MOVEMENT INDEX: | |||
| – 6-Week Change in Strength Index: | -38.1 | 32.8 | -2.6 |
COFFEE Futures:
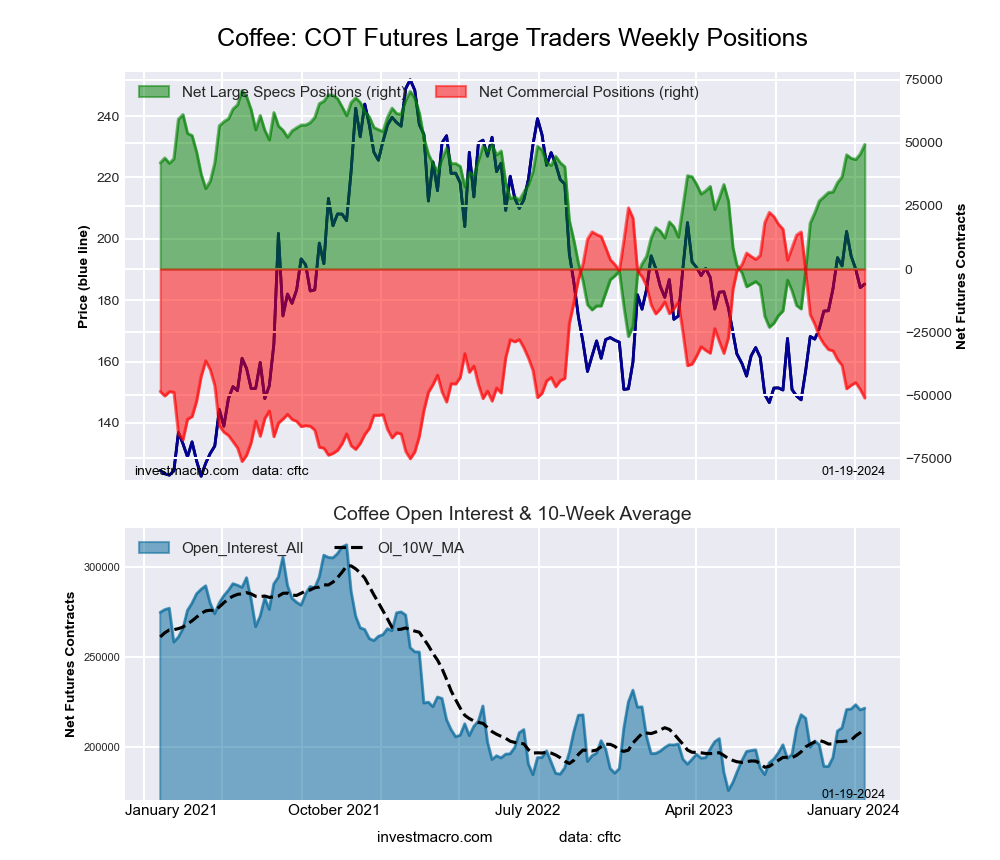 The COFFEE large speculator standing this week reached a net position of 49,382 contracts in the data reported through Tuesday. This was a weekly advance of 3,794 contracts from the previous week which had a total of 45,588 net contracts.
This week’s current strength score (the trader positioning range over the past three years, measured from 0 to 100) shows the speculators are currently Bullish with a score of 78.1 percent. The commercials are Bearish with a score of 25.0 percent and the small traders (not shown in chart) are Bearish with a score of 36.4 percent.
Price Trend-Following Model: Uptrend
Our weekly trend-following model classifies the current market price position as: Uptrend. The current action for the model is considered to be: Hold – Maintain Long Position.
| COFFEE Futures Statistics | SPECULATORS | COMMERCIALS | SMALL TRADERS |
| – Percent of Open Interest Longs: | 33.0 | 35.5 | 4.7 |
| – Percent of Open Interest Shorts: | 10.7 | 58.6 | 3.9 |
| – Net Position: | 49,382 | -51,147 | 1,765 |
| – Gross Longs: | 72,967 | 78,642 | 10,343 |
| – Gross Shorts: | 23,585 | 129,789 | 8,578 |
| – Long to Short Ratio: | 3.1 to 1 | 0.6 to 1 | 1.2 to 1 |
| NET POSITION TREND: | |||
| – Strength Index Score (3 Year Range Pct): | 78.1 | 25.0 | 36.4 |
| – Strength Index Reading (3 Year Range): | Bullish | Bearish | Bearish |
| NET POSITION MOVEMENT INDEX: | |||
| – 6-Week Change in Strength Index: | 15.5 | -15.2 | 1.9 |
SOYBEANS Futures:
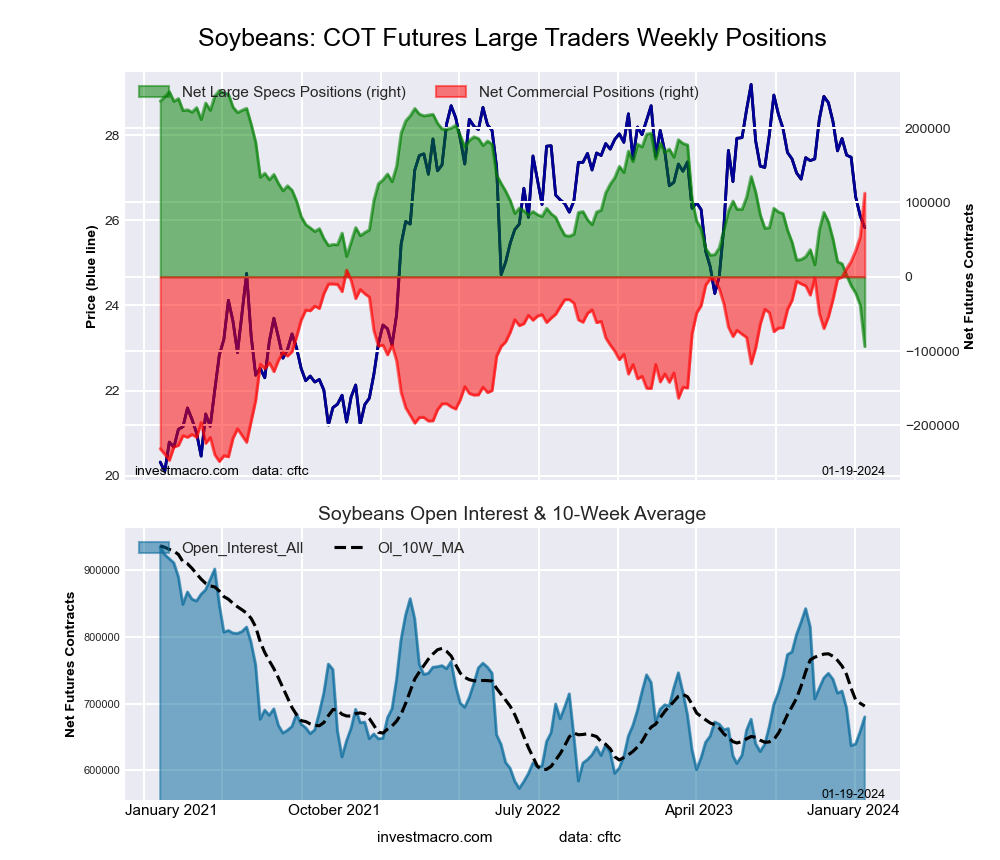 The SOYBEANS large speculator standing this week reached a net position of -93,668 contracts in the data reported through Tuesday. This was a weekly reduction of -55,619 contracts from the previous week which had a total of -38,049 net contracts.
This week’s current strength score (the trader positioning range over the past three years, measured from 0 to 100) shows the speculators are currently Bearish-Extreme with a score of 0.0 percent. The commercials are Bullish-Extreme with a score of 100.0 percent and the small traders (not shown in chart) are Bullish with a score of 59.5 percent.
Price Trend-Following Model: Strong Downtrend
Our weekly trend-following model classifies the current market price position as: Strong Downtrend. The current action for the model is considered to be: Hold – Maintain Short Position.
| SOYBEANS Futures Statistics | SPECULATORS | COMMERCIALS | SMALL TRADERS |
| – Percent of Open Interest Longs: | 12.6 | 59.8 | 7.0 |
| – Percent of Open Interest Shorts: | 26.3 | 43.2 | 9.7 |
| – Net Position: | -93,668 | 112,439 | -18,771 |
| – Gross Longs: | 85,450 | 406,415 | 47,386 |
| – Gross Shorts: | 179,118 | 293,976 | 66,157 |
| – Long to Short Ratio: | 0.5 to 1 | 1.4 to 1 | 0.7 to 1 |
| NET POSITION TREND: | |||
| – Strength Index Score (3 Year Range Pct): | 0.0 | 100.0 | 59.5 |
| – Strength Index Reading (3 Year Range): | Bearish-Extreme | Bullish-Extreme | Bullish |
| NET POSITION MOVEMENT INDEX: | |||
| – 6-Week Change in Strength Index: | -33.1 | 32.0 | -3.5 |
SOYBEAN OIL Futures:
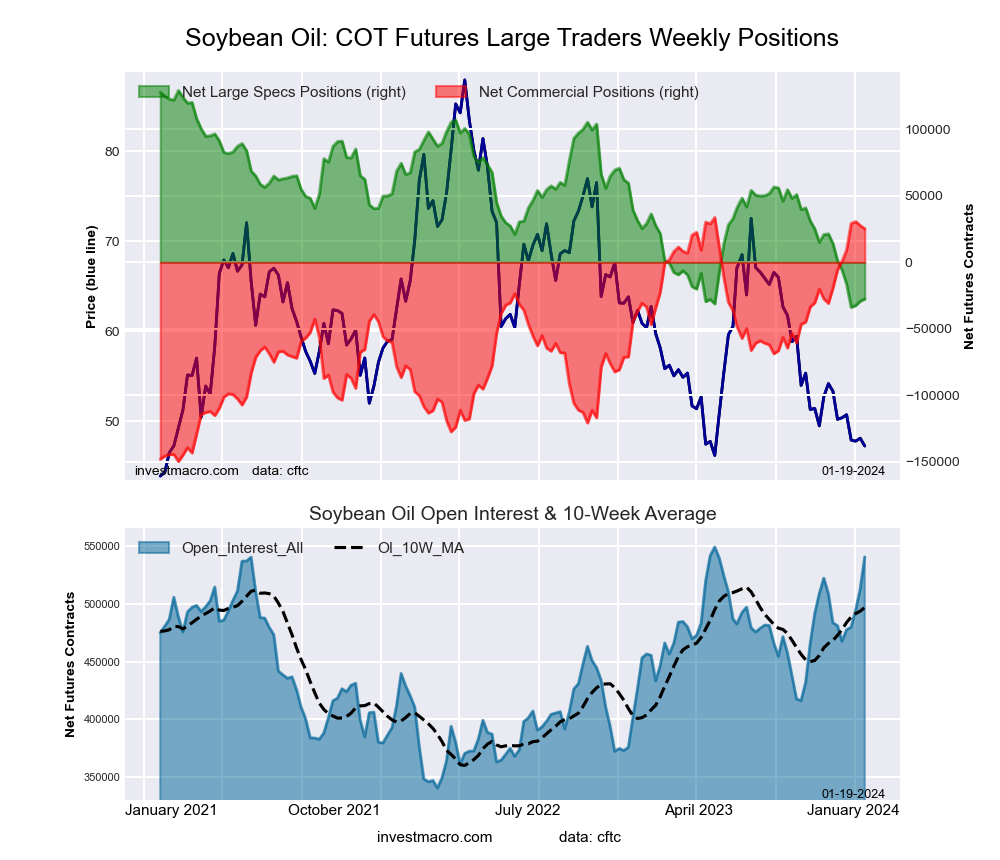 The SOYBEAN OIL large speculator standing this week reached a net position of -27,587 contracts in the data reported through Tuesday. This was a weekly lift of 1,621 contracts from the previous week which had a total of -29,208 net contracts.
This week’s current strength score (the trader positioning range over the past three years, measured from 0 to 100) shows the speculators are currently Bearish-Extreme with a score of 3.8 percent. The commercials are Bullish-Extreme with a score of 95.4 percent and the small traders (not shown in chart) are Bearish with a score of 22.3 percent.
Price Trend-Following Model: Downtrend
Our weekly trend-following model classifies the current market price position as: Downtrend. The current action for the model is considered to be: Hold – Maintain Short Position.
| SOYBEAN OIL Futures Statistics | SPECULATORS | COMMERCIALS | SMALL TRADERS |
| – Percent of Open Interest Longs: | 18.7 | 50.6 | 5.6 |
| – Percent of Open Interest Shorts: | 23.8 | 45.9 | 5.1 |
| – Net Position: | -27,587 | 25,234 | 2,353 |
| – Gross Longs: | 101,070 | 273,291 | 30,152 |
| – Gross Shorts: | 128,657 | 248,057 | 27,799 |
| – Long to Short Ratio: | 0.8 to 1 | 1.1 to 1 | 1.1 to 1 |
| NET POSITION TREND: | |||
| – Strength Index Score (3 Year Range Pct): | 3.8 | 95.4 | 22.3 |
| – Strength Index Reading (3 Year Range): | Bearish-Extreme | Bullish-Extreme | Bearish |
| NET POSITION MOVEMENT INDEX: | |||
| – 6-Week Change in Strength Index: | -17.7 | 16.9 | -8.1 |
SOYBEAN MEAL Futures:
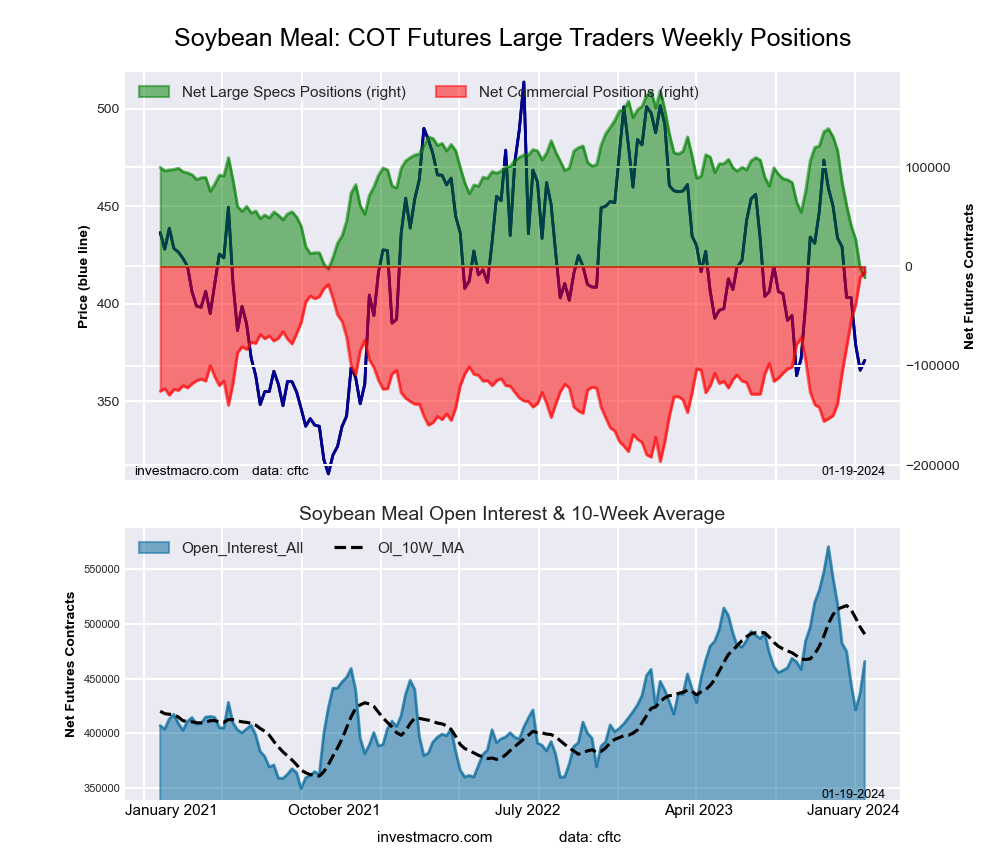 The SOYBEAN MEAL large speculator standing this week reached a net position of -11,242 contracts in the data reported through Tuesday. This was a weekly decline of -8,752 contracts from the previous week which had a total of -2,490 net contracts.
This week’s current strength score (the trader positioning range over the past three years, measured from 0 to 100) shows the speculators are currently Bearish-Extreme with a score of 0.0 percent. The commercials are Bullish-Extreme with a score of 100.0 percent and the small traders (not shown in chart) are Bearish with a score of 33.6 percent.
Price Trend-Following Model: Strong Downtrend
Our weekly trend-following model classifies the current market price position as: Strong Downtrend. The current action for the model is considered to be: Hold – Maintain Short Position.
| SOYBEAN MEAL Futures Statistics | SPECULATORS | COMMERCIALS | SMALL TRADERS |
| – Percent of Open Interest Longs: | 18.7 | 48.9 | 10.5 |
| – Percent of Open Interest Shorts: | 21.2 | 50.3 | 6.8 |
| – Net Position: | -11,242 | -6,171 | 17,413 |
| – Gross Longs: | 87,316 | 227,973 | 49,045 |
| – Gross Shorts: | 98,558 | 234,144 | 31,632 |
| – Long to Short Ratio: | 0.9 to 1 | 1.0 to 1 | 1.6 to 1 |
| NET POSITION TREND: | |||
| – Strength Index Score (3 Year Range Pct): | 0.0 | 100.0 | 33.6 |
| – Strength Index Reading (3 Year Range): | Bearish-Extreme | Bullish-Extreme | Bearish |
| NET POSITION MOVEMENT INDEX: | |||
| – 6-Week Change in Strength Index: | -67.9 | 69.7 | -19.8 |
LIVE CATTLE Futures:
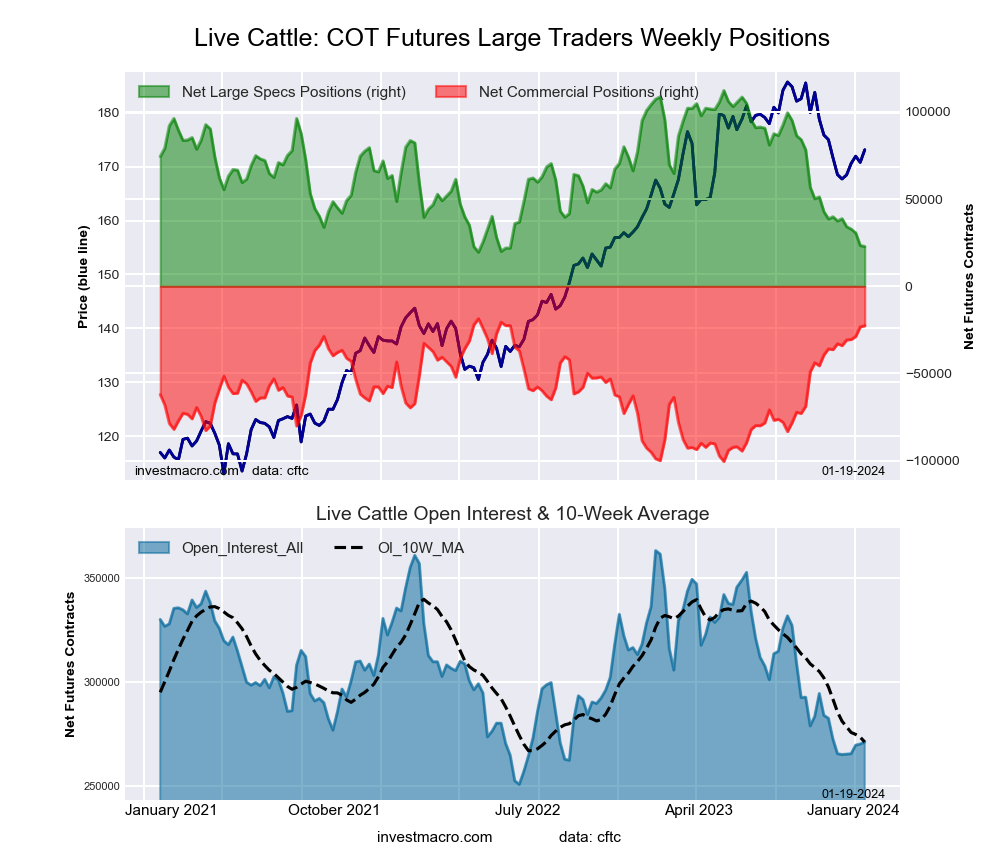 The LIVE CATTLE large speculator standing this week reached a net position of 22,808 contracts in the data reported through Tuesday. This was a weekly decrease of -559 contracts from the previous week which had a total of 23,367 net contracts.
This week’s current strength score (the trader positioning range over the past three years, measured from 0 to 100) shows the speculators are currently Bearish-Extreme with a score of 3.5 percent. The commercials are Bullish-Extreme with a score of 95.1 percent and the small traders (not shown in chart) are Bullish-Extreme with a score of 88.7 percent.
Price Trend-Following Model: Downtrend
Our weekly trend-following model classifies the current market price position as: Downtrend. The current action for the model is considered to be: Hold – Maintain Short Position.
| LIVE CATTLE Futures Statistics | SPECULATORS | COMMERCIALS | SMALL TRADERS |
| – Percent of Open Interest Longs: | 26.5 | 40.3 | 12.3 |
| – Percent of Open Interest Shorts: | 18.1 | 48.6 | 12.4 |
| – Net Position: | 22,808 | -22,619 | -189 |
| – Gross Longs: | 71,847 | 109,224 | 33,303 |
| – Gross Shorts: | 49,039 | 131,843 | 33,492 |
| – Long to Short Ratio: | 1.5 to 1 | 0.8 to 1 | 1.0 to 1 |
| NET POSITION TREND: | |||
| – Strength Index Score (3 Year Range Pct): | 3.5 | 95.1 | 88.7 |
| – Strength Index Reading (3 Year Range): | Bearish-Extreme | Bullish-Extreme | Bullish-Extreme |
| NET POSITION MOVEMENT INDEX: | |||
| – 6-Week Change in Strength Index: | -15.8 | 12.6 | 23.0 |
LEAN HOGS Futures:
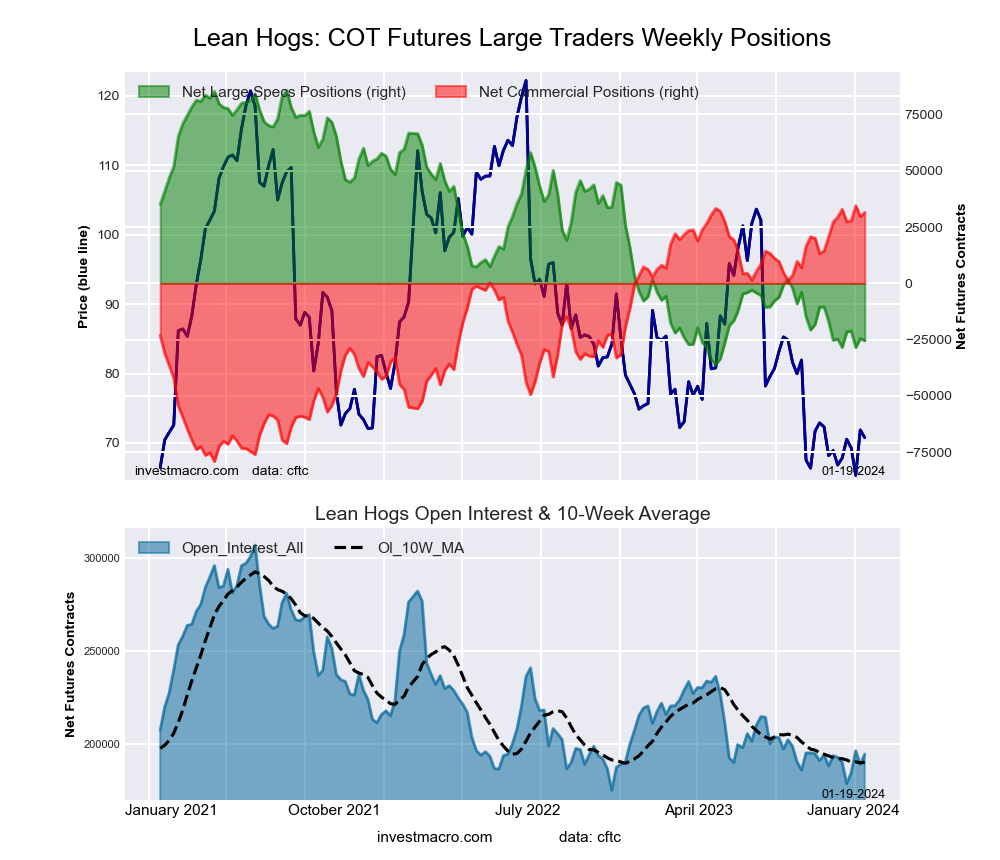 The LEAN HOGS large speculator standing this week reached a net position of -25,483 contracts in the data reported through Tuesday. This was a weekly decline of -987 contracts from the previous week which had a total of -24,496 net contracts.
This week’s current strength score (the trader positioning range over the past three years, measured from 0 to 100) shows the speculators are currently Bearish-Extreme with a score of 8.7 percent. The commercials are Bullish-Extreme with a score of 97.4 percent and the small traders (not shown in chart) are Bullish with a score of 56.5 percent.
Price Trend-Following Model: Downtrend
Our weekly trend-following model classifies the current market price position as: Downtrend. The current action for the model is considered to be: Hold – Maintain Short Position.
| LEAN HOGS Futures Statistics | SPECULATORS | COMMERCIALS | SMALL TRADERS |
| – Percent of Open Interest Longs: | 30.1 | 39.1 | 7.8 |
| – Percent of Open Interest Shorts: | 43.2 | 22.9 | 10.9 |
| – Net Position: | -25,483 | 31,462 | -5,979 |
| – Gross Longs: | 58,540 | 75,951 | 15,122 |
| – Gross Shorts: | 84,023 | 44,489 | 21,101 |
| – Long to Short Ratio: | 0.7 to 1 | 1.7 to 1 | 0.7 to 1 |
| NET POSITION TREND: | |||
| – Strength Index Score (3 Year Range Pct): | 8.7 | 97.4 | 56.5 |
| – Strength Index Reading (3 Year Range): | Bearish-Extreme | Bullish-Extreme | Bullish |
| NET POSITION MOVEMENT INDEX: | |||
| – 6-Week Change in Strength Index: | -0.7 | 1.8 | -5.5 |
COTTON Futures:
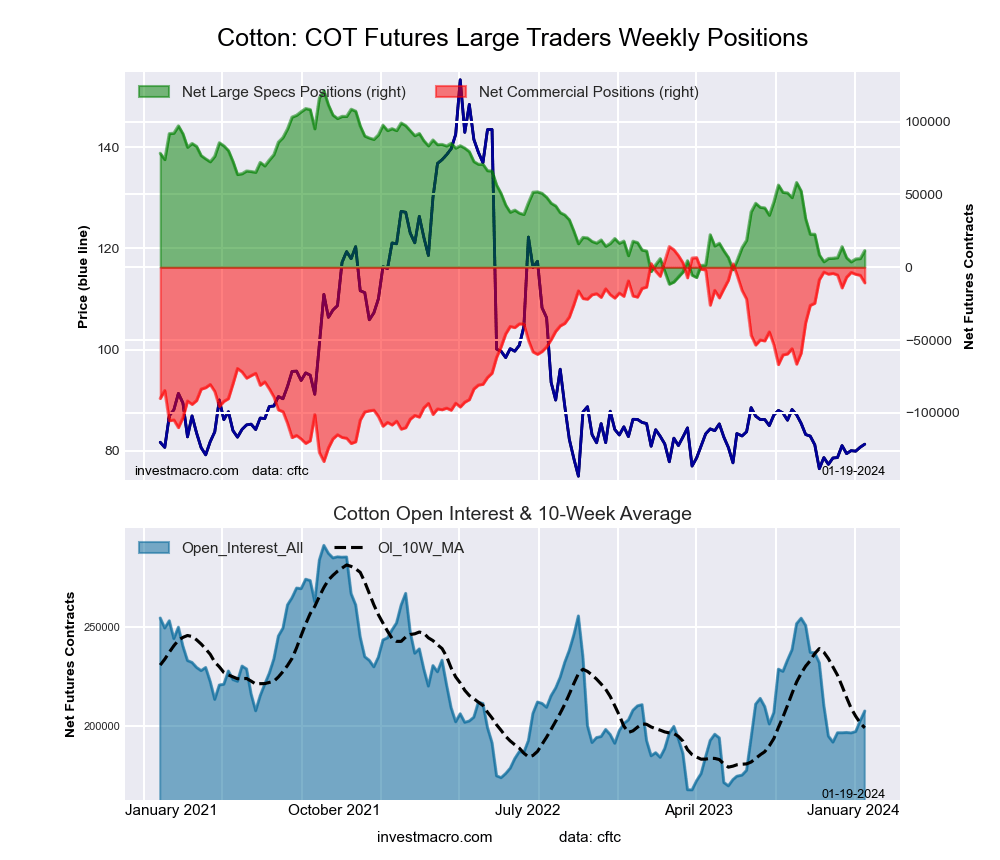 The COTTON large speculator standing this week reached a net position of 11,423 contracts in the data reported through Tuesday. This was a weekly increase of 5,473 contracts from the previous week which had a total of 5,950 net contracts.
This week’s current strength score (the trader positioning range over the past three years, measured from 0 to 100) shows the speculators are currently Bearish-Extreme with a score of 17.3 percent. The commercials are Bullish-Extreme with a score of 83.1 percent and the small traders (not shown in chart) are Bearish-Extreme with a score of 11.6 percent.
Price Trend-Following Model: Weak Downtrend
Our weekly trend-following model classifies the current market price position as: Weak Downtrend. The current action for the model is considered to be: Hold – Maintain Short Position.
| COTTON Futures Statistics | SPECULATORS | COMMERCIALS | SMALL TRADERS |
| – Percent of Open Interest Longs: | 29.6 | 45.6 | 5.5 |
| – Percent of Open Interest Shorts: | 24.1 | 50.7 | 5.9 |
| – Net Position: | 11,423 | -10,695 | -728 |
| – Gross Longs: | 61,411 | 94,659 | 11,495 |
| – Gross Shorts: | 49,988 | 105,354 | 12,223 |
| – Long to Short Ratio: | 1.2 to 1 | 0.9 to 1 | 0.9 to 1 |
| NET POSITION TREND: | |||
| – Strength Index Score (3 Year Range Pct): | 17.3 | 83.1 | 11.6 |
| – Strength Index Reading (3 Year Range): | Bearish-Extreme | Bullish-Extreme | Bearish-Extreme |
| NET POSITION MOVEMENT INDEX: | |||
| – 6-Week Change in Strength Index: | 3.7 | -3.7 | 3.3 |
COCOA Futures:
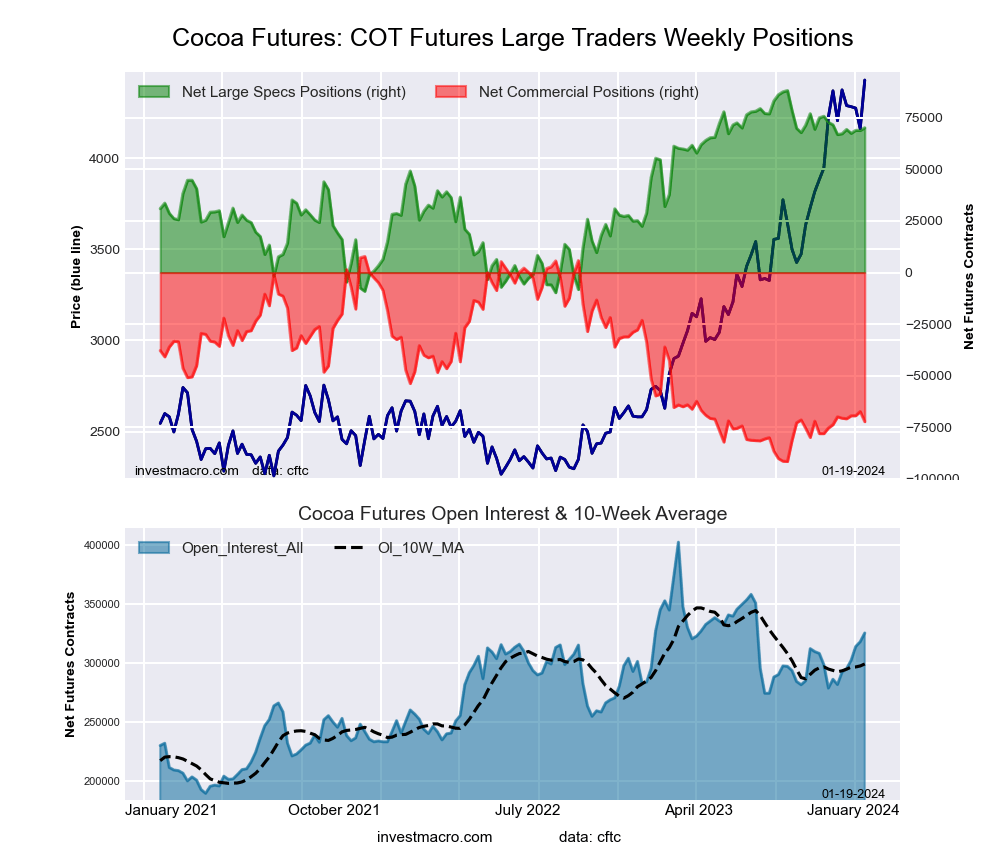 The COCOA large speculator standing this week reached a net position of 70,197 contracts in the data reported through Tuesday. This was a weekly advance of 1,316 contracts from the previous week which had a total of 68,881 net contracts.
This week’s current strength score (the trader positioning range over the past three years, measured from 0 to 100) shows the speculators are currently Bullish-Extreme with a score of 81.6 percent. The commercials are Bearish-Extreme with a score of 19.4 percent and the small traders (not shown in chart) are Bearish with a score of 30.3 percent.
Price Trend-Following Model: Uptrend
Our weekly trend-following model classifies the current market price position as: Uptrend. The current action for the model is considered to be: Hold – Maintain Long Position.
| COCOA Futures Statistics | SPECULATORS | COMMERCIALS | SMALL TRADERS |
| – Percent of Open Interest Longs: | 38.7 | 25.1 | 5.4 |
| – Percent of Open Interest Shorts: | 17.2 | 47.3 | 4.7 |
| – Net Position: | 70,197 | -72,315 | 2,118 |
| – Gross Longs: | 126,075 | 81,839 | 17,499 |
| – Gross Shorts: | 55,878 | 154,154 | 15,381 |
| – Long to Short Ratio: | 2.3 to 1 | 0.5 to 1 | 1.1 to 1 |
| NET POSITION TREND: | |||
| – Strength Index Score (3 Year Range Pct): | 81.6 | 19.4 | 30.3 |
| – Strength Index Reading (3 Year Range): | Bullish-Extreme | Bearish-Extreme | Bearish |
| NET POSITION MOVEMENT INDEX: | |||
| – 6-Week Change in Strength Index: | 3.4 | -2.3 | -8.2 |
WHEAT Futures:
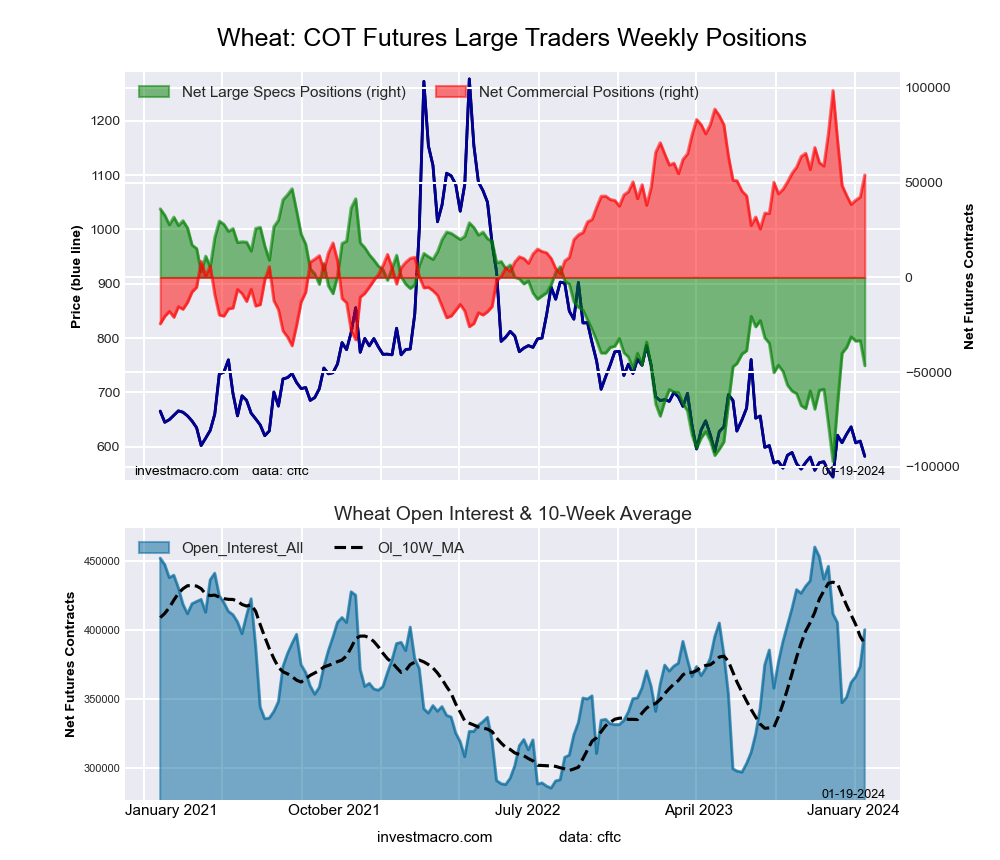 The WHEAT large speculator standing this week reached a net position of -46,611 contracts in the data reported through Tuesday. This was a weekly lowering of -13,221 contracts from the previous week which had a total of -33,390 net contracts.
This week’s current strength score (the trader positioning range over the past three years, measured from 0 to 100) shows the speculators are currently Bearish with a score of 35.1 percent. The commercials are Bullish with a score of 66.9 percent and the small traders (not shown in chart) are Bearish with a score of 33.7 percent.
Price Trend-Following Model: Weak Uptrend
Our weekly trend-following model classifies the current market price position as: Weak Uptrend. The current action for the model is considered to be: Hold – Maintain Long Position.
| WHEAT Futures Statistics | SPECULATORS | COMMERCIALS | SMALL TRADERS |
| – Percent of Open Interest Longs: | 27.3 | 38.2 | 7.6 |
| – Percent of Open Interest Shorts: | 38.9 | 24.7 | 9.5 |
| – Net Position: | -46,611 | 54,064 | -7,453 |
| – Gross Longs: | 109,221 | 153,035 | 30,403 |
| – Gross Shorts: | 155,832 | 98,971 | 37,856 |
| – Long to Short Ratio: | 0.7 to 1 | 1.5 to 1 | 0.8 to 1 |
| NET POSITION TREND: | |||
| – Strength Index Score (3 Year Range Pct): | 35.1 | 66.9 | 33.7 |
| – Strength Index Reading (3 Year Range): | Bearish | Bullish | Bearish |
| NET POSITION MOVEMENT INDEX: | |||
| – 6-Week Change in Strength Index: | 14.2 | -13.7 | -8.5 |
Article By InvestMacro – Receive our weekly COT Newsletter
*COT Report: The COT data, released weekly to the public each Friday, is updated through the most recent Tuesday (data is 3 days old) and shows a quick view of how large speculators or non-commercials (for-profit traders) were positioned in the futures markets.
The CFTC categorizes trader positions according to commercial hedgers (traders who use futures contracts for hedging as part of the business), non-commercials (large traders who speculate to realize trading profits) and nonreportable traders (usually small traders/speculators) as well as their open interest (contracts open in the market at time of reporting). See CFTC criteria here.

- The Bank of Canada kept its interest rate unchanged. Platinum prices reached a three‑week high Jul 16, 2026
- Stock indices rose after the release of US inflation data. China’s GDP slowed sharply Jul 15, 2026
- GBP/USD Awaits Political News: What Will Happen Next Jul 15, 2026
- USD/JPY Holds at Highs: Pressure Lingers on Yen Jul 14, 2026
- Oil prices jumped 4% amid a new wave of escalation between the US and Iran Jul 13, 2026
- EUR/USD: US Inflation Will Determine Everything Jul 13, 2026
- COT Metals Charts: Weekly Speculator Bets see small gains for Silver & Gold Jul 12, 2026
- COT Bonds Charts: Speculator Bets led by SOFR 3-Months & 2-Year Bonds Jul 12, 2026
- COT Energy Charts: Weekly Speculator Changes led by Brent Oil Jul 12, 2026
- COT Soft Commodities Charts: Weekly Speculator Changes led by Sugar, Corn & Soybeans Jul 12, 2026