The latest update for the weekly Commitment of Traders (COT) report was released by the Commodity Futures Trading Commission (CFTC) on Friday for data ending on February 27th.
This weekly Extreme Positions report highlights the Most Bullish and Most Bearish Positions for the speculator category. Extreme positioning in these markets can foreshadow strong moves in the underlying market.
To signify an extreme position, we use the Strength Index (also known as the COT Index) of each instrument, a common method of measuring COT data. The Strength Index is simply a comparison of current trader positions against the range of positions over the previous 3 years. We use over 80 percent as extremely bullish and under 20 percent as extremely bearish. (Compare Strength Index scores across all markets in the data table or cot leaders table)
Here Are This Week’s Most Bullish Speculator Positions:
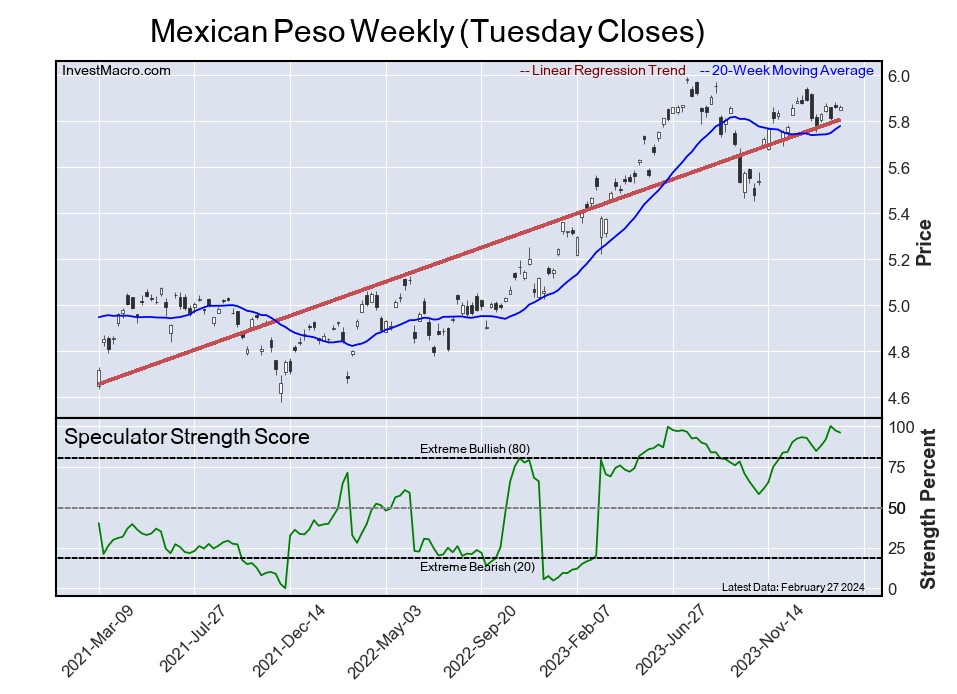
Mexican Peso
The Mexican Peso speculator position comes in as the most bullish extreme standing this week. The Mexican Peso speculator level is currently at a 96.0 percent score of its 3-year range.
The six-week trend for the percent strength score totaled 7.4 this week. The overall net speculator position was a total of 93,814 net contracts this week with a dip of -2,181 contract in the weekly speculator bets.
Speculators or Non-Commercials Notes:
Speculators, classified as non-commercial traders by the CFTC, are made up of large commodity funds, hedge funds and other significant for-profit participants. The Specs are generally regarded as trend-followers in their behavior towards price action – net speculator bets and prices tend to go in the same directions. These traders often look to buy when prices are rising and sell when prices are falling. To illustrate this point, many times speculator contracts can be found at their most extremes (bullish or bearish) when prices are also close to their highest or lowest levels.
These extreme levels can be dangerous for the large speculators as the trade is most crowded, there is less trading ammunition still sitting on the sidelines to push the trend further and prices have moved a significant distance. When the trend becomes exhausted, some speculators take profits while others look to also exit positions when prices fail to continue in the same direction. This process usually plays out over many months to years and can ultimately create a reverse effect where prices start to fall and speculators start a process of selling when prices are falling.
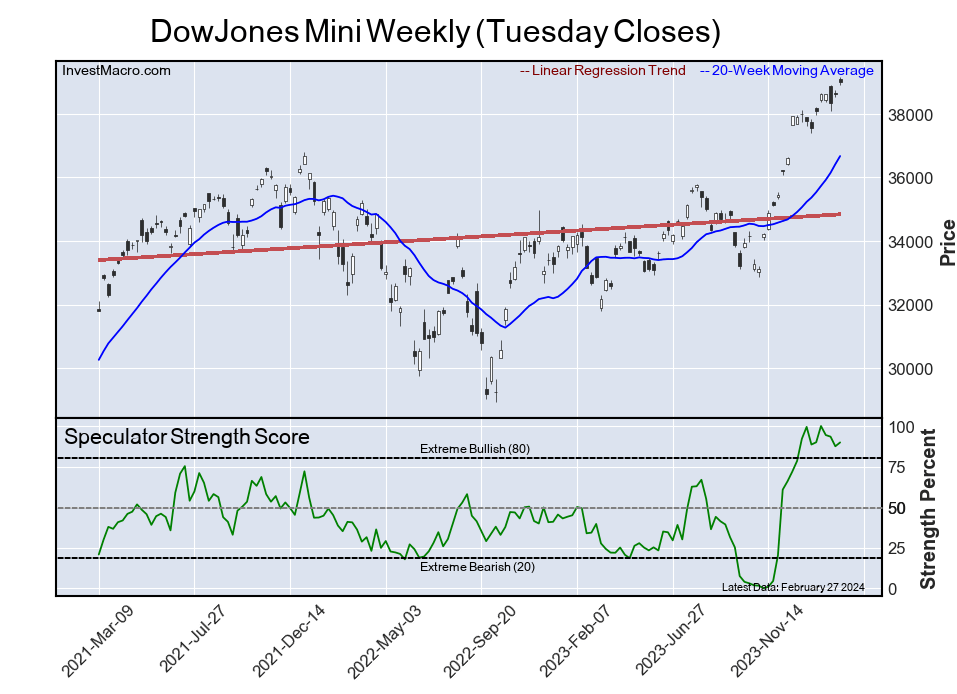
DowJones Mini
The DowJones Mini speculator position comes next in the extreme standings this week. The DowJones Mini speculator level is now at a 89.9 percent score of its 3-year range.
The six-week trend for the percent strength score was 1.3 this week. The speculator position registered 18,188 net contracts this week with a weekly gain of 1,460 contracts in speculator bets.
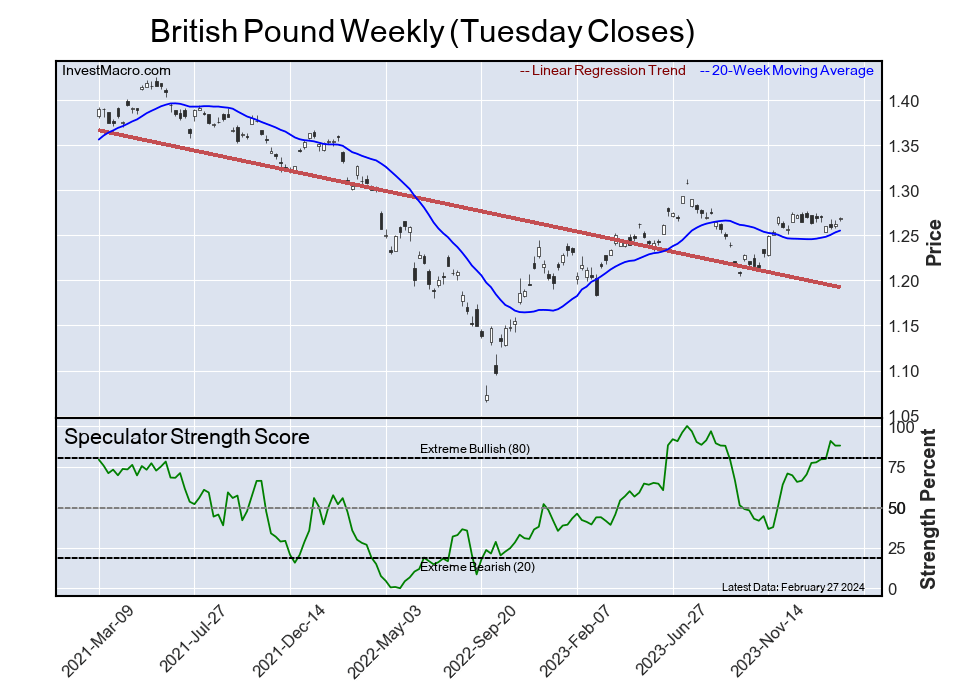
British Pound
The British Pound speculator position comes in third this week in the extreme standings. The British Pound speculator level resides at a 87.9 percent score of its 3-year range.
The six-week trend for the speculator strength score came in at 10.7 this week. The overall speculator position was 46,358 net contracts this week with a small edge higher by 46 contracts in the weekly speculator bets.
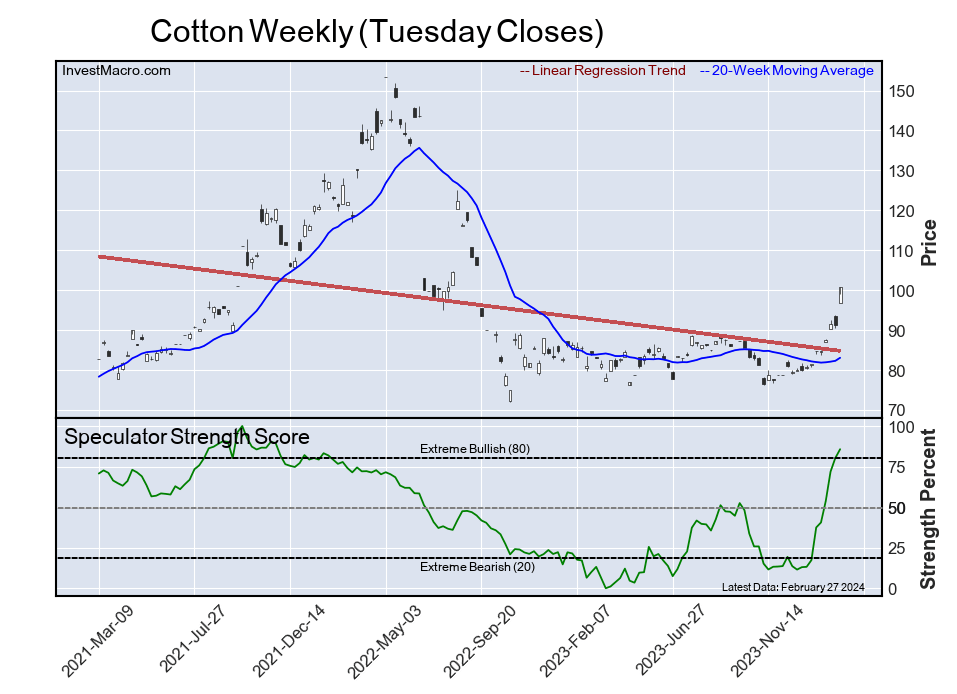
Cotton
The Cotton speculator position comes up number four in the extreme standings this week. The Cotton speculator level is at a 85.7 percent score of its 3-year range.
The six-week trend for the speculator strength score totaled a change of 68.4 this week. The overall speculator position was 102,305 net contracts this week with a rise of 7,212 contracts in the speculator bets.
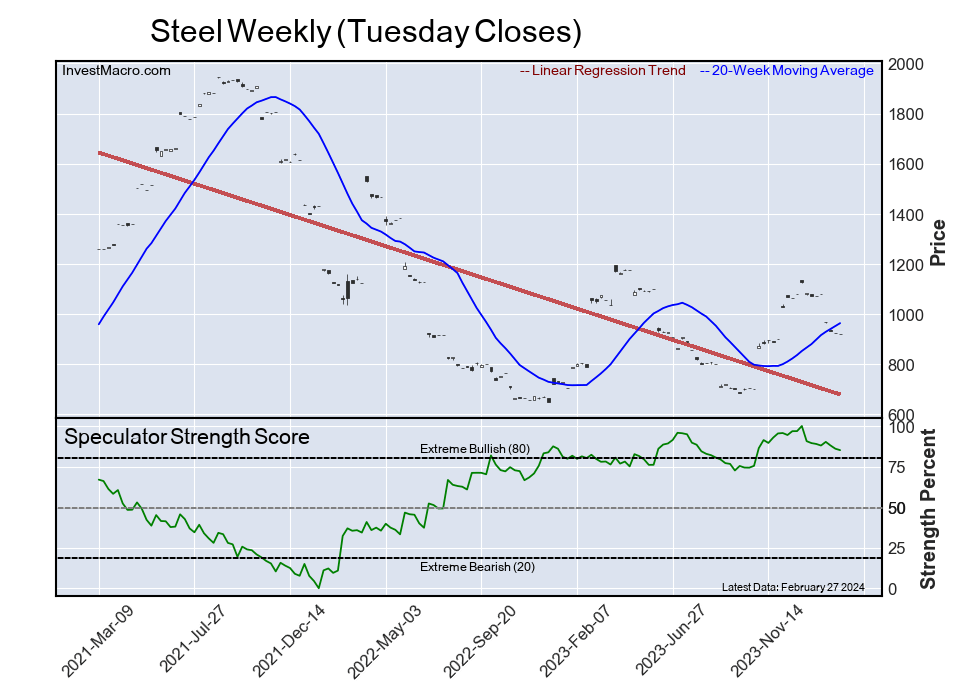
Steel
The Steel speculator position rounds out the top five in this week’s bullish extreme standings. The Steel speculator level sits at a 85.1 percent score of its 3-year range. The six-week trend for the speculator strength score was -4.4 this week.
The speculator position was -2,935 net contracts this week with a loss of -234 contracts in the weekly speculator bets.
This Week’s Most Bearish Speculator Positions:
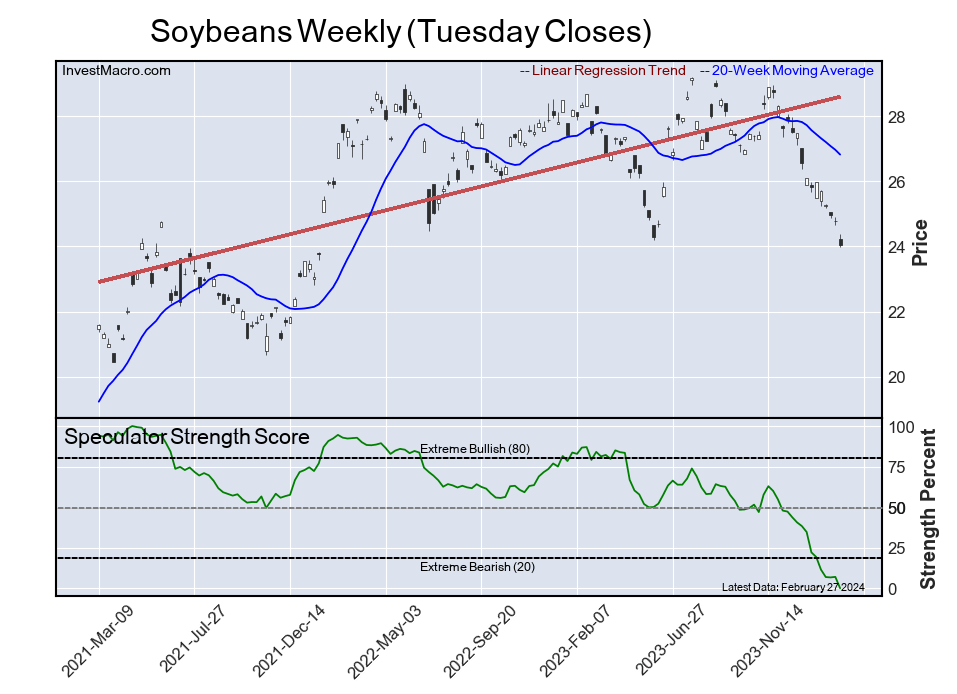
Soybeans
The Soybeans speculator position comes in as the most bearish extreme standing this week. The Soybeans speculator level is at a 0.0 percent score of its 3-year range.
The six-week trend for the speculator strength score was -22.1 this week. The overall speculator position was -191,232 net contracts this week with a drop of -30,944 contracts in the speculator bets.
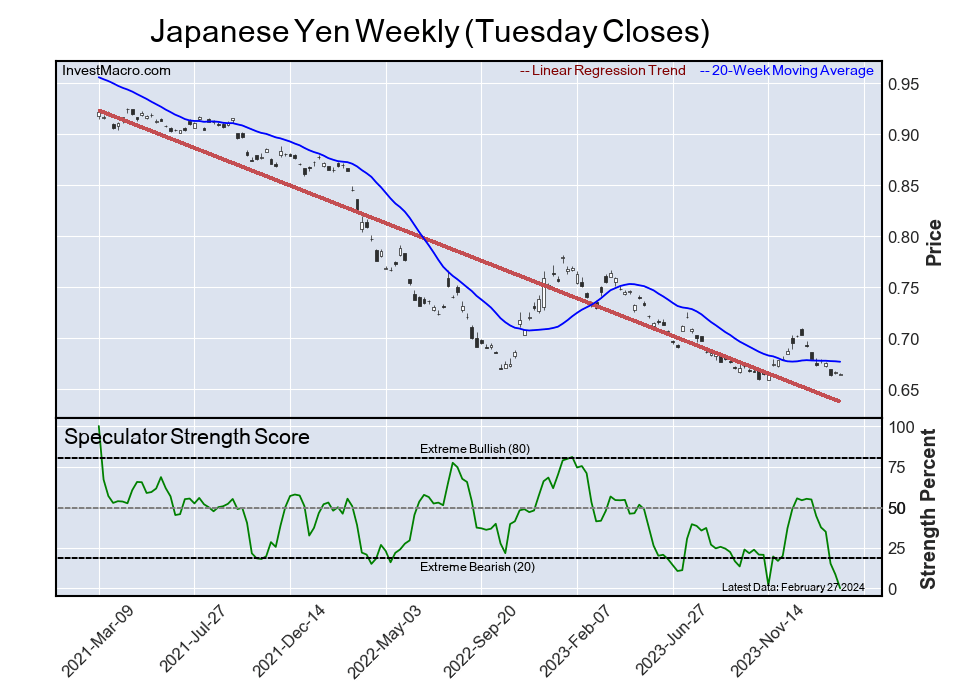
Japanese Yen
The Japanese Yen speculator position comes in next for the most bearish extreme standing on the week. The Japanese Yen speculator level is at a 0.0 percent score of its 3-year range.
The six-week trend for the speculator strength score was -54.7 this week. The speculator position was -132,705 net contracts this week with a decline of -11,927 contracts in the weekly speculator bets.
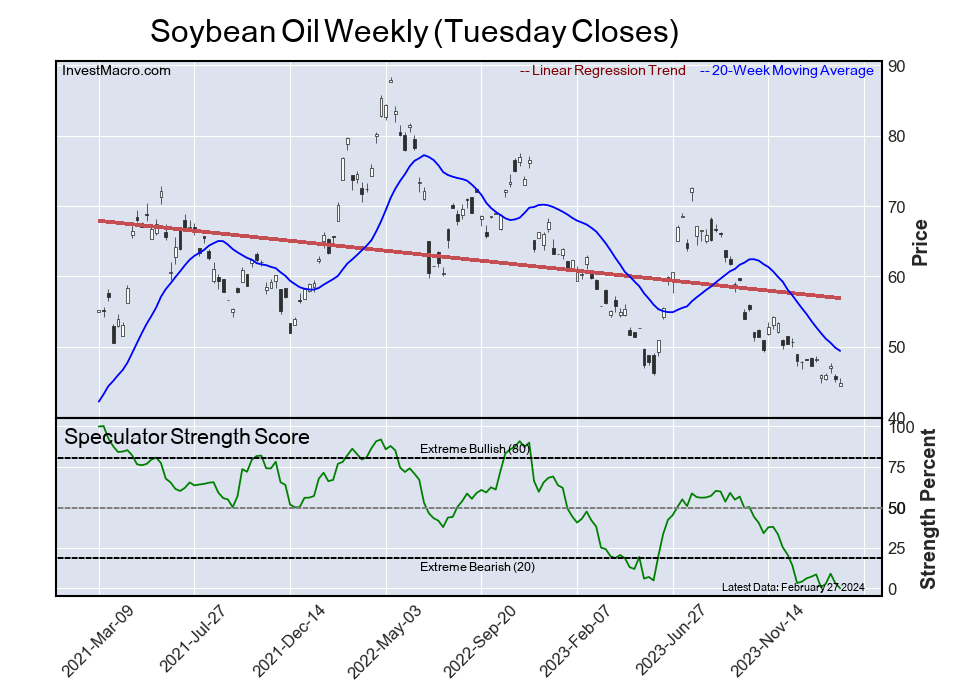
Soybean Oil
The Soybean Oil speculator position comes in as third most bearish extreme standing of the week. The Soybean Oil speculator level resides at a 0.0 percent score of its 3-year range.
The six-week trend for the speculator strength score was -7.1 this week. The overall speculator position was -38,926 net contracts this week with a decrease by -4,985 contracts in the speculator bets.
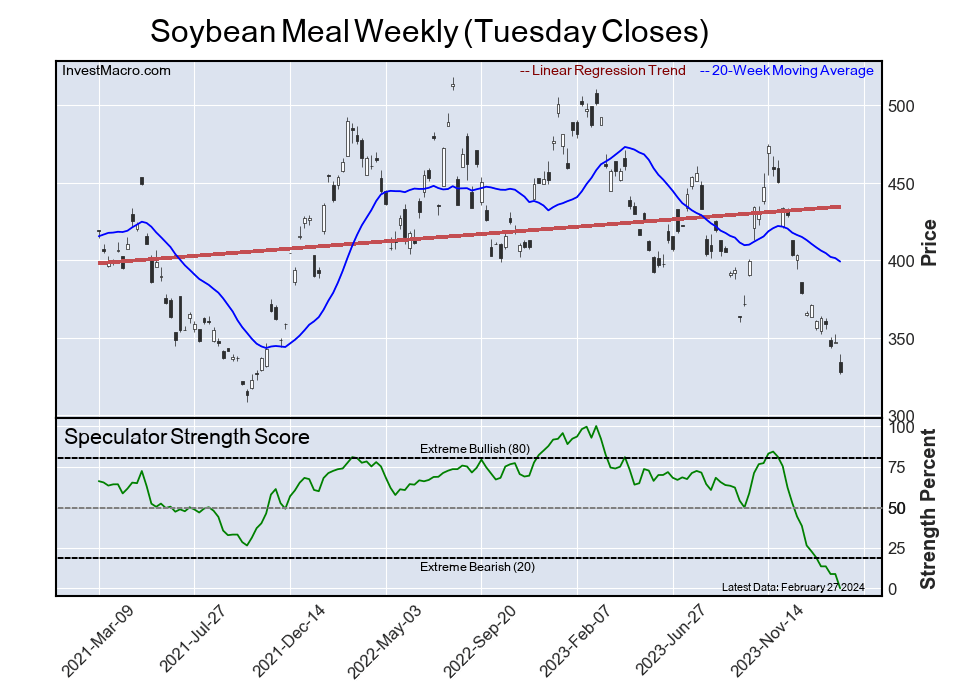
Soybean Meal
The Soybean Meal speculator position comes in as this week’s fourth most bearish extreme standing. The Soybean Meal speculator level is at a 0.0 percent score of its 3-year range.
The six-week trend for the speculator strength score was -22.8 this week. The speculator position was -66,820 net contracts this week with a drop of -21,367 contracts in the weekly speculator bets.
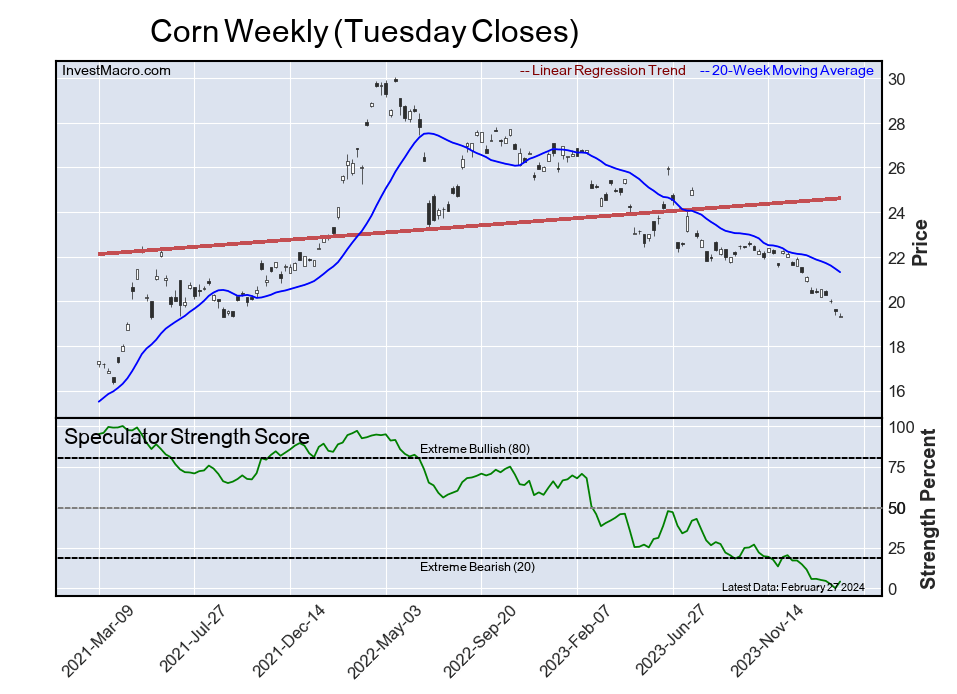
Corn
Finally, the Corn speculator position comes in as the fifth most bearish extreme standing for this week. The Corn speculator level is at a 4.1 percent score of its 3-year range.
The six-week trend for the speculator strength score was -1.6 this week. The speculator position was -232,604 net contracts this week with a boost by 33,463 contracts in the weekly speculator bets.
Article By InvestMacro – Receive our weekly COT Newsletter
*COT Report: The COT data, released weekly to the public each Friday, is updated through the most recent Tuesday (data is 3 days old) and shows a quick view of how large speculators or non-commercials (for-profit traders) were positioned in the futures markets.
The CFTC categorizes trader positions according to commercial hedgers (traders who use futures contracts for hedging as part of the business), non-commercials (large traders who speculate to realize trading profits) and nonreportable traders (usually small traders/speculators) as well as their open interest (contracts open in the market at time of reporting). See CFTC criteria here.
Back in early 2021, the meme stock craze was going strong.
As you’ll recall that craze was all over the news and revolved around favorite stocks promoted by largely novice traders via social media. This January 27, 2021 New York Times news item sums up the frenzy surrounding one of those stocks:
‘Dumb Money’ Is on GameStop, and It’s Beating Wall Street at Its Own Game
GameStop shares have soared 1,700 percent as millions of small investors, egged on by social media, employ a classic Wall Street tactic to put the squeeze — on Wall Street.
A few days later, after GameStop shares had fallen hard, the February 2021 Elliott Wave Financial Forecast, a monthly publication which provides analysis of major U.S. financial markets, offered this warning:
Every major peak gets cinematic treatment and the current one is no exception. … The Wall Street Journal reported, “Netflix, MGM Race to Produce Projects About GameStop Saga.”
After that big decline in Gamestop shares in late January and early February 2021, the share price did bounce back, but has since fallen dramatically. Even so, some traders are not fazed, which is testimony to the high degree of overall optimism toward financial markets.
The recently published February Elliott Wave Financial Forecast provides an update with this chart and commentary:
The sustained public tolerance for falling prices is well illustrated by the resilience of retail demand for GameStop shares. GME is down 88% from its intraday high of $120.75 on January 28, 2021. But the faith in GME as a vehicle for wealth continues. … On January 22, TheStreet’s “meme maven” columnist added a host of “Reasons to Buy GameStop.” There’s just no quenching the demand for GME shares.
Again, this speaks to the high degree of optimism toward the market as a whole and our latest analysis of the main U.S. stock indexes is something you need to see for yourself.
As you might imagine, the main way Elliott Wave International analyzes financial markets is by employing the Elliott wave model.
If you’d like to learn the details of the Wave Principle, read Frost & Prechter’s definitive text on the subject, Elliott Wave Principle: Key to Market Behavior. Here’s a quote from this Wall Street classic book:
In the 1930s, Ralph Nelson Elliott discovered that stock market prices trend and reverse in recognizable patterns. The patterns he discerned are repetitive in form but not necessarily in time or amplitude. Elliott isolated five such patterns, or “waves,” that recur in market price data. He named, defined and illustrated these patterns and their variations. He then described how they link together to form larger versions of themselves, how they in turn link to form the same patterns of the next larger size, and so on, producing a structured progression. He called this phenomenon The Wave Principle.
Would you like to read the entire book for free?
All that’s required for free access to the online version of the book is a Club EWI membership. Club EWI is the world’s largest Elliott wave educational community and is free to join. Members enjoy complimentary access to a wealth of Elliott wave insights regarding financial markets, investing and trading.
This article was syndicated by Elliott Wave International and was originally published under the headline GameStop (GME): 88% Shellacking Yet No Lesson Learned. EWI is the world’s largest market forecasting firm. Its staff of full-time analysts led by Chartered Market Technician Robert Prechter provides 24-hour-a-day market analysis to institutional and private investors around the world.
On Thursday, stock indices posted moderate gains on signs that inflationary pressures continue to ease. The Dow Jones Index (US30) was up 0.52% at yesterday’s stock market close. The S&P 500 Index (US500) added 0.12%. The NASDAQ Technology Index (US100) closed the day positively by 0.90%. In addition, other Fed-friendly reports on Thursday on weekly jobless claims, January MNI Chicago PMI, and January home sales data lowered bond yields and supported equities.
The US core PCE deflator for January declined to 2.8% y/y from 2.9% y/y in December, which matched expectations and was the slowest rate of increase in 2 years. US weekly initial jobless claims rose by 13,000 to 215,000, indicating a weak labor market vs. expectations of 210,000. US personal spending in January rose by 0.2% m/m, matching expectations. Personal income for January increased by 1.0% m/m, which was stronger than expectations of 0.4% mom and the largest increase in a year. Chicago PMI for February unexpectedly declined 2.0 to 44.0, which was weaker than expectations for a rise to 48.0 and the sharpest rate of contraction in 7 months. January US home sales unexpectedly fell by 4.9% m/m, which was weaker than expectations for a 1.5% m/m increase and was the steepest decline in the last 5 months.
Atlanta Fed President Bostic said yesterday that if inflation continues to decline as he expects, it will probably be appropriate for the Fed to start easing rates this summer. Currently, markets are pricing in a 25 bps chance of a rate cut of 3% at the March 19-20 FOMC meeting and 21% at the next meeting on April 30-May 1.
Shares of chip companies rose on Thursday after Citigroup said it remains optimistic about semiconductor stocks given solid demand. The artificial intelligence market continues to grow as businesses and organizations actively buy chips for artificial intelligence.
Salesforce (CRM) stock is up more than 3%, leading the Dow Jones Industrials (US30) higher after Raymond James raised its price target on the shares from $300 to $380. HP Inc (HPQ) closed down more than 1% after reporting first-quarter net revenue of $13.19 billion, weaker than the consensus forecast of $13.58 billion.
The Bank of Canada is forecast to cut the overnight interest rate in June. The timing roughly coincides with when the US Federal Reserve and the European Central Bank will cut their first interest rate.
Equity markets in Europe traded yesterday without a single dynamic. The German DAX (DE40) rose by 0.44%, the French CAC 40 (FR40) fell by 0.34% yesterday, the Spanish IBEX 35 (ES35) lost 0.67%, and the British FTSE 100 (UK100) closed positive 0.07%.
German retail sales for January unexpectedly fell by 0.4% m/m, weaker than expectations of 0.5% m/m. German unemployment for February rose by 11,000, showing a weaker labor market than expected 5,000. The unemployment rate for February was unchanged at 5.9%, weaker than expectations of 5.8%. The German Consumer Price Index (EU harmonized) for February declined to 2.7% y/y from 3.1% y/y in January, which was in line with expectations.
ECB Governing Council spokesman Holzmann said yesterday that he sees no significant negotiations on lowering borrowing costs before the ECB’s June meeting. Swaps are pricing in a 25 bps chance of a 25 bps ECB rate cut to 5% at the next meeting on March 7 and 22% at the April 11 meeting.
Crude oil prices rose on Thursday on expectations that OPEC+ will extend next week’s oil production cuts by about 2 million bpd beyond March. In addition, ongoing attacks by Houthi rebels on commercial ships in the Red Sea have disrupted Middle Eastern oil supplies and bolstered US physical oil markets as foreign buyers turn to US crude supplies to avoid transportation problems.
Natural gas prices increased on Thursday after the EIA’s weekly natural gas inventories fell by 96 billion cubic feet, more than the expected 85 billion cubic feet.
Asian markets were mostly up yesterday. Japan’s Nikkei 225 (JP225) gained 0.87%, China’s FTSE China A50 (CHA50) was up 0.70% on Thursday, Hong Kong’s Hang Seng (HK50) was down 0.29% on the day, and Australia’s ASX 200 (AU200) was positive 0.96% on the day. Most Asian stocks extended gains on Friday, following strong overnight gains on Wall Street, with Japanese and Australian markets hitting record highs amid growing hopes of an interest rate cut in 2024. Chinese stocks also rose slightly, even as purchasing managers’ index (PMI) data showed that business activity in China remained sluggish in February. China’s manufacturing sector contracted for the fifth consecutive month, dragging down overall business activity, even though a rise in consumer spending during the New Year holiday period helped non-manufacturing businesses.
Yesterday, Bank of Japan (BoJ) board official Takata said the 2% price target is finally approaching, reinforcing expectations that the Bank of Japan will end its negative interest rate campaign. But earlier today, BoJ Governor Kazuo Ueda said it was too early to conclude that inflation was close to sustainably reaching the 2% inflation target and emphasized the need to scrutinize more data on the wage outlook. The divergent views underscore the difficulties within the Bank.
S&P 500 (US500) 5,096.27 +26.51 (+0.52%)
Dow Jones (US30) 38,996.39 +47.37 (+0.12%)
DAX (DE40) 17,678.19 +76.97 (+0.44%)
FTSE 100 (UK100) 7,630.02 +5.04 (+0.07%)
USD Index 104.12 +0.17 (+0.16%)
Important events today:
– Japan Unemployment Rate (m/m) at 01:30 (GMT+2);
– New Zealand RBNZ Gov Orr Speaks at 02:05 (GMT+2);
– Japan Manufacturing PMI (m/m) at 02:30 (GMT+2);
– US FOMC Member Williams Speaks at 03:10 (GMT+2);
– China Manufacturing PMI (m/m) at 03:30 (GMT+2);
– China Non-Manufacturing PMI (m/m) at 03:30 (GMT+2);
– Switzerland Retail Sales (m/m) at 09:30 (GMT+2);
– Switzerland Manufacturing PMI (m/m) at 10:30 (GMT+2);
– German Manufacturing PMI (m/m) at 10:55 (GMT+2);
– Eurozone Manufacturing PMI (m/m) at 11:00 (GMT+2);
– UK Manufacturing PMI (m/m) at 11:30 (GMT+2);
– Eurozone Flash Consumer Price Index (m/m) at 12:00 (GMT+2);
– Canada Manufacturing PMI (m/m) at 16:45 (GMT+2);
– US ISM Manufacturing PMI (m/m) at 17:00 (GMT+2);
– US Michigan Consumer Sentiment (m/m) at 17:00 (GMT+2);
This article reflects a personal opinion and should not be interpreted as an investment advice, and/or offer, and/or a persistent request for carrying out financial transactions, and/or a guarantee, and/or a forecast of future events.
The extraordinary list of high-risk events could inject markets with fresh volatility in the week ahead!
Investors will be dished out a platter of top-tier data, complemented with key central bank decisions and major political developments across the world:
Monday, 4th March
CHF: SNB publishes 2023 results
USD: Philadelphia Fed President Patrick Harker speech
Tuesday, 5th March
CNH: China National People’s Congress
EUR: Eurozone S&P Global Services PMI, PPI
GBP: UK S&P Global Services PMI
USD: US ISM services, S&P Global Services PMI
Super Tuesday in the United States
Wednesday, 6th March
EUR: Eurozone retail sales
GBP: UK Chancellor presents annual budget
CAD: BoC rate decision
USD: Fed Chair Jerome Powell testimony, Fed Beige Book
Thursday, 7th March
CNH: China trade, forex reserves
EUR: ECB rate decision
USD: Fed Chair Jerome Powell testimony
US President Joe Biden State of Union address
Friday, 8th March
CAD: Canada unemployment
EUR: Eurozone GDP, Germany industrial production
USD: US February nonfarm payrolls (NFP)
Our focus falls on the US30, which tracks the benchmark Dow Jones Industrial average index – featuring 30 industry leaders in the US economy.
The US30 ended February over 2% higher, bagging its fourth consecutive months of gains thanks to technical and fundamental forces.
Fun fact: The Dow Jones is one of the oldest U.S. indexes, having been created in 1896.
Given how prices are hovering near record highs, the question is whether bulls can keep up the momentum – especially with the 40,000 milestone just a stone’s throw away.
Here are 3 factors that could impact the index:
Fed Chair Powell’s 2-day Testimony
Fed Chair Jerome Powell’s semi-annual testimony before Congress may offer investors crucial insight into future policy moves. Powell is expected to signal that the Fed is not in a rush to cut interest rates until inflation moves closer to the 2% target. It is worth keeping in mind that the US30 which tracks 30 of the largest US companies, remains influenced by Fed rate expectations.
If Powell strikes a hawkish note and signals that US rates will remain higher for longer, this may weigh on the US30 – inviting bears back into the scene.
Should the Fed Chair sound more dovish than expected and signal that rate cuts could be around the corner, this may push the index higher.
US February NFP report
The US economy is expected to have created 190k jobs in February, a noticeable drop from the blowout 353k jobs added in January. However, this is still above Jerome Powell’s estimated neutral pace of 100k. The unemployment rate is forecast to remain unchanged at 3.7% while average hourly earnings are seen ticking lower to 0.3% month-on-month, down from 0.6% in the prior period.
Note: before the US jobs report on Friday, watch out for other key US data releases earlier in the week and speeches by Fed officials.
Traders are currently pricing in a 90% probability of a 25-basis point cut by June 2024, according to Fed Funds futures.
The US30 is likely to trade lower if a strong US jobs report supports the case around the Fed keeping interest rates higher for longer.
Should the NFP report disappoint, this could reinforce bets around the Fed cutting rates sooner than expected – boosting the US30 as a result.
Technical forces
The US30 remains in an uptrend on the daily charts as there have been consistently higher highs and higher lows. Prices are trading above the 50, 100 and 200-day SMA while the MACD trade above zero. However, the Relative Strength Index is not far away from overbought territory with some signs of exhaustion below the 39300 level.
A solid breakout and daily close above 39300 may open a path towards fresh all-time highs with the next psychological level at 40000.
Should 39300 prove to be reliable resistance, this could trigger a decline back towards 38500 and the 50-day SMA at 38170.
The excitement of auto racing comes from split-second decisions and daring passes by fearless drivers. Imagine that scene, but without the driver – the car alone, guided by the invisible hand of artificial intelligence. Can the rush of racing unfold without a driver steering the course? It turns out that it can.
Enter autonomous racing, a field that’s not just about high-speed competition but also pushing the boundaries of what autonomous vehicles can achieve and improving their safety.
Over a century ago, at the dawn of automobiles, as society shifted from horse-drawn to motor-powered vehicles, there was public doubt about the safety and reliability of the new technology. Motorsport racing was organized to showcase the technological performance and safety of these horseless carriages. Similarly, autonomous racing is the modern arena to prove the reliability of autonomous vehicle technology as driverless cars begin to hit the streets.
Autonomous racing’s high-speed trials mirror the real-world challenges that autonomous vehicles face on streets: adjusting to unexpected changes and reacting in fractions of a second. Mastering these challenges on the track, where speeds are higher and reaction times shorter, leads to safer autonomous vehicles on the road.
Autonomous race cars pass, or ‘overtake,’ others on the Las Vegas Motor Speedway track.
I am a computer science professor who studies artificial intelligence, robotics and autonomous vehicles, and I lead the Cavalier Autonomous Racing team at the University of Virginia. The team competes in the Indy Autonomous Challenge, a global contest where universities pit fully autonomous Indy race cars against each other. Since its 2021 inception, the event has drawn top international teams to prestigious circuits like the Indianapolis Motor Speedway. The field, marked by both rivalry and teamwork, shows that collective problem-solving drives advances in autonomous vehicle safety.
At the Indy Autonomous Challenge passing competition held at the 2024 Consumer Electronics Show in Las Vegas in January 2024, our Cavalier team clinched second place and hit speeds of 143 mph (230 kilometers per hour) while autonomously overtaking another race car, affirming its status as a leading American team. TUM Autonomous Motorsport from the Technical University of Munich won the event.
An autonomous race car built by the Technical University of Munich prepares to pass the University of Virginia’s entrant. Cavalier Autonomous Racing, University of Virginia, CC BY-ND
Pint-size beginnings
The field of autonomous racing didn’t begin with race cars on professional race tracks but with miniature cars at robotics conferences. In 2015, my colleagues and I engineered a 1/10 scale autonomous race car. We transformed a remote-controlled car into a small but powerful research and educational tool, which I named F1tenth, playing on the name of the traditional Formula One, or F1, race car. The F1tenth platform is now used by over 70 institutions worldwide to construct their miniaturized autonomous racers.
The F1tenth Autonomous Racing Grand Prix is now a marquee event at robotics conferences where teams from across the planet gather, each wielding vehicles that are identical in hardware and sensors, to engage in what is essentially an intense “battle of algorithms.” Victory on the track is claimed not by raw power but by the advanced AI algorithms’ control of the cars.
These race cars are small, but the challenges to autonomous driving are sizable.
F1tenth has also emerged as an engaging and accessible gateway for students to delve into robotics research. Over the years, I’ve reached thousands of students via my courses and online lecture series, which explains the process of how to build, drive and autonomously race these vehicles.
Getting real
Today, the scope of our research has expanded significantly, advancing from small-scale models to actual autonomous Indy cars that compete at speeds of upward of 150 mph (241 kph), executing complex overtaking maneuvers with other autonomous vehicles on the racetrack. The cars are built on a modified version of the Indy NXT chassis and are outfitted with sensors and controllers to allow autonomous driving. Indy NXT race cars are used in professional racing and are slightly smaller versions of the Indy cars made famous by the Indianapolis 500.
The Cavalier Autonomous Racing team stands behind their driverless race car. Cavalier Autonomous Racing, University of Virginia, CC BY-ND
The gritty reality of racing these advanced machines on real racetracks pushes the boundaries of what autonomous vehicles can do. Autonomous racing takes the challenges of robotics and AI to new levels, requiring researchers to refine our understanding of how machines perceive their environment, make safe decisions and control complex maneuvers at a high speed where traditional methods begin to falter.
Precision is critical, and the margin for error in steering and acceleration is razor-thin, requiring a sophisticated grasp and exact mathematical description of the car’s movement, aerodynamics and drivetrain system. In addition, autonomous racing researchers create algorithms that use data from cameras, radar and lidar, which is like radar but with lasers instead of radio waves, to steer around competitors and safely navigate the high-speed and unpredictable racing environment.
My team has shared the world’s first open dataset for autonomous racing, inviting researchers everywhere to join in refining the algorithms that could help define the future of autonomous vehicles.
The data from the competitions is available for other researchers to use.
Crucible for autonomous vehicles
More than just a technological showcase, autonomous racing is a critical research frontier. When autonomous systems can reliably function in these extreme conditions, they inherently possess a buffer when operating in the ordinary conditions of street traffic.
Autonomous racing is a testbed where competition spurs innovation, collaboration fosters growth, and AI-controlled cars racing to the finish line chart a course toward safer autonomous vehicles.
Artificial intelligence (AI) and digital wallet provider firm Fobi AI Inc. announced it is one of ten companies picked from 1,500 applicants for the Comcast NBCUniversal SportsTech Accelerator program. Find out why one technical analyst says this company’s stock is about to break out into a bull market.
The six-month program gives company officials opportunities to collaborate with leading sports brands like NBC Sports, NASCAR, the Premier League, the PGA Tour, Sky Sports, Comcast Spectator, and U.S. Olympic sports organizations, Fobi AI said.
Since it started in 2021, alumni of the SportsTech program have achieved 132 pilots, partnerships, and commercial deals with consortium partners.
“It’s an extraordinary opportunity for us to not only enhance our visibility but also establish direct connections within the partner network,” Fobi AI Chief Executive Officer Rob Anson said.
Fobi AI leverages AI, automation, and analytics to deliver data-driven, real-time applications to deliver speed, connectivity, and interoperability, according to its investor presentation. With recent acquisitions, the company is expanding its presence in the rapidly expanding digital wallet market dominated by companies like Apple and Google.
“But you certainly wouldn’t think so to look at its stock price and, like it or not, these wallets look set to be the future and to be introduced rapidly,” wrote Technical analyst Clive Maund on February 20.
“But you certainly wouldn’t think so to look at its stock price and, like it or not, these wallets look set to be the future and to be introduced rapidly,” wrote Technical analyst Clive Maund on February 20.
Over the past year, Fobi AI’s share price has decreased 83% from CA$0.51 on Feb. 24, 2023, to CA$0.085 on February 23, 2024.
However, Maund said that based on its one-year arithmetic chart, “factors have been in play for many weeks, suggesting that a breakout into a new bull market is incubating, and, furthermore, that it is likely to happen soon.”
Allowing Co.’s to Align Solutions With Potential Partners
In the SportsTech Accelerator program, the company will work with SportsTech advisors and learn market strategy, commercial business alignment, and adaptive business modeling.
“Every facet of our decision-making process aims to unlock startups that can become ‘scale-ups’ ready to impact the world of sports,” said Jenna Kurath, vice president of startup partnerships and head of Comcast NBCUniversal SportsTech. “The SportsTech program focuses not only on tackling complex business challenges for a vast cross-section of some of the world’s most recognized sports brands, but it additionally prepares founders to build sustainable businesses.”
The program is set to begin March 4 in Florida with behind-the-scenes looks at Universal Studios Florida, NASCAR’s Daytona International Speedway, and coverage of the PGA Tour and other sporting events.
This will allow the companies “to identify how to align their technology solutions to the business and operational needs of partners,” Comcast NBCUniversal noted in a release.
“The capstone of the program will take place at Rally Innovation in Indianapolis on August 27-28, 2024, where this year’s founders will showcase their tech innovations, putting a spotlight on their scale-up traction during the program to garner new business opportunities across the broader sports industry,” the release noted.
The Catalyst: Growth of Sectors Here to Stay
The AI and mobile wallet sectors are here to stay and are expected to be the focus of big growth. The company’s investor presentation said AI will generate US$15 trillion in revenue by 2030 and increase business efficiency by 40%. Four out of five companies say AI is a top priority in their business strategy.
By 2026, about 5.2 billion mobile wallet passes will be in use, it said. About 85% of wallet passes are never deleted (while 71% of apps are), and four out of five customers abandon transactions that require apps.
The continued emergence of digital credential digital wallet solutions is “at the forefront of everything that we hear about today,” Anson said in Fobi AI’s conference call with the media about its earnings in January.
Anson said the company operates in 150 countries and provides more than 100 million digital wallets.
“We’ve seen tremendous growth, not just in, of course, the scale of the product, but obviously now from international support with our acquisitions that we’ve made to date and the addition of some of our international tech resource team,” Anson said.
Last year, the company acquired the leading Spanish digital wallet agency Wallet-Com and the leading European digital wallet company Passwortks SA.
“This agreement with Wallet-Com not only marks Fobi’s fifth wallet pass acquisition but also the strategic acquisition of a leading digital wallet agency that will help reinforce Fobi’s strength and scale as a global wallet pass leader,” Anson said when the Wallet-Com transaction was announced. “This collaboration not only broadens our global footprint but also opens doors to exciting new prospects and innovative opportunities.”
Analyst: ‘Upside Breakout Soon’
The mobile wallet market was valued at about US$7.42 billion in 2022 and is expected to grow at a compound annual growth rate (CAGR) of 28.3% from 2023 to 2022, Grand View Research said in a report.
The COVID-19 pandemic had a positive effect on the market, researchers said.
“The pandemic pushed digital transactions and mobile payments across the world,” the report said. “It has accelerated the growth of the e-commerce industry toward new customers, firms, and types of products. For instance, according to the Census Bureau’s Annual Retail Trade Survey (ARTS), in the U.S., sales in the e-commerce sector surged by 43% or (US$)244.2 billion in 2020, the first year of the pandemic.”
Maund agreed that the AI and mobile wallet industries were huge growth markets. In the company’s one-year chart, the downtrend of Fobi AI’s stock has “morphed into a bullish Falling Wedge,” and downside momentum has eased during that period, he noted.
The third bullish factor is the buildup in upside volume since the end of 2023.
“This quite aggressive and persistent buying has been draining off the supply at these levels at quite a rapid rate, setting the stage for an upside breakout soon,” Maund wrote.
That tilt toward upside volume has also driven the Accumulation line higher, the analyst said.
“These factors together make a strong case for an upside breakout soon,” Maund wrote.
Ownership and Share Structure
According to the company, about 20% is held by insiders, including the CEO Anson, who has 4.35% personally and 15.45% through Fobisuite Technologies Inc. The rest is with retail.
Fobi AI’s market cap is CA$15.9 million, with 176.65 million shares outstanding, and 141.87 million free floating. It trades in a 52-week range of CA$0.58 and CA$0.07.
Important Disclosures:
Fobi AI Inc. has a consulting relationship with an affiliate of Streetwise Reports, and pays a monthly consulting fee between US$8,000 and US$20,000.
As of the date of this article, officers and/or employees of Streetwise Reports LLC (including members of their household) own securities of Fobi AI Inc.
Steve Sobek wrote this article for Streetwise Reports LLC and provides services to Streetwise Reports as an employee.
This article does not constitute investment advice and is not a solicitation for any investment. Streetwise Reports does not render general or specific investment advice and the information on Streetwise Reports should not be considered a recommendation to buy or sell any security. Each reader is encouraged to consult with his or her personal financial adviser and perform their own comprehensive investment research. By opening this page, each reader accepts and agrees to Streetwise Reports’ terms of use and full legal disclaimer. Streetwise Reports does not endorse or recommend the business, products, services or securities of any company.
Author Certification and Compensation: [Clive Maund of clivemaund.com] is being compensated as an independent contractor by Street Smart, an affiliate of Streetwise Reports, for writing this article. Maund received his UK Technical Analysts’ Diploma in 1989. The recommendations and opinions expressed in this content accurately reflect the personal, independent, and objective views of the author regarding any and all of the designated securities discussed. No part of the compensation received by the author was, is, or will be directly or indirectly related to the specific recommendations or views expressed.
Statements and opinions expressed are the opinions of the author and not of Streetwise Reports, Street Smart, or their officers. The author is wholly responsible for the accuracy of the statements. Streetwise Reports requires contributing authors to disclose any shareholdings in, or economic relationships with, companies that they write about. Any disclosures from the author can be found below. Streetwise Reports relies upon the authors to accurately provide this information and Streetwise Reports has no means of verifying its accuracy.
Clivemaund.com Disclosures
The above represents the opinion and analysis of Mr. Maund, based on data available to him, at the time of writing. Mr. Maund’s opinions are his own, and are not a recommendation or an offer to buy or sell securities. As trading and investing in any financial markets may involve serious risk of loss, Mr. Maund recommends that you consult with a qualified investment advisor, one licensed by appropriate regulatory agencies in your legal jurisdiction and do your own due diligence and research when making any kind of a transaction with financial ramifications. Although a qualified and experienced stock market analyst, Clive Maund is not a Registered Securities Advisor. Therefore Mr. Maund’s opinions on the market and stocks can only be construed as a solicitation to buy and sell securities when they are subject to the prior approval and endorsement of a Registered Securities Advisor operating in accordance with the appropriate regulations in your area of jurisdiction.
The US stock indices posted moderate losses on Wednesday. Pressure to liquidate long positions from recent record highs weighed on the stock market ahead of Thursday’s PCE deflator report, the Fed’s preferred inflation gauge. The Dow Jones Index (US30) was down 0.06% at the stock market close yesterday. The S&P 500 Index (US500) lost 0.17%. The NASDAQ Technology Index (US100) closed the day negative 0.55%. On Wednesday, the hawkish comments from Fed members Williams, Bostic, and Collins also hamstrung the indices when they said they favored a wait-and-see stance before cutting interest rates. Markets now expect the US central bank to keep interest rates unchanged in March and May, but there is more than a 50% chance of a rate cut in June.
Wednesday’s Q4 US GDP report was mixed for the dollar, with Q4 GDP revised downward (from 3.3% to 3.2% y-o-y) but still pointing to a robust economy.
The bitcoin exchange rate (BTC/USD) rose more than 6% on Wednesday, hitting a 2-year high following the successful launch of spot bitcoin ETFs in the US. The ETFs have raised more than $6 billion since they began trading on January 11, with some analysts warning of a looming supply shortage as new coins from bitcoin miners fail to keep up with demand. Additional demand has been sparked by the expected April 20 halving of bitcoin issuance. About 80% of the bitcoin supply has not changed hands in the past six months, which could exacerbate the situation and contribute to a further rise in bitcoin prices. Additionally, speculation is growing around the possible approval of spot ETFs, potentially driving higher Ethereum (ETH/USD) prices.
Equity markets in Europe traded flat on Wednesday. Germany’s DAX (DE40) rose by 0.25%, France’s CAC 40 (FR40) gained 0.08% yesterday, Spain’s IBEX 35 (ES35) declined 0.45%, and the UK’s FTSE 100 (UK100) closed negative 0.76%.
On Wednesday, Frankfurt’s DAX (DE40) Index, outperforming European benchmarks on the back of strong corporate earnings, held on to early gains and hit a new record. Puma shares closed by 5% higher after meeting full-year targets and announcing a new brand campaign. Meanwhile, technology stocks came under pressure after Dutch semiconductor equipment maker ASM International reported lower fourth-quarter earnings, sending Infineon down 4% and SAP down 1.5%.
ECB Governing Council representative Kazaks said yesterday that the ECB should not be in a hurry to cut interest rates as there is a risk that tighter measures will be needed later. His colleague, ECB Governing Council representative Kazimir, added that the ECB has no reason to rush interest rate cuts and prefers June as the first rate cut. Swaps estimate the odds of a 25 bps ECB rate cut at 5% at the next meeting on March 7 and 32% at the next meeting on April 11.
The latest EIA report showed a larger-than-expected increase in US crude oil inventories of 4.199 million barrels last week, although much smaller than the 8.428 million reported by the API. The rise in inventories is mainly attributed to a slowdown in processing crude oil into finished products at refineries. Looking ahead, investors are eagerly anticipating the upcoming OPEC+ meeting in March to discuss extending production cuts. Producers will likely stick to voluntary production limits until at least the June ministerial meeting to help stabilize the market. In addition, uncertainty surrounding the ceasefire between Israel and Hamas, as well as ongoing Houthi attacks on ships in the Red Sea, have increased the risk premium in oil prices.
Asian markets were predominantly up yesterday. Japan’s Nikkei 225 (JP225) decreased by 0.08% yesterday, China’s FTSE China A50 (CHA50) was down 0.24% on Wednesday, Hong Kong’s Hang Seng (HK50) fell by 1.51% on the day, and Australia’s ASX 200 (AU200) was negative 0.03% on the day. The Hang Seng Index (HK50) opened higher on Thursday, reversing a decline after removing measures to curb housing demand as part of the 2024 budget, including the complete abolition of housing levies. Wednesday’s GDP report showed the city’s economy grew by 4.3% y/y in Q4 2023, the highest growth in 2 years, on the back of a rebound in inbound tourism and a recovery in private consumption.
Fresh data showed that Australian retail sales rose by 1.1% month-on-month in January 2024, reversing an upwardly revised 2.1% drop in the previous month but falling short of market consensus, which expected a 1.5% rise.
S&P 500 (US500) 5,069.76 −8.42 (−0.17%)
Dow Jones (US30) 38,949.02 −23.39 (−0.06%)
DAX (DE40) 17,601.22 +44.73 (+0.25%)
FTSE 100 (UK100) 7,624.98 −58.04 (−0.76%)
USD Index 103.95 +0.01 (+0.01%)
Important events today:
– Japan Industrial Production (m/m) at 01:50 (GMT+2);
– Japan Retail Sales (m/m) at 01:50 (GMT+2);
–– Australia Retail Sales (m/m) at 02:30 (GMT+2);
– Japan Tokyo Core CPI (m/m) at 07:00 (GMT+2);
– German Retail Sales (m/m) at 09:00 (GMT+2);
– Switzerland KOF Leading Indicators (m/m) at 10:00 (GMT+2);
– Switzerland GDP (q/q) at 10:00 (GMT+2);
– German Unemployment Rate (m/m) at 10:55 (GMT+2);
– German Consumer Price Index (m/m) at 15:00 (GMT+2);
– US Initial Jobless Claims (w/w) at 15:30 (GMT+2);
This article reflects a personal opinion and should not be interpreted as an investment advice, and/or offer, and/or a persistent request for carrying out financial transactions, and/or a guarantee, and/or a forecast of future events.
Michael Ballanger of GGM Advisory Inc. shares his thoughts on current movements in the stock market as well as one gold stock he believes is a Buy.
If Nvidia (NVDA:NASDAQ) is the poster child for “irrational exuberance version-2024,” then the clarion call for “irrational revulsion” must be Newmont Corp. (NEM:NYSE), the largest gold producer in the world that just decided to dump six bottom-tier projects that cost them an arm and a leg over the past decade in an expansion plan that has resulted in the following result:
The reported net loss of $2.5 billion was driven by $1.9 billion in impairment charges, $1.5 billion in reclamation charges, and $464 million in Newcrest transaction and integration costs; these items are excluded from adjusted earnings results.
Their AISC has risen from $1,233/oz. in 2023 to $1,444/oz. while Net Free Cash Flow for a company generating $2.8 billion in revenue was a paltry $88 million. The decision to dump those bottom-tier projects is simple: their institutional shareholders are totally disgusted with the way the company is being run. They say that the brokerage industry is notorious for its “Hire at the top; Fire at the bottom” approach to recruiting.
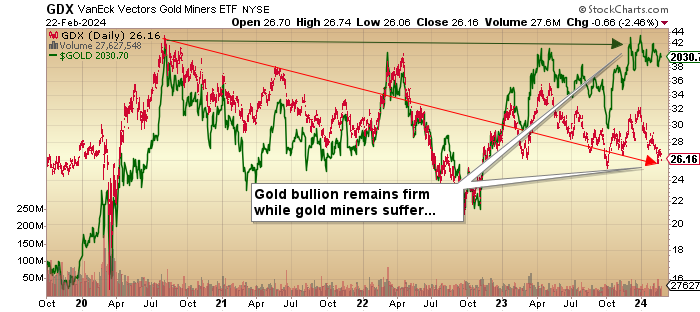
In the gold mining business, every major producer has streamlined operations to reflect better cash management except Newmont. So, with only a pittance of free cash” being generated from that mountain of processed rock, they decide to bring to perfection the “Buy high; Sell low” expansion strategy. It is no wonder that the Senior Gold Miner ETF (GDX:US) is sitting here at within $0.54 of a 52-week low.
Thank you, Newmont.
After over 45 years in the capital markets, most of which were focused on the precious metals exploration and development names, I am constantly amazed that any young person looking to build a portfolio of winners would ever be drawn to the mining industry. Forget the fact that technology is sexier, trendier, and more socially acceptable than climate-threatening resource extraction. Instead, focus on one simple reality: gold miners are lousy investments.
GDX:US topped out in August 2020 along with a gold price that broke the $2,000/oz. barrier for the first time. Since then, gold has been able to stay elevated as central banks and Asian buyers inhale the physical product. However, thanks largely to the overweighted position held in Newmont by the GDX:US ETF, investors seeking the leverage of shares over physical have lost money. You could have bought shares in Tesla Inc. (TSLA:NASDAQ) rather than the GDX:US in August 2020 at $100 and still have a double despite TSLA’s horrid operating performance and 53.7% decline from its 2022 top.
The gold bugs have been talking about the looming upside explosion in gold for years, and they are even more adamant about silver. Eric Sprott was recently saying that “the silver bull will only start at $50!” while Peter Schiff continues to tell Bitcoin holders that they had better dump their crypto and reallocate to gold immediately lest they lose all their money.
In August 2020, when GDX traded at $42, BTC could have been bought at $11,000 per coin. Today, it is over $50,000, with GDX at $26.16. Is it any wonder that the youngsters who run all the money these days avoid the gold miners?
Now, I am a fervent bull on the outlook for gold bullion prices and think that, eventually, silver will follow along. However, in the cold, hard light of day, gold mining companies are not gold bullion. Back before the turn of the century, they were beautiful leverage plays to the gold price, but since the GFC in 2008 and the creation of all forms of surrogate welfare-state programs aimed at protecting the U.S. equity markets, the Pavlovian dinner bell prompted the new wave of youthful stock investors to own anything but the gold miners.
Fed rate cuts coming?
Buy NVidia.
Unemployment figures rising?
Buy Super Micro Computer Inc.
Inflation running “hot”?
Buy Bitcoin and avoid currency debasement.
High-traffic podcast celebrities love to use the old horse chestnut that “I love to buy that which is hated” but investors that have followed that steaming pile of dogma since 2020 and bought into the most-hated asset class — silver stocks followed closely by gold stocks — have been taught a valuable lesson that may have been neglected by these rockstar resource gurus and that is you might want to wait until the “hate meter” goes total “red line” before you let your contrarian investment strategy take you kicking and screaming into the poor house.
Having been a firm believer back in 2020 that soaring debt levels and deficits the world over would send investors piling into gold first and then the miners with the biggest leverage plays being the junior gold developers, I look into the mirror and ask what set of circumstances could be more gold-bullish than where we are today. Fiscal and monetary mayhem, geopolitical unrest, pandemics, shutdowns, and raging inflation have failed to send the kiddies into the gold and silver space.
Copper
Time has proven that tech stocks are a better inflation hedge than anything, and that is not going to change until the markets make it change. Until then, I will focus on the one metal that the kiddies can understand — copper. They understood and bought into the lithium narrative until it no longer worked, but not before taking enormous profits out of the battery metals mania.
Next, they fully grasped the notion that the cleanest replacement for fossil fuels in the expansion of the electrification movement was nuclear power, and the metal driving that mania was (and is) uranium. They have been taking enormous profits out of that frenzy as well. While fundamentals for lithium and uranium are diametrically opposite, uranium demand is going to go vertical as newly constructed reactors go online. The kiddies get that.
However, they have learned that when a sector stops treating them nicely, they bolt. Since the arrival of 2024, the uranium stocks have been correcting, with Cameco Corp. (CCO:TSX; CCJ:NYSE) now closing in on bear market territory. That leaves the one metal so critical to the electrification movement — copper — and it is my opinion that this new wave of money managers looking to build upon the massive profits bestowed upon them by avoiding the gold and silver space is going to see the demand-supply dynamic that is estimated by every analyst on the planet to take copper to $6-8/lb. by the end of the decade. Just as the move in lithium from 35,000 CNY/mt to 600,000 CNY/mt made billionaires in 2022, the move in uranium from $20/lb. to $106/lb. made billionaires in 2023. A move in copper from $3.80 to $6-8 will have the same effect on the junior copper stories that similar moves had on the junior lithium and uranium stories.
That is why I am loading the portfolio cannon with copper names, and that will continue until I see fifty tweets an hour talking about $10/lb. copper. Right now, nobody is even glimpsing at copper, and that is why I want to own it.
I do not know whether to melt down in a fit of envy or simply to resign myself to the inconvenient truth that today’s emerging legions of stock investors prefer the finished product to the raw materials when it comes to a microchip that sells for $10,000 that allows a robot to have a semi-lucid conversation with you.
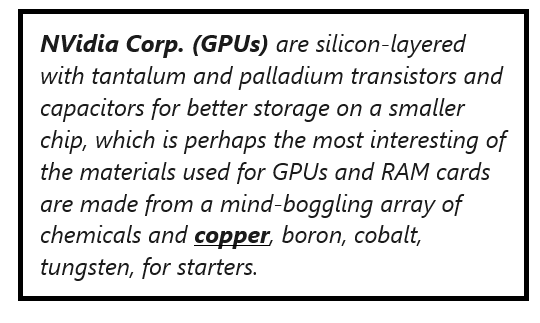
The fact remains that copper remains a critical component of the technology sector whether found in motherboards, the power cords, or the microchips described in the graphic posted to the left.
GLD:US
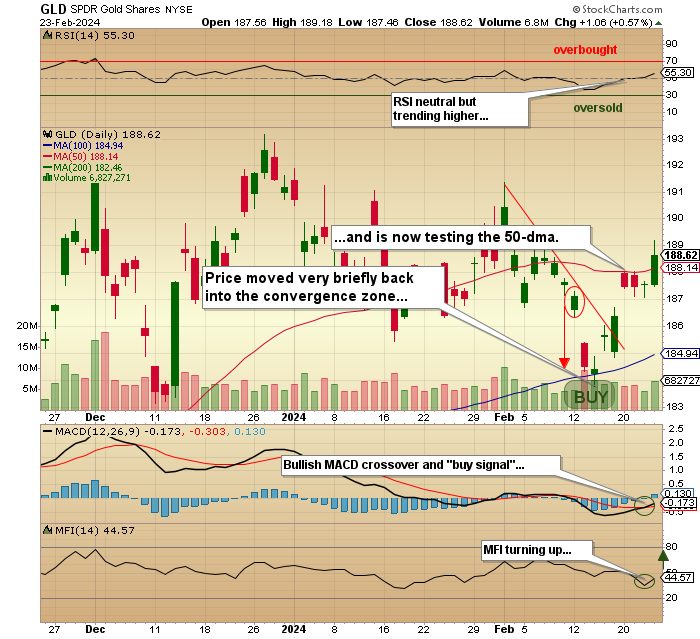
For the past three weeks, I had been drawing reference to those two rising moving averages (100 and 200-dma lines) and how my entry level was going to be in the mid-range of that convergence zone. Well, I got that move on Valentine’s Day, but I was so busy dealing with overpriced “wilty” long stems for my sweetheart that I missed the move.
GLD:US traded beautifully down through the upper boundary of the convergence zone to $183.78 (100-dma was at $184.33) and promptly reversed upward, triggering a textbook MACD “buy signal” and an upturn in the Money Flow Indicator as well. I could have sworn it was waving “bye-bye” at me (while thumbing its nose) as it rocketed northward, closing higher last week and again this week to go out at $188.62 after trading as high as $189.18.
They say that a man has to “pay the price” for love, so I guess I will have to grin and bear it, but I waited for nearly a month to re-establish that position and to have it elude me in favor of domestic harmony is somewhat maddening. Based on my revised entry point for the GLD call options, I figure that a dozen roses cost U.S. $2,300, and while my significant other most certainly is worth the consideration, I may need to learn how to set price alarms on my cell phone to avoid costly mistakes like that in the future.
I wound up taking a 60% position in the GLD June $185 calls under $8 but refrained from adding on Friday as prices took a sizeable leap northward as the Chinese buyers returned to the market after their New Year celebrations. As exasperated as I am with the gold miners, there is nothing wrong whatsoever in the technical set-up for gold bullion. I am adamant that new, all-time, sustainable highs will be seen by the end of Spring and that once the shackles of suppression are broken, the move in gold will drag the miners (and silver) higher. If mean reversion is to be normalized, the amplitude of the move in gold mining stocks will turn more than a few heads.
Cameco Corp.
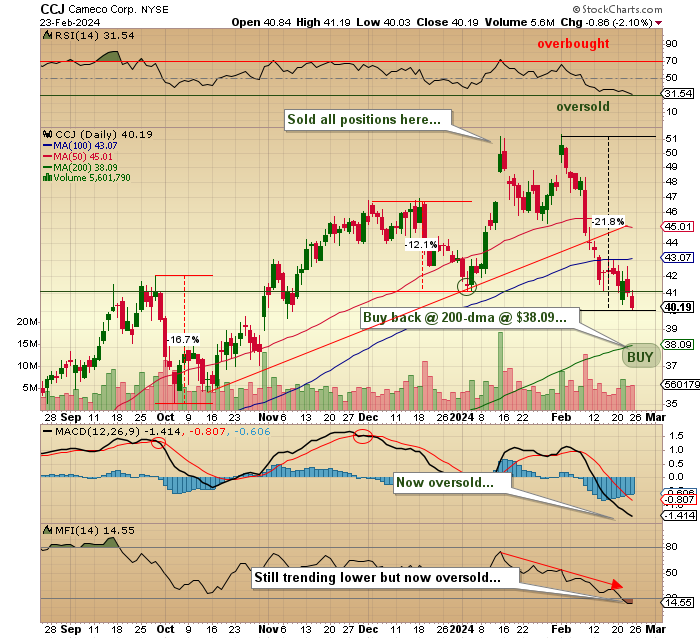
It was on January 12 that I told subscribers that I was liquidating all Cameco Corp. (CCO:TSX; CCJ:NYSE)stock and option holdings as well as a long-term position in Western Uranium & Vanadium Corp. (WUC:CSE; WSTRF:OTCQX)with the former trading above $51 and the later on its way to its 52-week high at CA$2.60.
Hard to imagine but the first purchase I made of WUC shares was in 2017 at $1.70 so it took seven years to finally muster up the courage to exit. Within a few hours of the blogosphere and Twitterverse learning of my decision to exit, my email and Twitter inboxes were inundated with accusatory messages, with the common theme being that I did not “get it,” as in the correct interpretation of the uranium story and why I was going to regret my decision “for the rest of my life.”
One email exchange had the sender reciting the ten reasons that uranium was going to $300/lb. and why CCJ was going to $100. It reminded me of the lithium narrative a year ago going into PDAC 2023 with lithium deals the talk of the town.
Cabbies shuttling conference attendees back and forth between Yorkville and the Metro Convention Centre were reciting the ten reasons why lithium was headed to $1 million per pound and why anyone selling was “an idiot.”
I tried to explain that every single one of those ten reasons contained in the uranium narrative perfectly rationalized the move from under $20 in 2017 to over $100 in 2024. If the average investor is able to recite the reasons why any particular narrative justifies a move, the move is usually over. That is just the reality of how the discounting mechanism works in capital markets.
Now, despite the outrage in the retail community over this much-needed correction, I am no longer a seller of the uranium or lithium names; in fact, I am looking to buy back my position in Cameco Corp. at around the 200-dma at $38.09. since my sell above $51, it has shed over 21% from the all-time high at $51.33, so while it is technically now in bear market territory, I urge the angry young men out there to revisit the ten reasons why uranium trades 400% higher than where it was in 2020.
The CCJ exit was based 100% on sentiment and had nothing to do with the demand-supply equilibrium that is as bullish as I have ever encountered in forty-five years of carving up capital markets. I remain a bear on the lithium space because EV demand is quickly waning, and that spells “glut” in the lithium-ion battery world.
If that structural deficit fails to return before 2028, a great many hard-rock projects are going to be mothballed, and if there is any three-word combination that is universally hated by mining investors, it is “care and maintenance.”
Getchell Gold
One of the biggest challenges of my career was completed successfully last month thanks to the contributions made by Getchell Gold Corp. (GTCH:CSE; GGLDF:OTCQB) shareholders in raising over CA$3.5mm in an extremely difficult funding environment.
When I was in the investment banking world in my past life, I recall some difficult raises that involved actually earning one’s fees, but nothing will ever compare to the difficulty in winning over new investors to a project (Fondaway Canyon, Nevada) that has an inferred and indicated resource of over 2 million ounces of gold, wide open along strike in all directions and to depth.
Map from 2022
This successful financing allowed GTCH to make the final payment of US$1.6 million to Canagold Resources Ltd. and secure 100% ownership of the Fondaway Canyon project. During the last quarter of 2023, in discussions with various investor groups, it became apparent that Getchell was suffering from an image problem.
Having been a shareholder since 2018 and during the acquisition of the project, I could never understand why the prior owners sold it to Getchell because some of the high-grade intercepts (like 25m of 10.4 g/t Au in 2022) were simply spectacular.
However, I found that many of the prospective investors were getting negative feedback from bankers and brokers that Fondaway has either metallurgical issues that prompted many of the prior owners to walk away.
Yesterday, I learned that the actual reason that prior operators declined to advance the project had nothing to do with the drilling results or the metallurgy. Up until last year, there was a zone called the Stillwater “Wilderness Survey Area” (“WSA”) that was actually infringing upon the boundaries of the proposed open pit. In fact, former operators Canagold Resource Corp. completed a 43101-compliant report in April 2017 that makes reference to “possible pit constraints” related to the WSA boundary.
Well, in 2023, the state ruled on the boundary, and it was pushed back by over a kilometer from the proposed pit locations. In other words, the presence of the WSA is no longer an issue. In the past, operators felt that any exploration along strike would infringe upon the WSA so not only did they refrain from engaging in further exploration efforts, they felt that the issue was far too sensitive to engage the legislators. Getchell management did engage, and after the ruling opened up the ground, they moved with laser-like speed to stake the ground required to protect them and thus ensure that it remained wide open along strike and able to model a starter pit on 100%-owned ground.
If one follows the chain of events in the history of Fondaway Canyon dating back to the 1980s, it was never about the geology or the prospective nature of the deposit; it was always about the implications of the WSA on long-term planning. Each operator that owned it engaged in exploration and in limited open-pit mining, but they could never advance it. As for why I missed it is beyond me but if you drill down into the timeline, each prior operator got stymied by the WSA and Getchell was reluctant to broadcast the pending ruling because they did not want to alert competitors to the land being opened up because Getchell wanted to stake it.
Getchell is in the process of completing a metallurgical survey on Fondaway that will be needed in advance of the upcoming PEA and revised resource estimate. The deposit is classified as a “Tier Three Asset,” but at 3 million ounces, it moves to a “Tier Two Asset,” and while majors are inclined to stick with only a “Tier One Asset” (5 million ounces or more), a “Tier Two Asset” could easily attract the interest of a mid-tier suitor. It is estimated that a $5 million budget could move the needle to “Tier Two,” and if that happens with an improved funding environment in 2024, I can see a value-per-ounce threshold of at least $50/ounce.
If gold prices catch the bid that I expect by year-end and see a major break-out above $2,500/oz., that value-per-ounce number will be closer to $100/oz. A “Tier Two Asset” in that environment would be worth $300 million in M&A verbiage. If one assumes that there will be 200 million shares issued by the time the drilling funds are raised and if one further assumes that President Mike Sieb can duplicate the uncanny “hit ratio” demonstrated from 2020 to 2022, the valuation for Getchell will grow to around $1.50 per share. (Last trade was $0.1015.)
Now, the junior gold developers are still mired in the muck of dour sentiment that emanates from the top and resonates right down the gold miner food chain, starting with the NEM fiasco impacting everyone. However, this too shall pass, and when sentiment shifts with the resolution of the gold price revaluation, the leverage contained in the junior developer space will be compelling. It has been a long grind with GTCH, but I see the light at the end of what has been a very long tunnel it is indeed daylight and not the twinkle of quartz halogens barrelling towards us. Getchell Gold is a “Buy.”
Important Disclosures:
As of the date of this article, officers and/or employees of Streetwise Reports LLC (including members of their household) own securities of Cameco Corp., Western Uranium and Vanadium Corp., Getchell Gold Corp.
Michael Ballanger: I, or members of my immediate household or family, own securities of: Nvidia Corp. and Getchell Gold. I determined which companies would be included in this article based on my research and understanding of the sector.
Statements and opinions expressed are the opinions of the author and not of Streetwise Reports, Street Smart, or their officers. The author is wholly responsible for the accuracy of the statements. Streetwise Reports was not paid by the author to publish or syndicate this article. Streetwise Reports requires contributing authors to disclose any shareholdings in, or economic relationships with, companies that they write about. Any disclosures from the author can be found below. Streetwise Reports relies upon the authors to accurately provide this information and Streetwise Reports has no means of verifying its accuracy.
This article does not constitute investment advice and is not a solicitation for any investment. Streetwise Reports does not render general or specific investment advice, and the information on Streetwise Reports should not be considered a recommendation to buy or sell any security. Each reader is encouraged to consult with his or her personal financial adviser and perform their own comprehensive investment research. By opening this page, each reader accepts and agrees to Streetwise Reports’ terms of use and full legal disclaimer. Streetwise Reports does not endorse or recommend the business, products, services, or securities of any company.
This letter makes no guarantee or warranty on the accuracy or completeness of the data provided. Nothing contained herein is intended or shall be deemed to be investment advice, implied or otherwise. This letter represents my views and replicates trades that I am making but nothing more than that. Always consult your registered advisor to assist you with your investments. I accept no liability for any loss arising from the use of the data contained on this letter. Options and junior mining stocks contain a high level of risk that may result in the loss of part or all invested capital and therefore are suitable for experienced and professional investors and traders only. One should be familiar with the risks involved in junior mining and options trading and we recommend consulting a financial adviser if you feel you do not understand the risks involved.
“Should bulls get cold feet below 150.90, this may trigger a selloff towards 149.70 and potentially lower.”
What happened since TP was published?
The USDJPY was trapped within a range with bulls lacking the confidence to breach 150.90.
Hawkish remarks by a BoJ official on Thursday morning boosted the Japanese Yen, triggering a selloff as a result.
How much in potential profits?
Traders who shorted the USDJPY last Friday from the intraday high would have gained 107 pips!
The negative momentum briefly took prices below the 149.70 support with more volatility expected ahead of the US PCE report this afternoon.
2) EURNZD charges through all bullish targets
Where and when was Target Price (TP) published?
As written in our Trade of The Week article on Monday, February 26th:
“A strong breakout above the 50-day SMA at 1.7600 may encourage an incline towards 1.7700 and the 100-day SMA at 1.7760”.
What happened since TP was published?
After kicking off the week on a positive note, the EURNZD exploded higher on Wednesday following the Reserve Bank of New Zealand (RBNZ) dovish pivot.
The currency pair charged through the 50- and 100-day SMA with the momentum taking prices to the 200-day SMA which was 400 pips away from the key 1. 7240 support!
How much in potential profits?
Traders who took advantage of the breakout above 1.7600 would have been rewarded 160 pips.
“XAGUSD bears may look for a close below the 100 Fibonacci level at $22.614 with a retest and breach of $22.565 as a possible sign of a decline to lows below $22.437“
What happened since TP was published?
Silver prices were pressured by a stabilizing dollar and overall bearish price action with the metal shedding roughly 2.5% since the start of the week.
How much in potential profits?
177 points for traders who shorted silver at $22.614 and exited at $22.437.
At the time of writing silver remains under pressure and could be exposed to further volatility ahead of the incoming US PCE report.
Some stock market enthusiasts claim to be able to predict financial market trends with fantastic accuracy.
Despite the complexity of international finance, they assure us that substantial profits are within our reach if we follow their recommendations and imitate their behaviour.
But is it really possible to accurately predict the behaviour of financial markets?
As an expert in the psychology of decision-making who specializes in complexity research, I have had the opportunity to deepen my understanding of human cognition and its capacity to control real-world complex environments. For now, my conclusions are sobering and not simple.
It’s a mistake to assume that financial enthusiasts can predict the uncertain behaviour of markets.
Complex decisions
According to many researchers in decision-making science, understanding and managing complexity is the greatest challenge of the digital age. Complexity refers to the uncertain nature of the environments in which we make decisions every day.
While some of our financial choices may seem simple and self-evident (saving a portion of our income, setting a budget, repaying a debt), the environment in which these choices are made is unpredictable.
The strategies we adopt are certainly not infallible; our knowledge does not guarantee our success, and the effects of each of our decisions are uncertain and unique. This explains why the environments in which we make everyday decisions are actually highly complex. They include many interrelated factors that are constantly changing, with or without our intervention. Not to mention that the objectives we cherish are often themselves contradictory.
For example, how can we maximize investment returns while minimizing exposure to market fluctuations?
Facing financial complexity
Faced with financial complexity, human cognition tends to favour a reductionist approach to information processing, sometimes called “tunneling.” Faced with the overload of information generated by complexity, we tend to concentrate on one or a few specific aspects of a situation rather than all available information because too much information kills information. In other words, we take shortcuts. And guess what? These simplistic ways of thinking can lead to biased decisions.
We often make the mistake of attributing poor performance of our equity portfolio to a single event that stands out in our minds. We mistakenly believe that our investments will grow linearly when, in fact, they are vulnerable to exponential fluctuations caused by crises and unexpected events. We react poorly to unsuccessful investments by focusing on the consequences that could explain our financial difficulties, rather than by deepening our understanding of why the company in which we had blind faith (or the sector in which it operates) is experiencing difficulties.
Finally — and this is human nature — we tend to attribute responsibility for our failures to external factors beyond our control. For example, we might be tempted to blame losses incurred by certain businesses in the tourism sector on poor summer weather conditions. But in doing so, we overlook the importance of the quality of the products and services the businesses offer, or how hospitable their staff are.
And market enthusiasts in all this?
My most recent work supports the literature on complex problem-solving: whether we are experts or novices, understanding and mastering complexity is a daunting challenge.
Many market enthusiasts will demonstrate greater skill in devising an investment strategy, managing a portfolio or accessing certain investments.
However, it is a mistake to assume that they can predict the uncertain behaviour of the markets. The issue is not necessarily financial knowledge, but the natural limitations of human cognition when faced with complexity.
Faced with international finance, there is a “wall of complexity” beyond which it is particularly difficult to progress, and we are all subject to bias and errors.
So, how do we navigate through this?
Despite the many challenges of financial complexity, there is light at the end of the tunnel, provided we know what to do. While there are many studies to be conducted, researchers remain optimistic about specific methods that can already help us make more informed decisions.
1. Learn to think in systems
Systems thinking is a way of perceiving reality that helps us to better understand and work with real-world complex environments.
Whether you want to learn how to manage your budget better or invest wisely in the stock market, get into the habit of drawing visual representations of the financial challenges you want to tackle.
Cause-and-effect diagrams, which use simple symbols (a + sign to show a change in the same direction between two factors, and a – sign to show opposite changes), allow you to quickly illustrate the extent and scope of a problem by representing the relationships between the parts of the same system.
But make no mistake, some factors are difficult to predict.
In short, learn to think about the “consequences of the consequences” of your choices before making any decision.
2. Be bold, tolerate uncertainty
Learn to tolerate situations that, at first sight, have no clear solutions and leave you in doubt.
Financial markets are unpredictable and poorly structured, which creates “wicked problems.”
In these environments, ambiguity is the norm. Embracing uncertainty allows us to translate problems into opportunities, rather than making hasty decisions or locking ourselves into inaction.
There is no single “right solution” to a complex financial problem. Take a moment to evaluate your options.
3. Test your beliefs and biases
Don’t try to research and interpret financial information based on an assumption you hold dear. Confront your preconceived ideas using sources you would not normally consult because they take the opposite position.
What would a friend or colleague whom you like, but who fundamentally disagrees with you, say?
4. Don’t trust what comes easily to mind
Attending an inspiring conference on the sustainable economy or listening attentively to a TV report on financial ethics does not guarantee that the information that comes out of it will be helpful in the decision you have to make.
Although this information may be easier to retrieve from memory, it is not necessarily relevant. Don’t overestimate the likelihood of an event just because you can imagine it in great detail.
Get information from several sources and verify their reliability.
Now what?
One cannot become proficient in any area without putting in the necessary practice. Therefore, it is important for you to personally delve into the world of finance.
Through experience, you will develop your skills to better appreciate complexity. To help you do this, it’s a good idea to seek the assistance of a competent professional to guide you through this highly sophisticated process.
But remember this: when it comes to complexity, you are human, as are those who claim to be able to read the future.


 An autonomous race car built by the Technical University of Munich prepares to pass the University of Virginia’s entrant.