
By InvestMacro
Here are the latest charts and statistics for the Commitment of Traders (COT) data published by the Commodities Futures Trading Commission (CFTC).
The latest COT data is updated through Tuesday January 16th and shows a quick view of how large traders (for-profit speculators and commercial entities) were positioned in the futures markets.
Weekly Speculator Bets fall this week led by Copper & Platinum
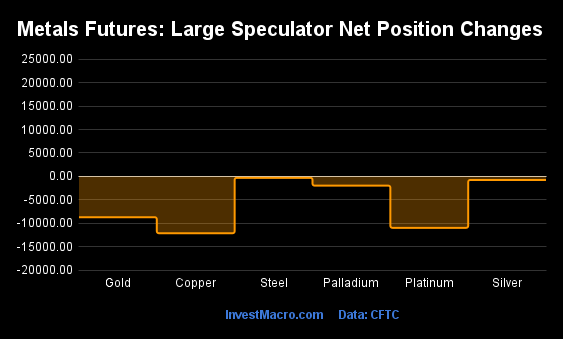
The COT metals markets speculator bets were lower this week as all six metals markets we cover had lower speculator contracts.
Free Reports:
 Sign Up for Our Stock Market Newsletter – Get updated on News, Charts & Rankings of Public Companies when you join our Stocks Newsletter
 Get our Weekly Commitment of Traders Reports - See where the biggest traders (Hedge Funds and Commercial Hedgers) are positioned in the futures markets on a weekly basis.
Leading the declines in speculator bets for the week were Copper (-12,139 contracts), Platinum (-10,984 contracts), Gold (-8,721 contracts), Palladium (-1,977 contracts), Silver (-769 contracts) and with Steel (-316 contracts) also seeing lower bets on the week.
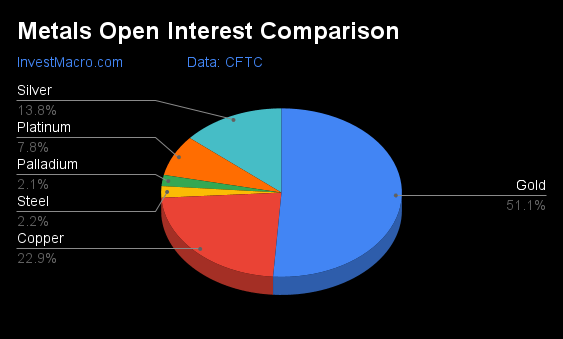
Major Metals – Speculators Leaderboard
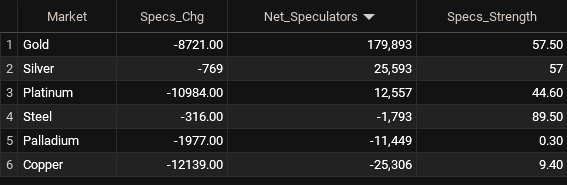
Legend: Weekly Speculators Change | Speculators Current Net Position | Speculators Strength Score compared to last 3-Years (0-100 range)
Strength Scores led by Steel & Gold
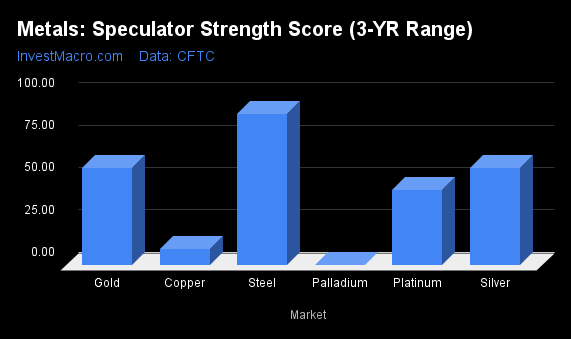
COT Strength Scores (a normalized measure of Speculator positions over a 3-Year range, from 0 to 100 where above 80 is Extreme-Bullish and below 20 is Extreme-Bearish) showed that Steel (89 percent) and Gold (57 percent) lead the metals markets this week. comes in as the next highest in the weekly strength scores.
On the downside, Palladium (0 percent) and Copper (9 percent) come in at the lowest strength levels currently and are in Extreme-Bearish territory (below 20 percent).
Strength Statistics:
Gold (57.5 percent) vs Gold previous week (61.4 percent)
Silver (57.1 percent) vs Silver previous week (58.2 percent)
Copper (9.4 percent) vs Copper previous week (20.3 percent)
Platinum (44.6 percent) vs Platinum previous week (69.9 percent)
Palladium (0.3 percent) vs Palladium previous week (13.9 percent)
Steel (89.5 percent) vs Palladium previous week (90.7 percent)
Platinum & Palladium top the 6-Week Strength Trends
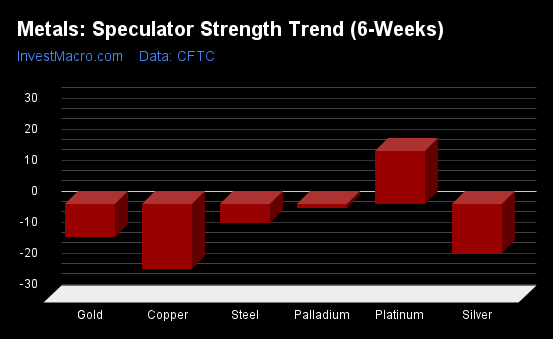
COT Strength Score Trends (or move index, calculates the 6-week changes in strength scores) showed that Platinum (17 percent) and Palladium (-1 percent) lead the past six weeks trends for metals. Silver (-16 percent) is the next highest positive mover in the latest trends data.
Gold (-11 percent) leads the downside trend scores currently with Copper (-21 percent) as the next market with lower trend scores.
Move Statistics:
Gold (-10.6 percent) vs Gold previous week (-5.2 percent)
Silver (-15.9 percent) vs Silver previous week (-11.8 percent)
Copper (-21.0 percent) vs Copper previous week (-8.4 percent)
Platinum (17.1 percent) vs Platinum previous week (31.2 percent)
Palladium (-1.4 percent) vs Palladium previous week (4.8 percent)
Steel (-6.2 percent) vs Steel previous week (-4.7 percent)
Individual Markets:
Gold Comex Futures:
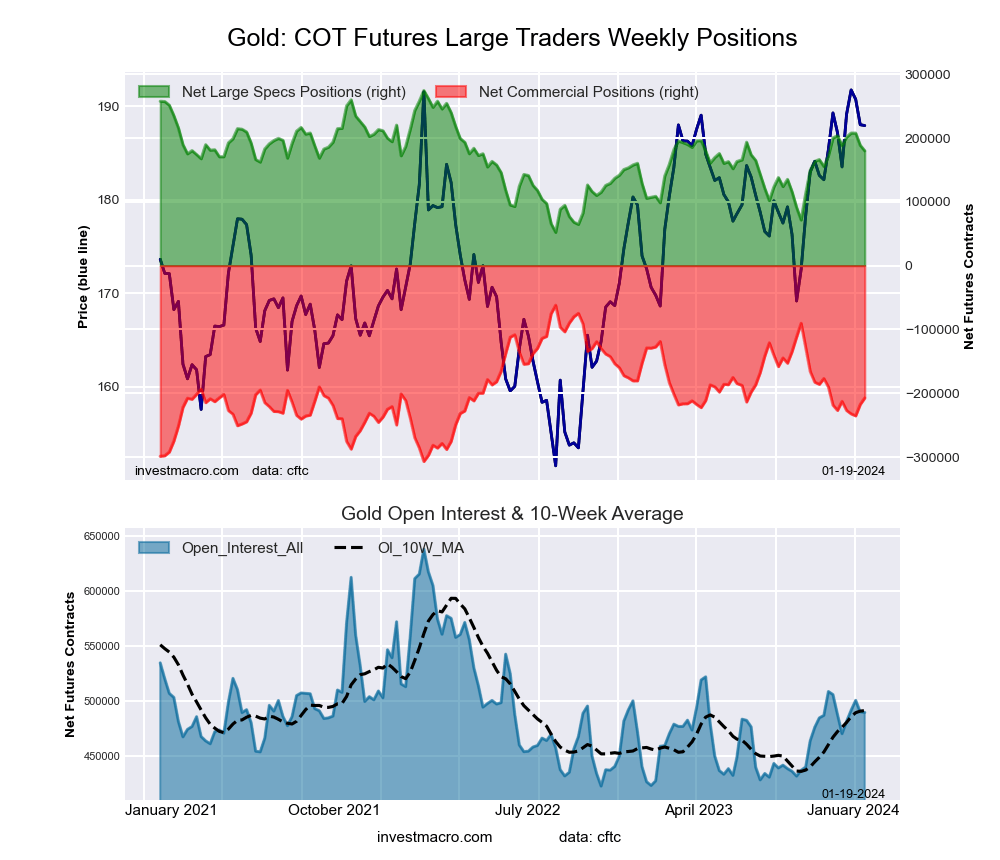 The Gold Comex Futures large speculator standing this week totaled a net position of 179,893 contracts in the data reported through Tuesday. This was a weekly decrease of -8,721 contracts from the previous week which had a total of 188,614 net contracts.
This week’s current strength score (the trader positioning range over the past three years, measured from 0 to 100) shows the speculators are currently Bullish with a score of 57.5 percent. The commercials are Bearish with a score of 40.7 percent and the small traders (not shown in chart) are Bullish with a score of 58.4 percent.
Price Trend-Following Model: Uptrend
Our weekly trend-following model classifies the current market price position as: Uptrend. The current action for the model is considered to be: Hold – Maintain Long Position.
| Gold Futures Statistics | SPECULATORS | COMMERCIALS | SMALL TRADERS |
| – Percent of Open Interest Longs: | 53.6 | 22.3 | 10.1 |
| – Percent of Open Interest Shorts: | 16.9 | 64.7 | 4.5 |
| – Net Position: | 179,893 | -207,420 | 27,527 |
| – Gross Longs: | 262,360 | 109,287 | 49,640 |
| – Gross Shorts: | 82,467 | 316,707 | 22,113 |
| – Long to Short Ratio: | 3.2 to 1 | 0.3 to 1 | 2.2 to 1 |
| NET POSITION TREND: | |||
| – Strength Index Score (3 Year Range Pct): | 57.5 | 40.7 | 58.4 |
| – Strength Index Reading (3 Year Range): | Bullish | Bearish | Bullish |
| NET POSITION MOVEMENT INDEX: | |||
| – 6-Week Change in Strength Index: | -10.6 | 8.0 | 12.4 |
Silver Comex Futures:
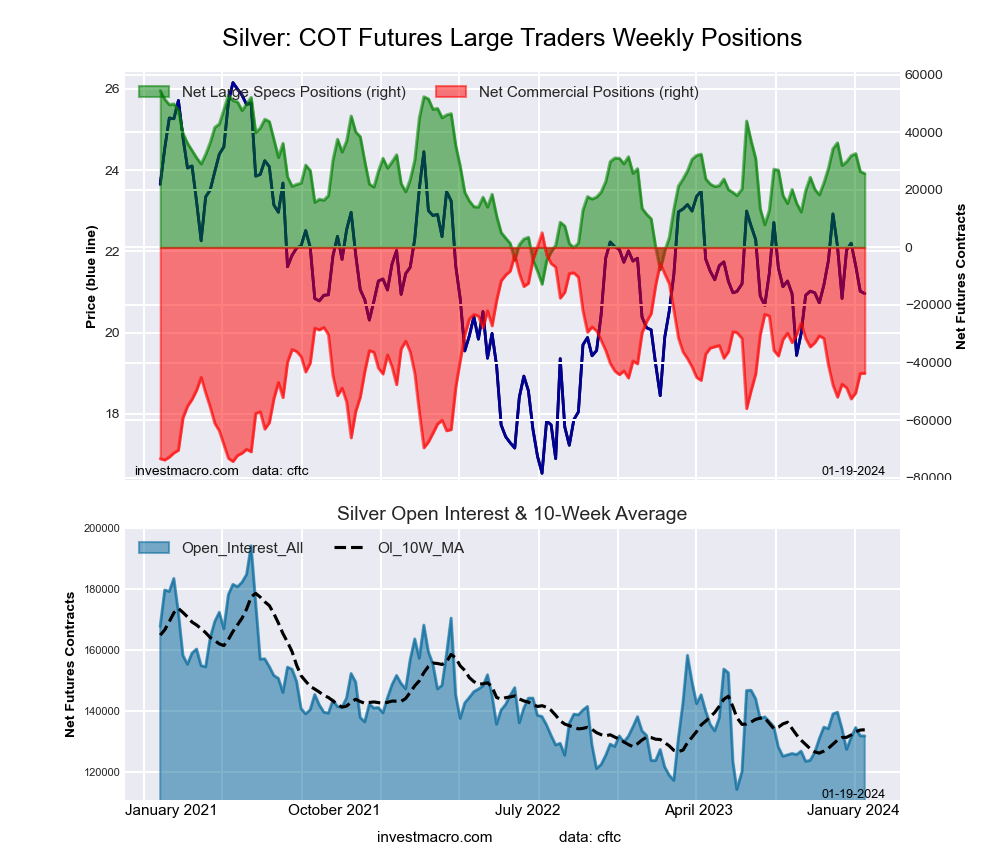 The Silver Comex Futures large speculator standing this week totaled a net position of 25,593 contracts in the data reported through Tuesday. This was a weekly fall of -769 contracts from the previous week which had a total of 26,362 net contracts.
This week’s current strength score (the trader positioning range over the past three years, measured from 0 to 100) shows the speculators are currently Bullish with a score of 57.1 percent. The commercials are Bearish with a score of 38.5 percent and the small traders (not shown in chart) are Bullish with a score of 67.5 percent.
Price Trend-Following Model: Weak Uptrend
Our weekly trend-following model classifies the current market price position as: Weak Uptrend. The current action for the model is considered to be: Hold – Maintain Long Position.
| Silver Futures Statistics | SPECULATORS | COMMERCIALS | SMALL TRADERS |
| – Percent of Open Interest Longs: | 40.9 | 27.6 | 22.7 |
| – Percent of Open Interest Shorts: | 21.5 | 60.8 | 8.9 |
| – Net Position: | 25,593 | -43,759 | 18,166 |
| – Gross Longs: | 54,001 | 36,482 | 29,933 |
| – Gross Shorts: | 28,408 | 80,241 | 11,767 |
| – Long to Short Ratio: | 1.9 to 1 | 0.5 to 1 | 2.5 to 1 |
| NET POSITION TREND: | |||
| – Strength Index Score (3 Year Range Pct): | 57.1 | 38.5 | 67.5 |
| – Strength Index Reading (3 Year Range): | Bullish | Bearish | Bullish |
| NET POSITION MOVEMENT INDEX: | |||
| – 6-Week Change in Strength Index: | -15.9 | 10.4 | 13.7 |
Copper Grade #1 Futures:
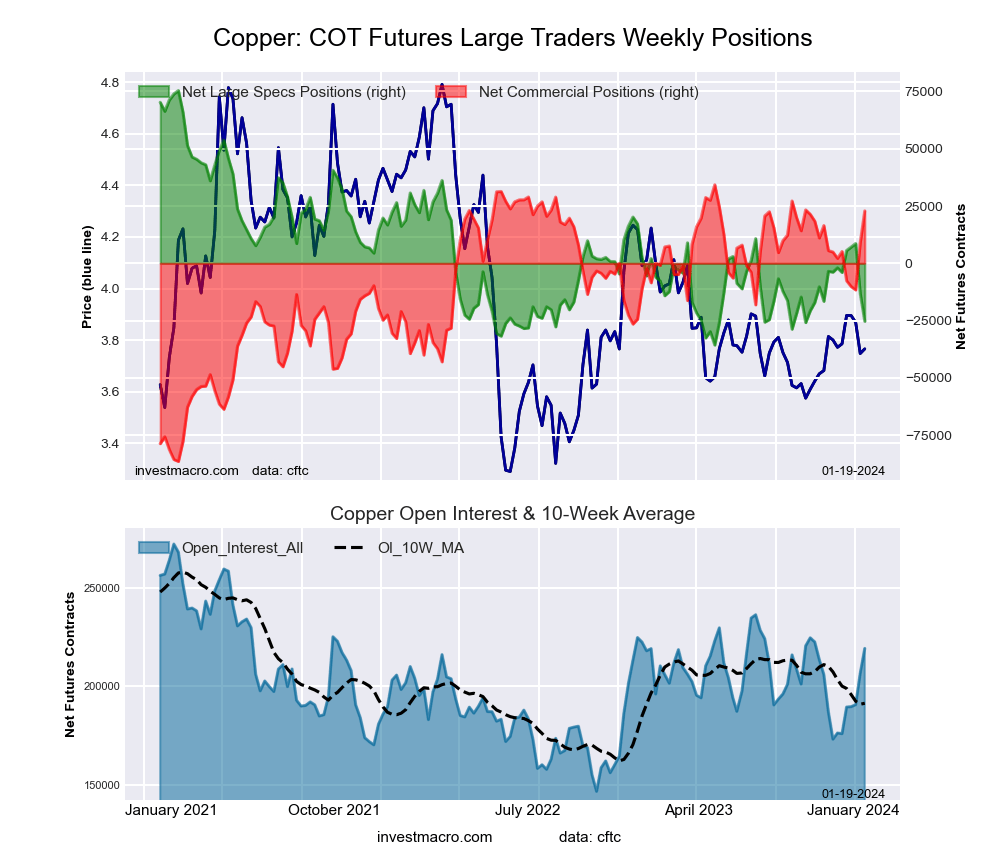 The Copper Grade #1 Futures large speculator standing this week totaled a net position of -25,306 contracts in the data reported through Tuesday. This was a weekly decrease of -12,139 contracts from the previous week which had a total of -13,167 net contracts.
This week’s current strength score (the trader positioning range over the past three years, measured from 0 to 100) shows the speculators are currently Bearish-Extreme with a score of 9.4 percent. The commercials are Bullish-Extreme with a score of 90.6 percent and the small traders (not shown in chart) are Bearish with a score of 34.0 percent.
Price Trend-Following Model: Uptrend
Our weekly trend-following model classifies the current market price position as: Uptrend. The current action for the model is considered to be: Hold – Maintain Long Position.
| Copper Futures Statistics | SPECULATORS | COMMERCIALS | SMALL TRADERS |
| – Percent of Open Interest Longs: | 28.5 | 42.6 | 6.8 |
| – Percent of Open Interest Shorts: | 40.0 | 32.2 | 5.7 |
| – Net Position: | -25,306 | 22,851 | 2,455 |
| – Gross Longs: | 62,408 | 93,533 | 14,856 |
| – Gross Shorts: | 87,714 | 70,682 | 12,401 |
| – Long to Short Ratio: | 0.7 to 1 | 1.3 to 1 | 1.2 to 1 |
| NET POSITION TREND: | |||
| – Strength Index Score (3 Year Range Pct): | 9.4 | 90.6 | 34.0 |
| – Strength Index Reading (3 Year Range): | Bearish-Extreme | Bullish-Extreme | Bearish |
| NET POSITION MOVEMENT INDEX: | |||
| – 6-Week Change in Strength Index: | -21.0 | 17.1 | 16.4 |
Platinum Futures:
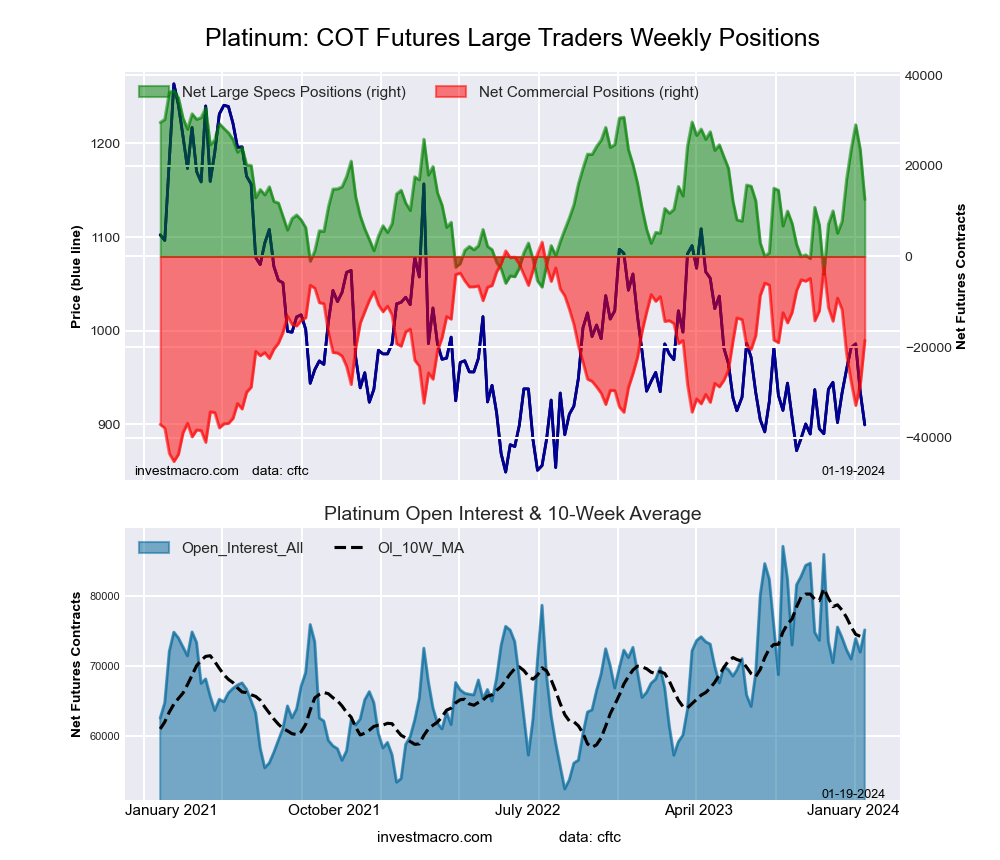 The Platinum Futures large speculator standing this week totaled a net position of 12,557 contracts in the data reported through Tuesday. This was a weekly fall of -10,984 contracts from the previous week which had a total of 23,541 net contracts.
This week’s current strength score (the trader positioning range over the past three years, measured from 0 to 100) shows the speculators are currently Bearish with a score of 44.6 percent. The commercials are Bullish with a score of 55.2 percent and the small traders (not shown in chart) are Bearish with a score of 47.6 percent.
Price Trend-Following Model: Weak Uptrend
Our weekly trend-following model classifies the current market price position as: Weak Uptrend. The current action for the model is considered to be: Hold – Maintain Long Position.
| Platinum Futures Statistics | SPECULATORS | COMMERCIALS | SMALL TRADERS |
| – Percent of Open Interest Longs: | 57.6 | 23.7 | 12.7 |
| – Percent of Open Interest Shorts: | 40.9 | 48.3 | 4.8 |
| – Net Position: | 12,557 | -18,498 | 5,941 |
| – Gross Longs: | 43,243 | 17,774 | 9,509 |
| – Gross Shorts: | 30,686 | 36,272 | 3,568 |
| – Long to Short Ratio: | 1.4 to 1 | 0.5 to 1 | 2.7 to 1 |
| NET POSITION TREND: | |||
| – Strength Index Score (3 Year Range Pct): | 44.6 | 55.2 | 47.6 |
| – Strength Index Reading (3 Year Range): | Bearish | Bullish | Bearish |
| NET POSITION MOVEMENT INDEX: | |||
| – 6-Week Change in Strength Index: | 17.1 | -19.3 | 25.2 |
Palladium Futures:
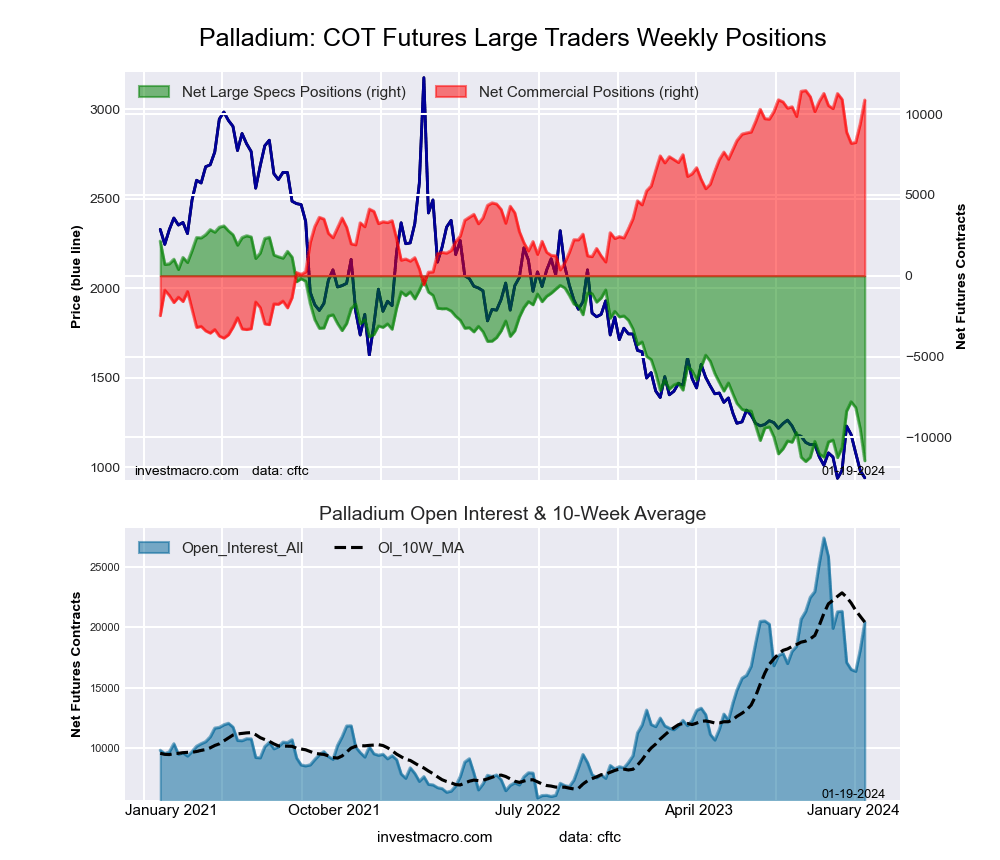 The Palladium Futures large speculator standing this week totaled a net position of -11,449 contracts in the data reported through Tuesday. This was a weekly fall of -1,977 contracts from the previous week which had a total of -9,472 net contracts.
This week’s current strength score (the trader positioning range over the past three years, measured from 0 to 100) shows the speculators are currently Bearish-Extreme with a score of 0.3 percent. The commercials are Bullish-Extreme with a score of 96.2 percent and the small traders (not shown in chart) are Bullish with a score of 76.3 percent.
Price Trend-Following Model: Strong Downtrend
Our weekly trend-following model classifies the current market price position as: Strong Downtrend. The current action for the model is considered to be: Hold – Maintain Short Position.
| Palladium Futures Statistics | SPECULATORS | COMMERCIALS | SMALL TRADERS |
| – Percent of Open Interest Longs: | 17.8 | 60.6 | 10.9 |
| – Percent of Open Interest Shorts: | 73.9 | 7.3 | 8.1 |
| – Net Position: | -11,449 | 10,874 | 575 |
| – Gross Longs: | 3,623 | 12,370 | 2,226 |
| – Gross Shorts: | 15,072 | 1,496 | 1,651 |
| – Long to Short Ratio: | 0.2 to 1 | 8.3 to 1 | 1.3 to 1 |
| NET POSITION TREND: | |||
| – Strength Index Score (3 Year Range Pct): | 0.3 | 96.2 | 76.3 |
| – Strength Index Reading (3 Year Range): | Bearish-Extreme | Bullish-Extreme | Bullish |
| NET POSITION MOVEMENT INDEX: | |||
| – 6-Week Change in Strength Index: | -1.4 | -2.6 | 36.1 |
Steel Futures Futures:
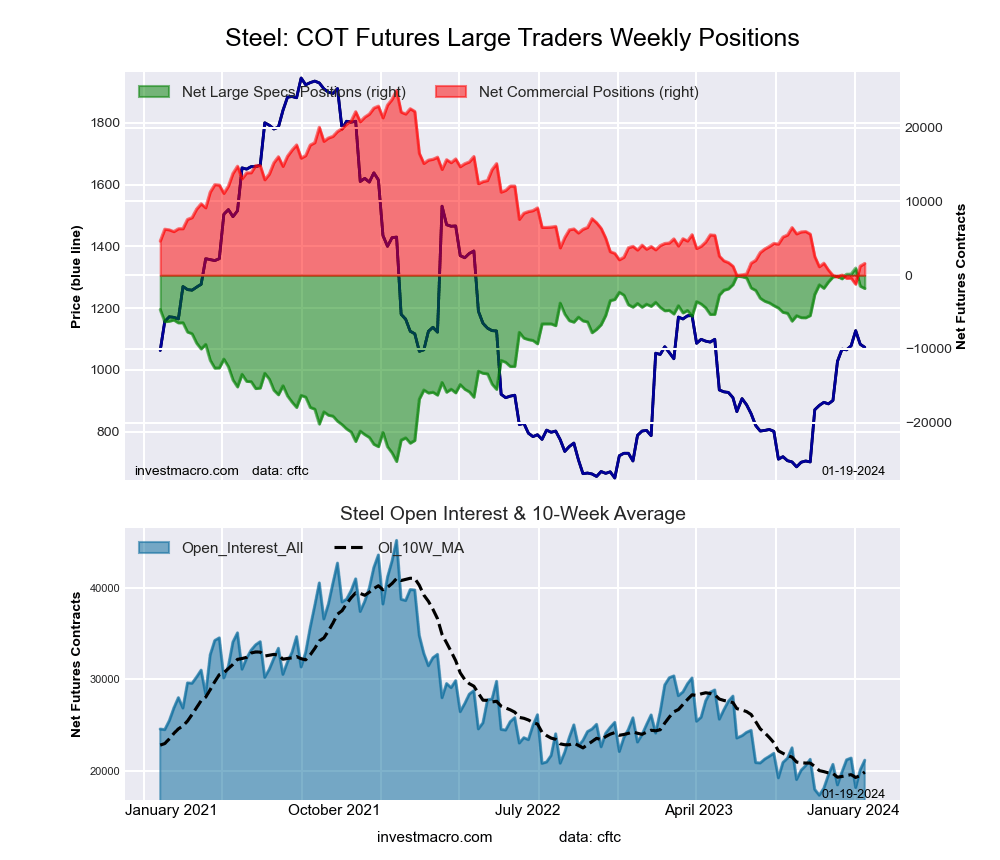 The Steel Futures large speculator standing this week totaled a net position of -1,793 contracts in the data reported through Tuesday. This was a weekly decrease of -316 contracts from the previous week which had a total of -1,477 net contracts.
This week’s current strength score (the trader positioning range over the past three years, measured from 0 to 100) shows the speculators are currently Bullish-Extreme with a score of 89.5 percent. The commercials are Bearish-Extreme with a score of 10.7 percent and the small traders (not shown in chart) are Bullish with a score of 54.0 percent.
Price Trend-Following Model: Uptrend
Our weekly trend-following model classifies the current market price position as: Uptrend. The current action for the model is considered to be: Hold – Maintain Long Position.
| Steel Futures Statistics | SPECULATORS | COMMERCIALS | SMALL TRADERS |
| – Percent of Open Interest Longs: | 14.7 | 80.1 | 2.1 |
| – Percent of Open Interest Shorts: | 23.2 | 72.6 | 1.1 |
| – Net Position: | -1,793 | 1,595 | 198 |
| – Gross Longs: | 3,114 | 16,956 | 440 |
| – Gross Shorts: | 4,907 | 15,361 | 242 |
| – Long to Short Ratio: | 0.6 to 1 | 1.1 to 1 | 1.8 to 1 |
| NET POSITION TREND: | |||
| – Strength Index Score (3 Year Range Pct): | 89.5 | 10.7 | 54.0 |
| – Strength Index Reading (3 Year Range): | Bullish-Extreme | Bearish-Extreme | Bullish |
| NET POSITION MOVEMENT INDEX: | |||
| – 6-Week Change in Strength Index: | -6.2 | 7.0 | -23.0 |
Article By InvestMacro – Receive our weekly COT Newsletter
*COT Report: The COT data, released weekly to the public each Friday, is updated through the most recent Tuesday (data is 3 days old) and shows a quick view of how large speculators or non-commercials (for-profit traders) were positioned in the futures markets.
The CFTC categorizes trader positions according to commercial hedgers (traders who use futures contracts for hedging as part of the business), non-commercials (large traders who speculate to realize trading profits) and nonreportable traders (usually small traders/speculators) as well as their open interest (contracts open in the market at time of reporting). See CFTC criteria here.

- Stock indices rose after the release of US inflation data. China’s GDP slowed sharply Jul 15, 2026
- GBP/USD Awaits Political News: What Will Happen Next Jul 15, 2026
- USD/JPY Holds at Highs: Pressure Lingers on Yen Jul 14, 2026
- Oil prices jumped 4% amid a new wave of escalation between the US and Iran Jul 13, 2026
- EUR/USD: US Inflation Will Determine Everything Jul 13, 2026
- COT Metals Charts: Weekly Speculator Bets see small gains for Silver & Gold Jul 12, 2026
- COT Bonds Charts: Speculator Bets led by SOFR 3-Months & 2-Year Bonds Jul 12, 2026
- COT Energy Charts: Weekly Speculator Changes led by Brent Oil Jul 12, 2026
- COT Soft Commodities Charts: Weekly Speculator Changes led by Sugar, Corn & Soybeans Jul 12, 2026
- The US and European stock indices are rising again amid renewed investor interest in the AI industry. Jul 10, 2026