By InvestMacro
Here are the latest charts and statistics for the Commitment of Traders (COT) reports data published by the Commodities Futures Trading Commission (CFTC).
The latest COT data is updated through Tuesday April 23th and shows a quick view of how large traders (for-profit speculators and commercial entities) were positioned in the futures markets.
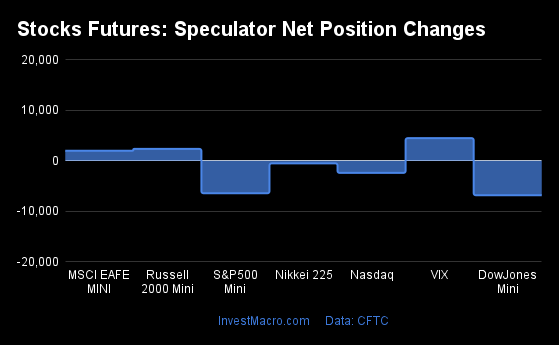
Weekly Speculator Changes led by Corn & Soybean Meal
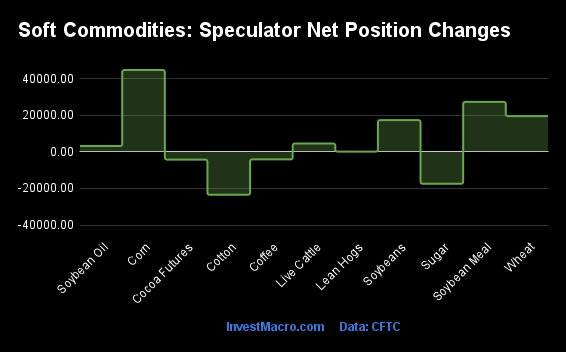
The COT soft commodities markets speculator bets were higher this week as seven out of the eleven softs markets we cover had higher positioning while the other four markets had lower speculator contracts.
Leading the gains for the softs markets was Corn (44,689 contracts) with Soybean Meal (27,275 contracts), Wheat (19,506 contracts), Soybeans (17,323 contracts), Live Cattle (4,542 contracts), Soybean Oil (3,205 contracts), also showing positive weeks.
The markets with the declines in speculator bets this week were Cotton (-23,470 contracts), Sugar (-17,463 contracts), Coffee (-4,157 contracts), Cocoa (-4,251 contracts) and Lean Hogs (125 contracts) also registering lower bets on the week.
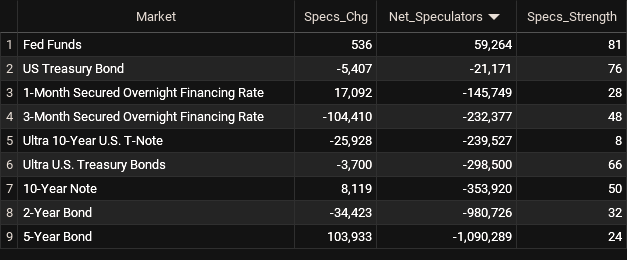
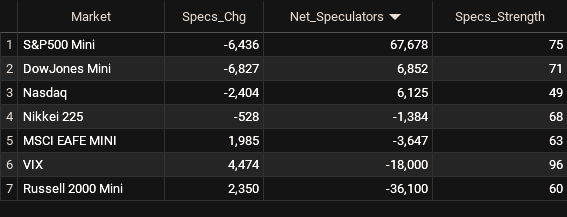
Softs Net Speculators Leaderboard
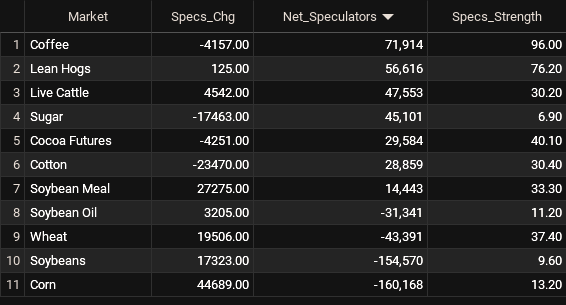
Legend: Weekly Speculators Change | Speculators Current Net Position | Speculators Strength Score compared to last 3-Years (0-100 range)
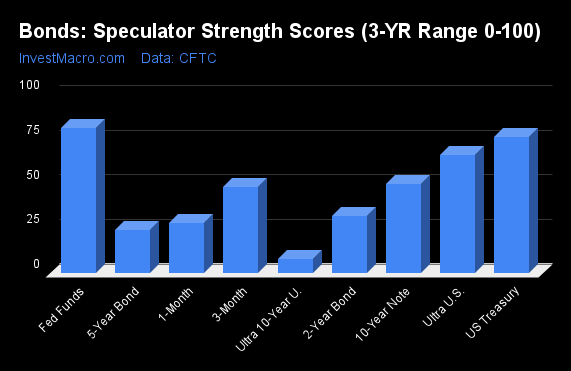
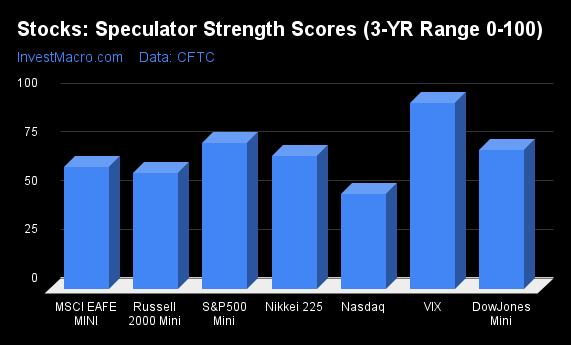
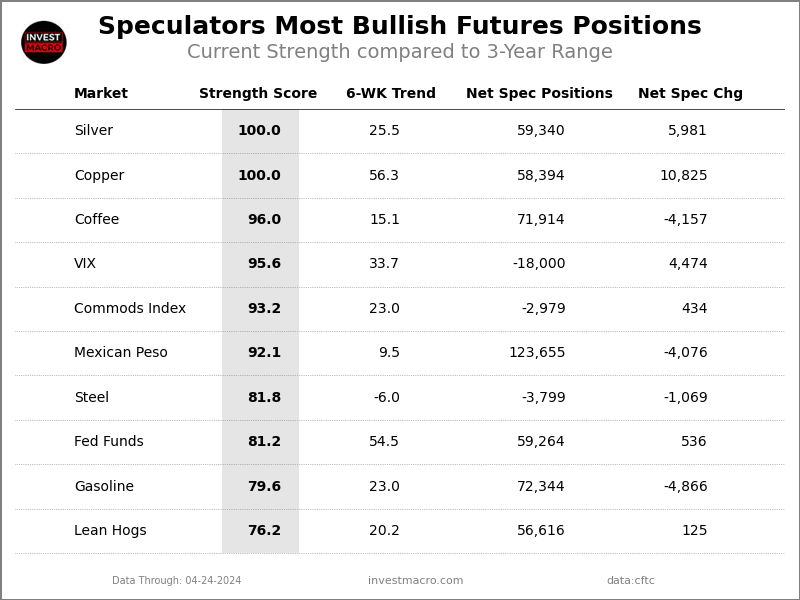
Strength Scores led by Coffee & Lean Hogs
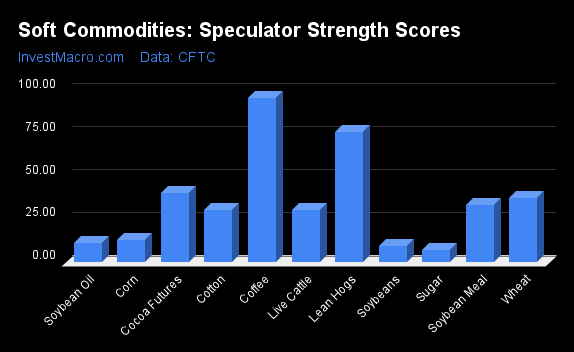
COT Strength Scores (a normalized measure of Speculator positions over a 3-Year range, from 0 to 100 where above 80 is Extreme-Bullish and below 20 is Extreme-Bearish) showed that Coffee (96 percent) and Lean Hogs (76 percent) lead the softs markets this week.
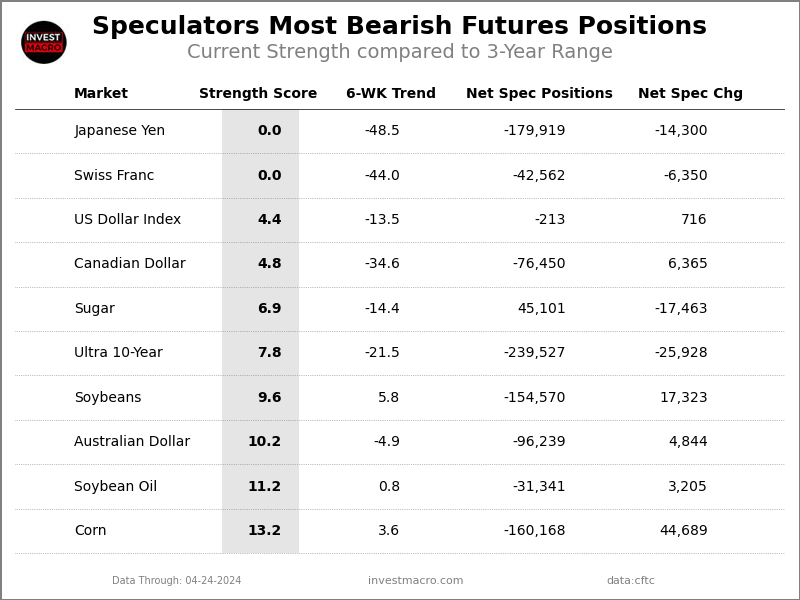
On the downside, Sugar (7 percent), Soybeans (10 percent), Soybean Oil (11 percent) and the Corn (13 percent) come in at the lowest strength levels currently and are in Extreme-Bearish territory (below 20 percent).
Strength Statistics:
Corn (13.2 percent) vs Corn previous week (7.6 percent)
Sugar (6.9 percent) vs Sugar previous week (13.2 percent)
Coffee (96.0 percent) vs Coffee previous week (100.0 percent)
Soybeans (9.6 percent) vs Soybeans previous week (5.7 percent)
Soybean Oil (11.2 percent) vs Soybean Oil previous week (9.2 percent)
Soybean Meal (33.3 percent) vs Soybean Meal previous week (22.1 percent)
Live Cattle (30.2 percent) vs Live Cattle previous week (25.3 percent)
Lean Hogs (76.2 percent) vs Lean Hogs previous week (76.1 percent)
Cotton (30.4 percent) vs Cotton previous week (48.1 percent)
Cocoa (40.1 percent) vs Cocoa previous week (44.5 percent)
Wheat (37.4 percent) vs Wheat previous week (23.8 percent)
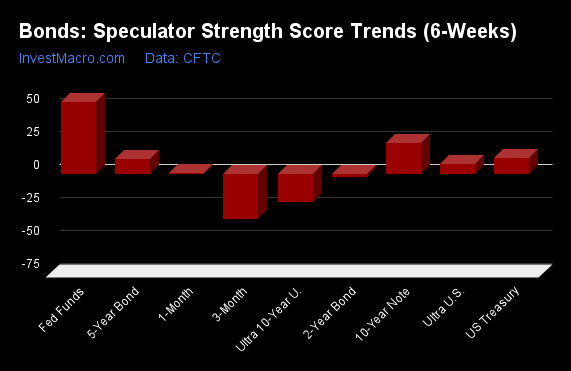
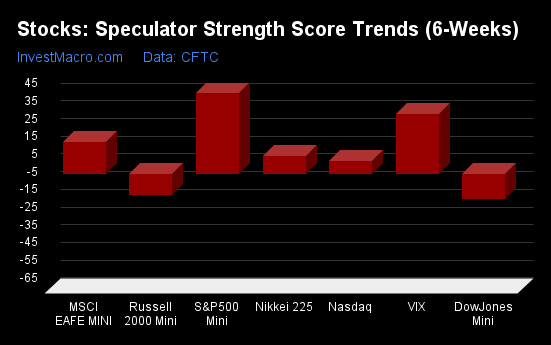
Soybean Meal & Lean Hogs top the 6-Week Strength Trends
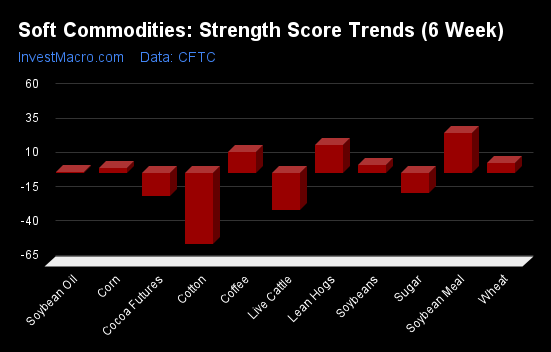
COT Strength Score Trends (or move index, calculates the 6-week changes in strength scores) showed that Soybean Meal (29 percent) and Lean Hogs (20 percent) lead the past six weeks trends for soft commodities. Coffee (15 percent), Wheat (7 percent) and Soybeans (6 percent) are the next highest positive movers in the latest trends data.
Cotton (-52 percent) leads the downside trend scores currently with Live Cattle (-27 percent), Cocoa (-17 percent) and Sugar (-14 percent) following next with lower trend scores.
Strength Trend Statistics:
Corn (3.6 percent) vs Corn previous week (3.2 percent)
Sugar (-14.4 percent) vs Sugar previous week (-7.0 percent)
Coffee (15.1 percent) vs Coffee previous week (22.0 percent)
Soybeans (5.8 percent) vs Soybeans previous week (5.7 percent)
Soybean Oil (0.8 percent) vs Soybean Oil previous week (9.2 percent)
Soybean Meal (29.3 percent) vs Soybean Meal previous week (19.1 percent)
Live Cattle (-27.3 percent) vs Live Cattle previous week (-27.9 percent)
Lean Hogs (20.2 percent) vs Lean Hogs previous week (18.6 percent)
Cotton (-51.7 percent) vs Cotton previous week (-36.7 percent)
Cocoa (-16.5 percent) vs Cocoa previous week (-9.7 percent)
Wheat (7.2 percent) vs Wheat previous week (-12.6 percent)
Individual Soft Commodities Markets:
CORN Futures:
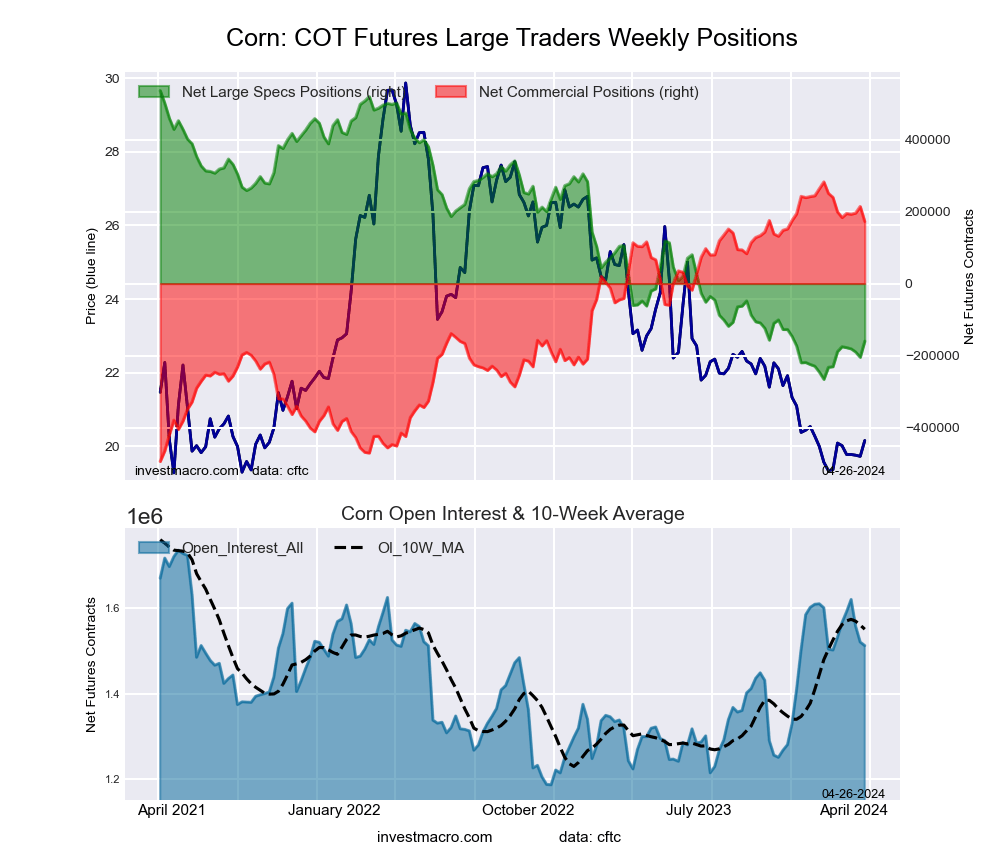 The CORN large speculator standing this week equaled a net position of -160,168 contracts in the data reported through Tuesday. This was a weekly rise of 44,689 contracts from the previous week which had a total of -204,857 net contracts.
This week’s current strength score (the trader positioning range over the past three years, measured from 0 to 100) shows the speculators are currently Bearish-Extreme with a score of 13.2 percent. The commercials are Bullish-Extreme with a score of 85.8 percent and the small traders (not shown in chart) are Bullish-Extreme with a score of 91.3 percent.
Price Trend-Following Model: Downtrend
Our weekly trend-following model classifies the current market price position as: Downtrend. The current action for the model is considered to be: Hold – Maintain Short Position.
| CORN Futures Statistics | SPECULATORS | COMMERCIALS | SMALL TRADERS |
| – Percent of Open Interest Longs: | 19.1 | 44.7 | 9.9 |
| – Percent of Open Interest Shorts: | 29.7 | 33.3 | 10.7 |
| – Net Position: | -160,168 | 172,388 | -12,220 |
| – Gross Longs: | 288,529 | 676,526 | 149,210 |
| – Gross Shorts: | 448,697 | 504,138 | 161,430 |
| – Long to Short Ratio: | 0.6 to 1 | 1.3 to 1 | 0.9 to 1 |
| NET POSITION TREND: | | | |
| – Strength Index Score (3 Year Range Pct): | 13.2 | 85.8 | 91.3 |
| – Strength Index Reading (3 Year Range): | Bearish-Extreme | Bullish-Extreme | Bullish-Extreme |
| NET POSITION MOVEMENT INDEX: | | | |
| – 6-Week Change in Strength Index: | 3.6 | -3.4 | -2.9 |
SUGAR Futures:
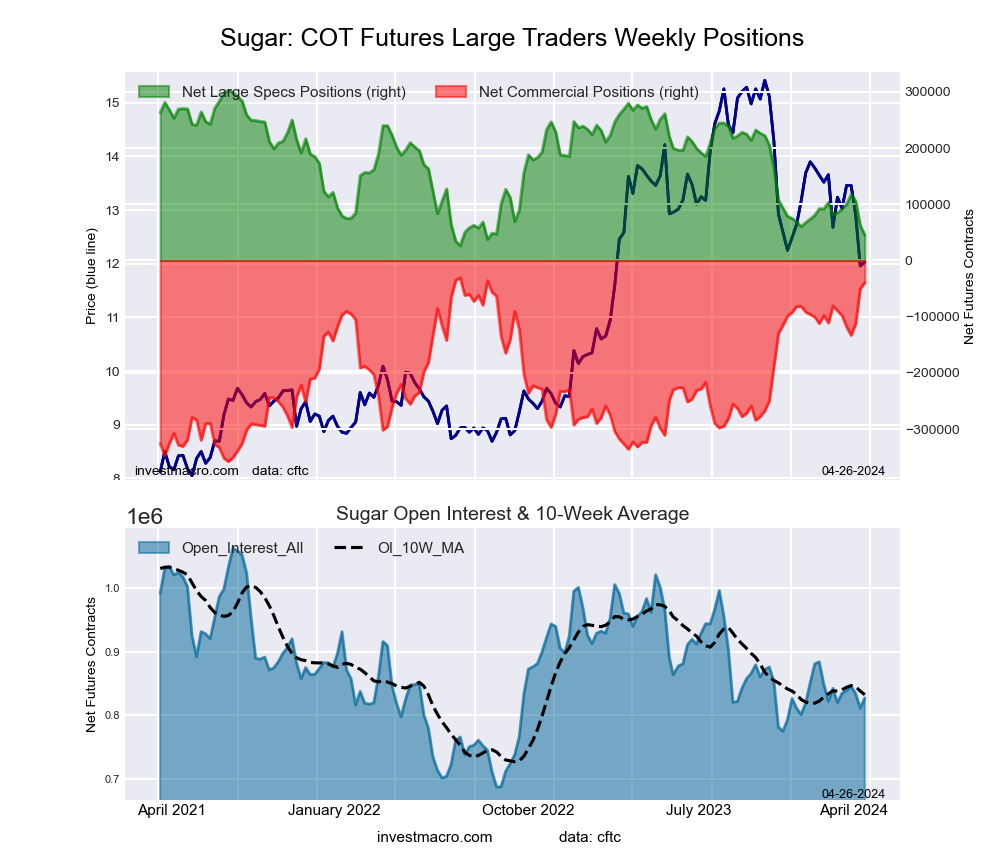 The SUGAR large speculator standing this week equaled a net position of 45,101 contracts in the data reported through Tuesday. This was a weekly decrease of -17,463 contracts from the previous week which had a total of 62,564 net contracts.
This week’s current strength score (the trader positioning range over the past three years, measured from 0 to 100) shows the speculators are currently Bearish-Extreme with a score of 6.9 percent. The commercials are Bullish-Extreme with a score of 97.4 percent and the small traders (not shown in chart) are Bearish-Extreme with a score of 8.1 percent.
Price Trend-Following Model: Strong Downtrend
Our weekly trend-following model classifies the current market price position as: Strong Downtrend. The current action for the model is considered to be: Hold – Maintain Short Position.
| SUGAR Futures Statistics | SPECULATORS | COMMERCIALS | SMALL TRADERS |
| – Percent of Open Interest Longs: | 23.9 | 54.6 | 8.0 |
| – Percent of Open Interest Shorts: | 18.4 | 59.4 | 8.7 |
| – Net Position: | 45,101 | -39,150 | -5,951 |
| – Gross Longs: | 197,297 | 451,980 | 66,162 |
| – Gross Shorts: | 152,196 | 491,130 | 72,113 |
| – Long to Short Ratio: | 1.3 to 1 | 0.9 to 1 | 0.9 to 1 |
| NET POSITION TREND: | | | |
| – Strength Index Score (3 Year Range Pct): | 6.9 | 97.4 | 8.1 |
| – Strength Index Reading (3 Year Range): | Bearish-Extreme | Bullish-Extreme | Bearish-Extreme |
| NET POSITION MOVEMENT INDEX: | | | |
| – 6-Week Change in Strength Index: | -14.4 | 15.4 | -13.4 |
COFFEE Futures:
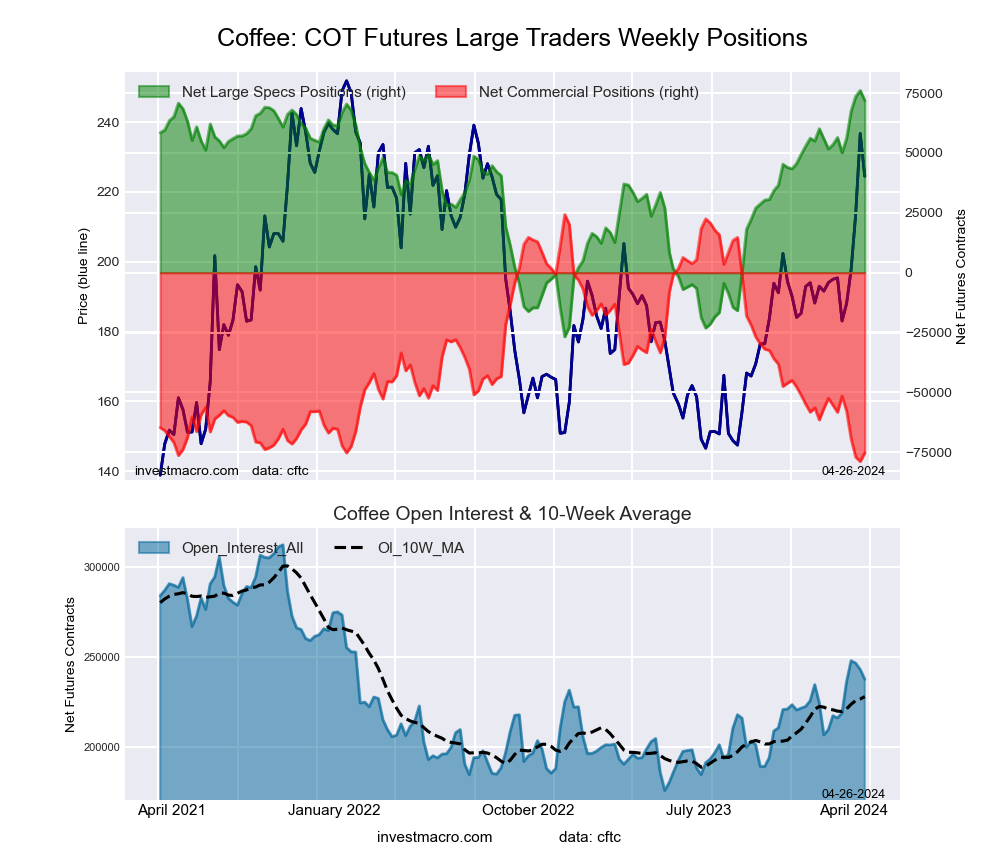 The COFFEE large speculator standing this week equaled a net position of 71,914 contracts in the data reported through Tuesday. This was a weekly decline of -4,157 contracts from the previous week which had a total of 76,071 net contracts.
This week’s current strength score (the trader positioning range over the past three years, measured from 0 to 100) shows the speculators are currently Bullish-Extreme with a score of 96.0 percent. The commercials are Bearish-Extreme with a score of 3.5 percent and the small traders (not shown in chart) are Bullish with a score of 58.7 percent.
Price Trend-Following Model: Strong Uptrend
Our weekly trend-following model classifies the current market price position as: Strong Uptrend. The current action for the model is considered to be: Hold – Maintain Long Position.
| COFFEE Futures Statistics | SPECULATORS | COMMERCIALS | SMALL TRADERS |
| – Percent of Open Interest Longs: | 39.5 | 34.9 | 3.5 |
| – Percent of Open Interest Shorts: | 9.2 | 66.6 | 2.1 |
| – Net Position: | 71,914 | -75,215 | 3,301 |
| – Gross Longs: | 93,736 | 82,876 | 8,334 |
| – Gross Shorts: | 21,822 | 158,091 | 5,033 |
| – Long to Short Ratio: | 4.3 to 1 | 0.5 to 1 | 1.7 to 1 |
| NET POSITION TREND: | | | |
| – Strength Index Score (3 Year Range Pct): | 96.0 | 3.5 | 58.7 |
| – Strength Index Reading (3 Year Range): | Bullish-Extreme | Bearish-Extreme | Bullish |
| NET POSITION MOVEMENT INDEX: | | | |
| – 6-Week Change in Strength Index: | 15.1 | -16.4 | 19.9 |
SOYBEANS Futures:
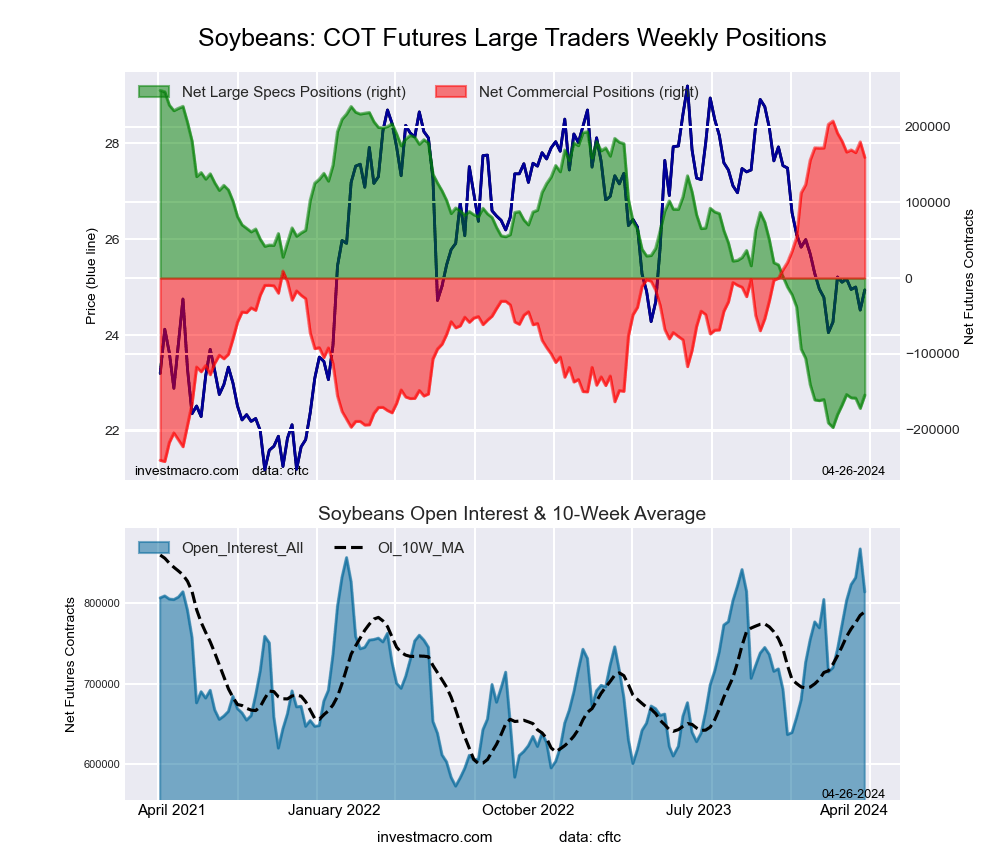 The SOYBEANS large speculator standing this week equaled a net position of -154,570 contracts in the data reported through Tuesday. This was a weekly advance of 17,323 contracts from the previous week which had a total of -171,893 net contracts.
This week’s current strength score (the trader positioning range over the past three years, measured from 0 to 100) shows the speculators are currently Bearish-Extreme with a score of 9.6 percent. The commercials are Bullish-Extreme with a score of 89.3 percent and the small traders (not shown in chart) are Bullish-Extreme with a score of 97.6 percent.
Price Trend-Following Model: Downtrend
Our weekly trend-following model classifies the current market price position as: Downtrend. The current action for the model is considered to be: Hold – Maintain Short Position.
| SOYBEANS Futures Statistics | SPECULATORS | COMMERCIALS | SMALL TRADERS |
| – Percent of Open Interest Longs: | 11.8 | 58.9 | 6.8 |
| – Percent of Open Interest Shorts: | 30.8 | 39.3 | 7.4 |
| – Net Position: | -154,570 | 159,322 | -4,752 |
| – Gross Longs: | 96,430 | 479,373 | 55,609 |
| – Gross Shorts: | 251,000 | 320,051 | 60,361 |
| – Long to Short Ratio: | 0.4 to 1 | 1.5 to 1 | 0.9 to 1 |
| NET POSITION TREND: | | | |
| – Strength Index Score (3 Year Range Pct): | 9.6 | 89.3 | 97.6 |
| – Strength Index Reading (3 Year Range): | Bearish-Extreme | Bullish-Extreme | Bullish-Extreme |
| NET POSITION MOVEMENT INDEX: | | | |
| – 6-Week Change in Strength Index: | 5.8 | -7.1 | 15.7 |
SOYBEAN OIL Futures:
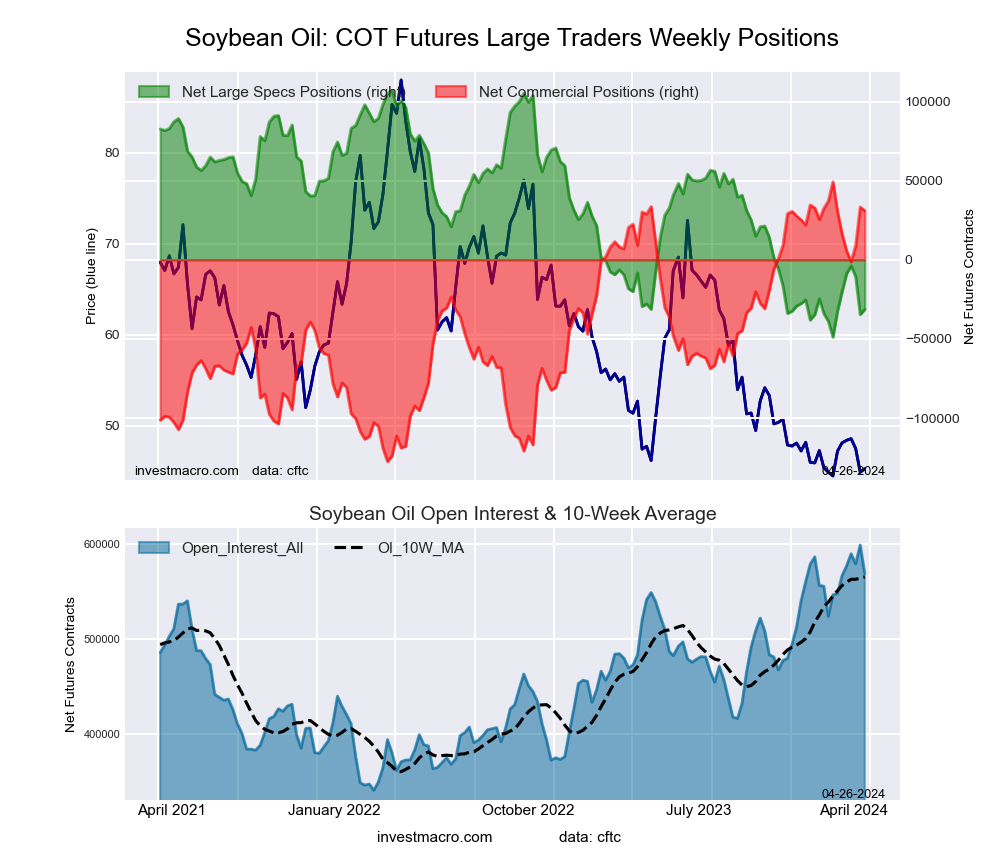 The SOYBEAN OIL large speculator standing this week equaled a net position of -31,341 contracts in the data reported through Tuesday. This was a weekly advance of 3,205 contracts from the previous week which had a total of -34,546 net contracts.
This week’s current strength score (the trader positioning range over the past three years, measured from 0 to 100) shows the speculators are currently Bearish-Extreme with a score of 11.2 percent. The commercials are Bullish-Extreme with a score of 89.7 percent and the small traders (not shown in chart) are Bearish-Extreme with a score of 15.4 percent.
Price Trend-Following Model: Strong Downtrend
Our weekly trend-following model classifies the current market price position as: Strong Downtrend. The current action for the model is considered to be: Hold – Maintain Short Position.
| SOYBEAN OIL Futures Statistics | SPECULATORS | COMMERCIALS | SMALL TRADERS |
| – Percent of Open Interest Longs: | 20.3 | 51.3 | 5.0 |
| – Percent of Open Interest Shorts: | 25.8 | 45.9 | 4.9 |
| – Net Position: | -31,341 | 31,005 | 336 |
| – Gross Longs: | 115,457 | 291,905 | 28,361 |
| – Gross Shorts: | 146,798 | 260,900 | 28,025 |
| – Long to Short Ratio: | 0.8 to 1 | 1.1 to 1 | 1.0 to 1 |
| NET POSITION TREND: | | | |
| – Strength Index Score (3 Year Range Pct): | 11.2 | 89.7 | 15.4 |
| – Strength Index Reading (3 Year Range): | Bearish-Extreme | Bullish-Extreme | Bearish-Extreme |
| NET POSITION MOVEMENT INDEX: | | | |
| – 6-Week Change in Strength Index: | 0.8 | 0.3 | -6.5 |
SOYBEAN MEAL Futures:
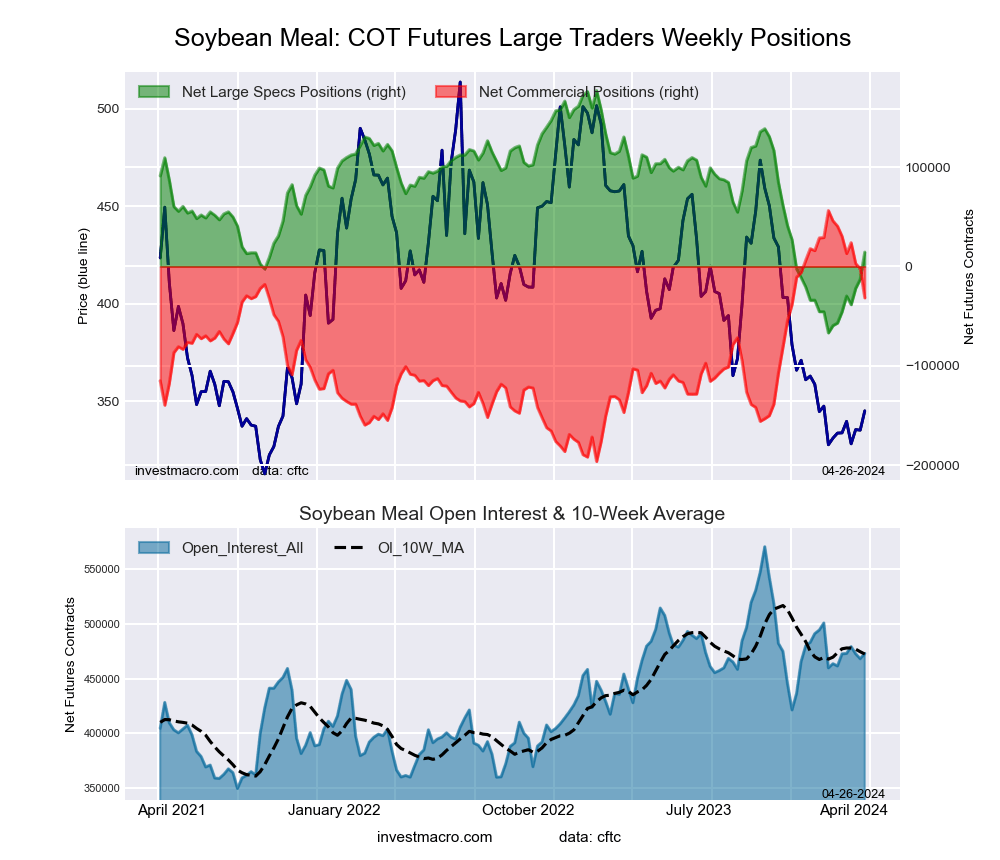 The SOYBEAN MEAL large speculator standing this week equaled a net position of 14,443 contracts in the data reported through Tuesday. This was a weekly increase of 27,275 contracts from the previous week which had a total of -12,832 net contracts.
This week’s current strength score (the trader positioning range over the past three years, measured from 0 to 100) shows the speculators are currently Bearish with a score of 33.3 percent. The commercials are Bullish with a score of 65.2 percent and the small traders (not shown in chart) are Bearish with a score of 32.7 percent.
Price Trend-Following Model: Downtrend
Our weekly trend-following model classifies the current market price position as: Downtrend. The current action for the model is considered to be: Hold – Maintain Short Position.
| SOYBEAN MEAL Futures Statistics | SPECULATORS | COMMERCIALS | SMALL TRADERS |
| – Percent of Open Interest Longs: | 25.5 | 44.7 | 9.7 |
| – Percent of Open Interest Shorts: | 22.4 | 51.4 | 6.1 |
| – Net Position: | 14,443 | -31,560 | 17,117 |
| – Gross Longs: | 120,442 | 211,556 | 45,894 |
| – Gross Shorts: | 105,999 | 243,116 | 28,777 |
| – Long to Short Ratio: | 1.1 to 1 | 0.9 to 1 | 1.6 to 1 |
| NET POSITION TREND: | | | |
| – Strength Index Score (3 Year Range Pct): | 33.3 | 65.2 | 32.7 |
| – Strength Index Reading (3 Year Range): | Bearish | Bullish | Bearish |
| NET POSITION MOVEMENT INDEX: | | | |
| – 6-Week Change in Strength Index: | 29.3 | -28.6 | 3.6 |
LIVE CATTLE Futures:
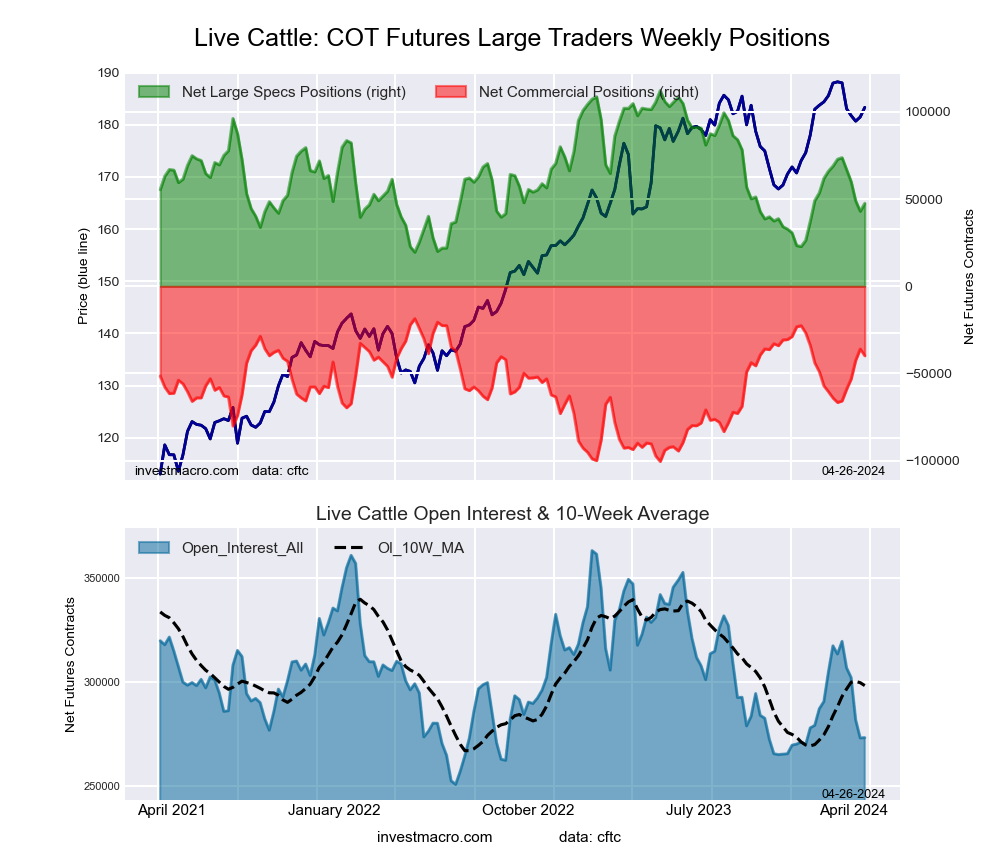 The LIVE CATTLE large speculator standing this week equaled a net position of 47,553 contracts in the data reported through Tuesday. This was a weekly rise of 4,542 contracts from the previous week which had a total of 43,011 net contracts.
This week’s current strength score (the trader positioning range over the past three years, measured from 0 to 100) shows the speculators are currently Bearish with a score of 30.2 percent. The commercials are Bullish with a score of 74.0 percent and the small traders (not shown in chart) are Bearish with a score of 48.7 percent.
Price Trend-Following Model: Uptrend
Our weekly trend-following model classifies the current market price position as: Uptrend. The current action for the model is considered to be: Hold – Maintain Long Position.
| LIVE CATTLE Futures Statistics | SPECULATORS | COMMERCIALS | SMALL TRADERS |
| – Percent of Open Interest Longs: | 36.5 | 35.4 | 9.4 |
| – Percent of Open Interest Shorts: | 19.1 | 50.0 | 12.2 |
| – Net Position: | 47,553 | -39,851 | -7,702 |
| – Gross Longs: | 99,621 | 96,676 | 25,617 |
| – Gross Shorts: | 52,068 | 136,527 | 33,319 |
| – Long to Short Ratio: | 1.9 to 1 | 0.7 to 1 | 0.8 to 1 |
| NET POSITION TREND: | | | |
| – Strength Index Score (3 Year Range Pct): | 30.2 | 74.0 | 48.7 |
| – Strength Index Reading (3 Year Range): | Bearish | Bullish | Bearish |
| NET POSITION MOVEMENT INDEX: | | | |
| – 6-Week Change in Strength Index: | -27.3 | 32.7 | -7.9 |
LEAN HOGS Futures:
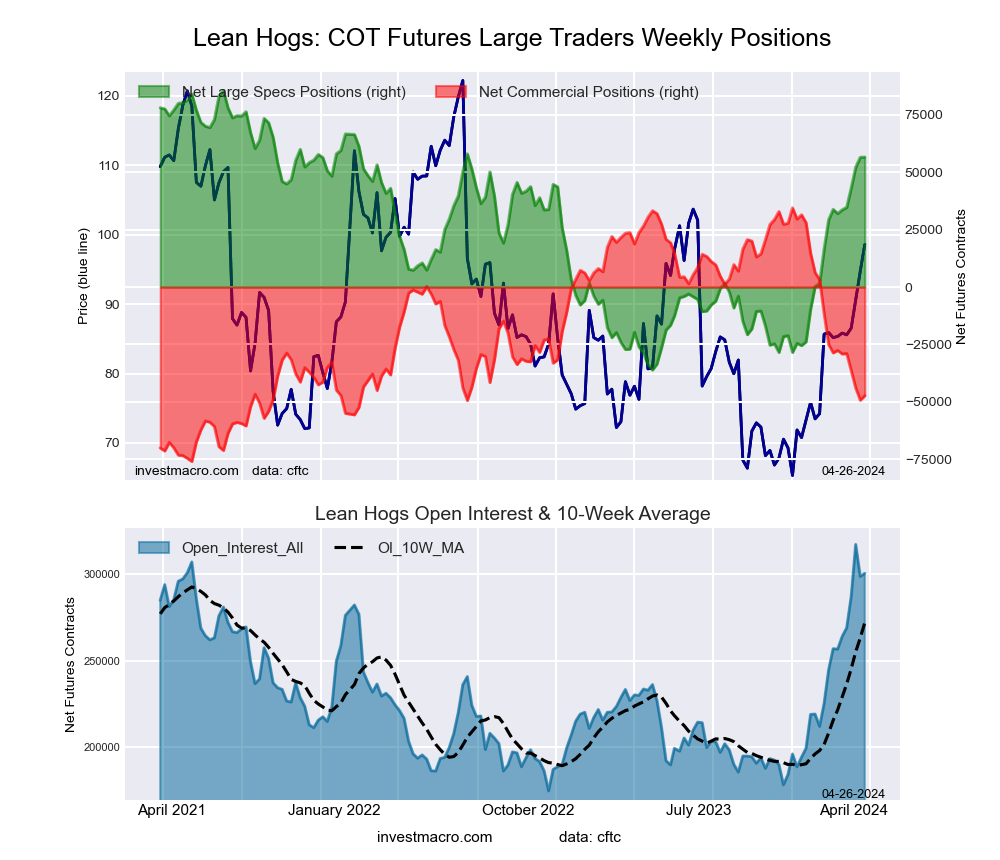 The LEAN HOGS large speculator standing this week equaled a net position of 56,616 contracts in the data reported through Tuesday. This was a weekly boost of 125 contracts from the previous week which had a total of 56,491 net contracts.
This week’s current strength score (the trader positioning range over the past three years, measured from 0 to 100) shows the speculators are currently Bullish with a score of 76.2 percent. The commercials are Bearish with a score of 26.0 percent and the small traders (not shown in chart) are Bearish with a score of 41.6 percent.
Price Trend-Following Model: Strong Uptrend
Our weekly trend-following model classifies the current market price position as: Strong Uptrend. The current action for the model is considered to be: Hold – Maintain Long Position.
| LEAN HOGS Futures Statistics | SPECULATORS | COMMERCIALS | SMALL TRADERS |
| – Percent of Open Interest Longs: | 40.8 | 32.9 | 7.5 |
| – Percent of Open Interest Shorts: | 21.9 | 48.6 | 10.6 |
| – Net Position: | 56,616 | -47,302 | -9,314 |
| – Gross Longs: | 122,474 | 98,812 | 22,604 |
| – Gross Shorts: | 65,858 | 146,114 | 31,918 |
| – Long to Short Ratio: | 1.9 to 1 | 0.7 to 1 | 0.7 to 1 |
| NET POSITION TREND: | | | |
| – Strength Index Score (3 Year Range Pct): | 76.2 | 26.0 | 41.6 |
| – Strength Index Reading (3 Year Range): | Bullish | Bearish | Bearish |
| NET POSITION MOVEMENT INDEX: | | | |
| – 6-Week Change in Strength Index: | 20.2 | -17.9 | -21.9 |
COTTON Futures:
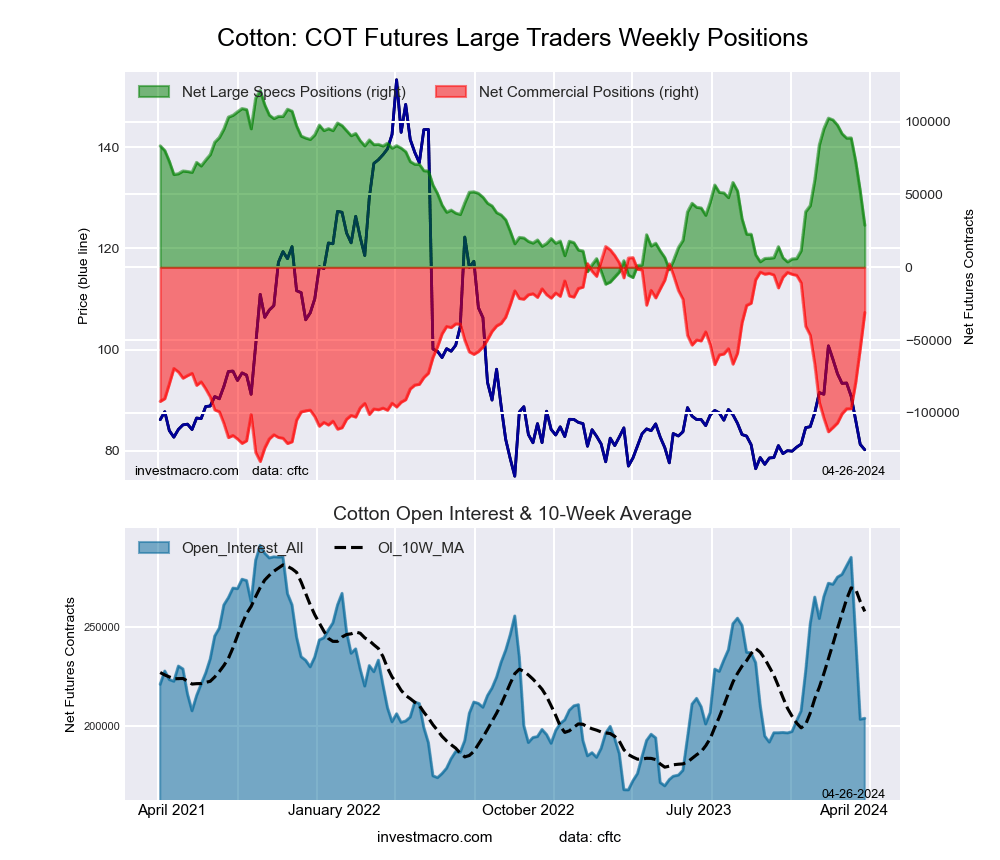 The COTTON large speculator standing this week equaled a net position of 28,859 contracts in the data reported through Tuesday. This was a weekly fall of -23,470 contracts from the previous week which had a total of 52,329 net contracts.
This week’s current strength score (the trader positioning range over the past three years, measured from 0 to 100) shows the speculators are currently Bearish with a score of 30.4 percent. The commercials are Bullish with a score of 69.3 percent and the small traders (not shown in chart) are Bearish with a score of 29.5 percent.
Price Trend-Following Model: Weak Uptrend
Our weekly trend-following model classifies the current market price position as: Weak Uptrend. The current action for the model is considered to be: Hold – Maintain Long Position.
| COTTON Futures Statistics | SPECULATORS | COMMERCIALS | SMALL TRADERS |
| – Percent of Open Interest Longs: | 36.6 | 41.5 | 6.5 |
| – Percent of Open Interest Shorts: | 22.5 | 56.8 | 5.4 |
| – Net Position: | 28,859 | -31,088 | 2,229 |
| – Gross Longs: | 74,765 | 84,774 | 13,337 |
| – Gross Shorts: | 45,906 | 115,862 | 11,108 |
| – Long to Short Ratio: | 1.6 to 1 | 0.7 to 1 | 1.2 to 1 |
| NET POSITION TREND: | | | |
| – Strength Index Score (3 Year Range Pct): | 30.4 | 69.3 | 29.5 |
| – Strength Index Reading (3 Year Range): | Bearish | Bullish | Bearish |
| NET POSITION MOVEMENT INDEX: | | | |
| – 6-Week Change in Strength Index: | -51.7 | 51.4 | -43.3 |
COCOA Futures:
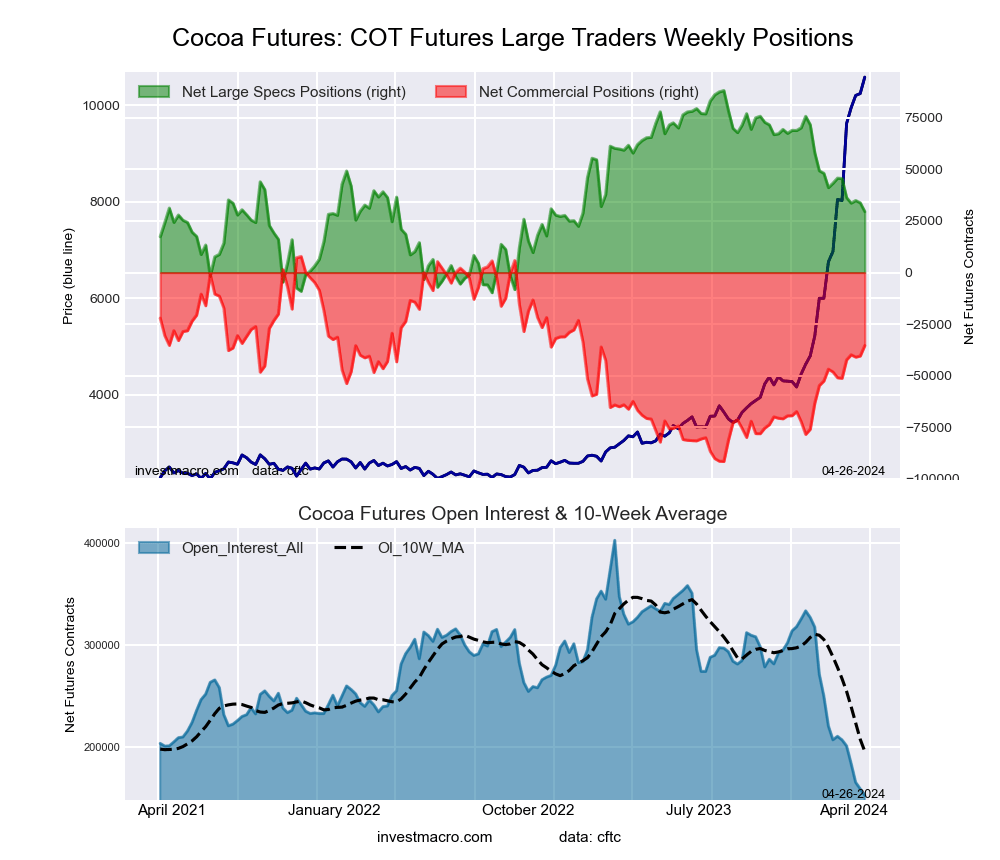 The COCOA large speculator standing this week equaled a net position of 29,584 contracts in the data reported through Tuesday. This was a weekly fall of -4,251 contracts from the previous week which had a total of 33,835 net contracts.
This week’s current strength score (the trader positioning range over the past three years, measured from 0 to 100) shows the speculators are currently Bearish with a score of 40.1 percent. The commercials are Bullish with a score of 56.5 percent and the small traders (not shown in chart) are Bullish with a score of 61.8 percent.
Price Trend-Following Model: Strong Uptrend
Our weekly trend-following model classifies the current market price position as: Strong Uptrend. The current action for the model is considered to be: Hold – Maintain Long Position.
| COCOA Futures Statistics | SPECULATORS | COMMERCIALS | SMALL TRADERS |
| – Percent of Open Interest Longs: | 33.8 | 32.8 | 8.1 |
| – Percent of Open Interest Shorts: | 14.5 | 55.9 | 4.3 |
| – Net Position: | 29,584 | -35,403 | 5,819 |
| – Gross Longs: | 51,685 | 50,137 | 12,440 |
| – Gross Shorts: | 22,101 | 85,540 | 6,621 |
| – Long to Short Ratio: | 2.3 to 1 | 0.6 to 1 | 1.9 to 1 |
| NET POSITION TREND: | | | |
| – Strength Index Score (3 Year Range Pct): | 40.1 | 56.5 | 61.8 |
| – Strength Index Reading (3 Year Range): | Bearish | Bullish | Bullish |
| NET POSITION MOVEMENT INDEX: | | | |
| – 6-Week Change in Strength Index: | -16.5 | 15.7 | 4.9 |
WHEAT Futures:
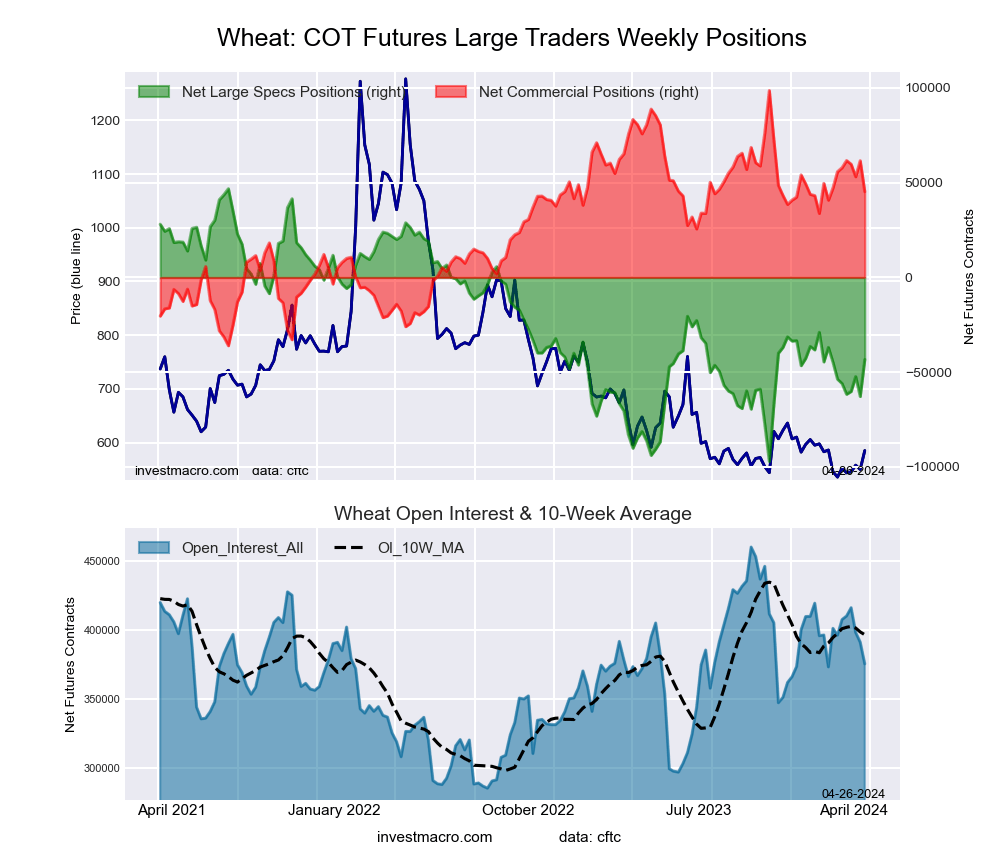 The WHEAT large speculator standing this week equaled a net position of -43,391 contracts in the data reported through Tuesday. This was a weekly advance of 19,506 contracts from the previous week which had a total of -62,897 net contracts.
This week’s current strength score (the trader positioning range over the past three years, measured from 0 to 100) shows the speculators are currently Bearish with a score of 37.4 percent. The commercials are Bullish with a score of 60.4 percent and the small traders (not shown in chart) are Bullish with a score of 58.1 percent.
Price Trend-Following Model: Weak Downtrend
Our weekly trend-following model classifies the current market price position as: Weak Downtrend. The current action for the model is considered to be: Hold – Maintain Short Position.
| WHEAT Futures Statistics | SPECULATORS | COMMERCIALS | SMALL TRADERS |
| – Percent of Open Interest Longs: | 32.9 | 36.1 | 8.1 |
| – Percent of Open Interest Shorts: | 44.5 | 24.0 | 8.6 |
| – Net Position: | -43,391 | 45,239 | -1,848 |
| – Gross Longs: | 123,697 | 135,439 | 30,321 |
| – Gross Shorts: | 167,088 | 90,200 | 32,169 |
| – Long to Short Ratio: | 0.7 to 1 | 1.5 to 1 | 0.9 to 1 |
| NET POSITION TREND: | | | |
| – Strength Index Score (3 Year Range Pct): | 37.4 | 60.4 | 58.1 |
| – Strength Index Reading (3 Year Range): | Bearish | Bullish | Bullish |
| NET POSITION MOVEMENT INDEX: | | | |
| – 6-Week Change in Strength Index: | 7.2 | -7.8 | 0.7 |
Article By InvestMacro – Receive our weekly COT Newsletter
*COT Report: The COT data, released weekly to the public each Friday, is updated through the most recent Tuesday (data is 3 days old) and shows a quick view of how large speculators or non-commercials (for-profit traders) were positioned in the futures markets.
The CFTC categorizes trader positions according to commercial hedgers (traders who use futures contracts for hedging as part of the business), non-commercials (large traders who speculate to realize trading profits) and nonreportable traders (usually small traders/speculators) as well as their open interest (contracts open in the market at time of reporting). See CFTC criteria here.