
By RoboForex Analytical Department
The price of a troy ounce of gold climbed to 2330.00 USD on Friday. This surge was driven by investors’ ongoing evaluation of the potential direction of the US Federal Reserve’s monetary policy following mixed macroeconomic data.
The US GDP for Q1 did not meet expectations, marking the slowest recovery in two years. The economy expanded by only 1.6%, significantly lower than the forecasted 2.5%. In contrast, GDP growth in Q4 2023 reached 3.4%. The Fed’s consensus forecast for 2024 expects economic growth of 2.1%.
The underwhelming economic performance might prompt the Fed to consider a reduction in interest rates. However, a localised acceleration in consumer inflation suggests that monetary policy might remain restrictive for longer.
As long as interest rates remain high, gold’s appeal as an investment option is somewhat diminished since it does not generate its yield as bonds do. Nonetheless, in times of rising inflation, gold increasingly becomes a valuable hedge against currency devaluation.
Today, the stock exchange will focus on the March Core PCE figures. These data are expected to provide further insights into the Federal Reserve’s monetary policy outlook.
Free Reports:
 Download Our Metatrader 4 Indicators – Put Our Free MetaTrader 4 Custom Indicators on your charts when you join our Weekly Newsletter
 Get our Weekly Commitment of Traders Reports - See where the biggest traders (Hedge Funds and Commercial Hedgers) are positioned in the futures markets on a weekly basis.
Technical analysis of XAU/USD
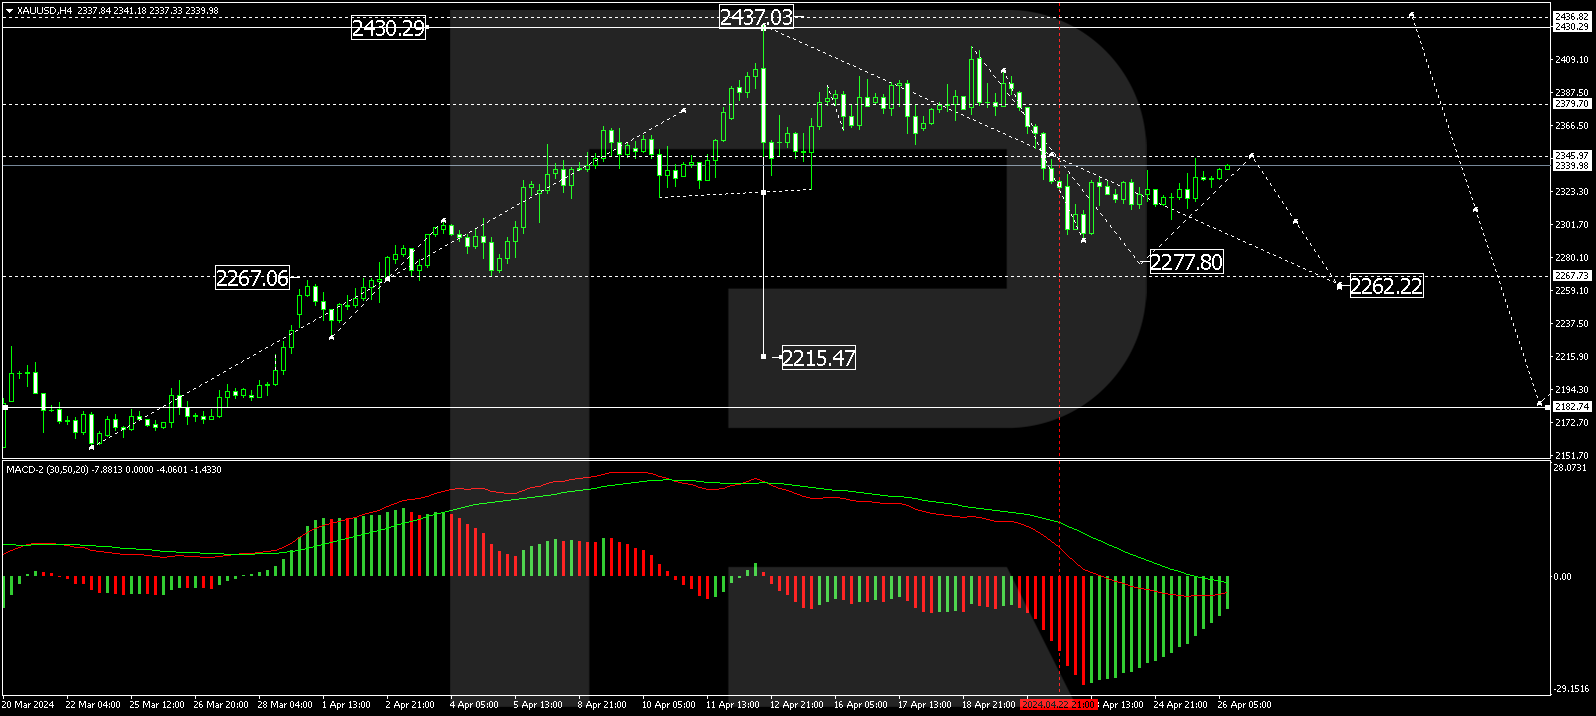
On the H4 chart of XAU/USD, a consolidation range has formed above 2346.00, with the ongoing development of the third wave of decline aiming for 2262.22. The local target for this wave at 2296.96 has been reached. Today, a corrective move towards 2346.00 is expected, followed by an anticipated further decline to 2262.22. This bearish scenario is supported technically by the MACD indicator, whose signal line is below zero and is trending downwards towards new lows.
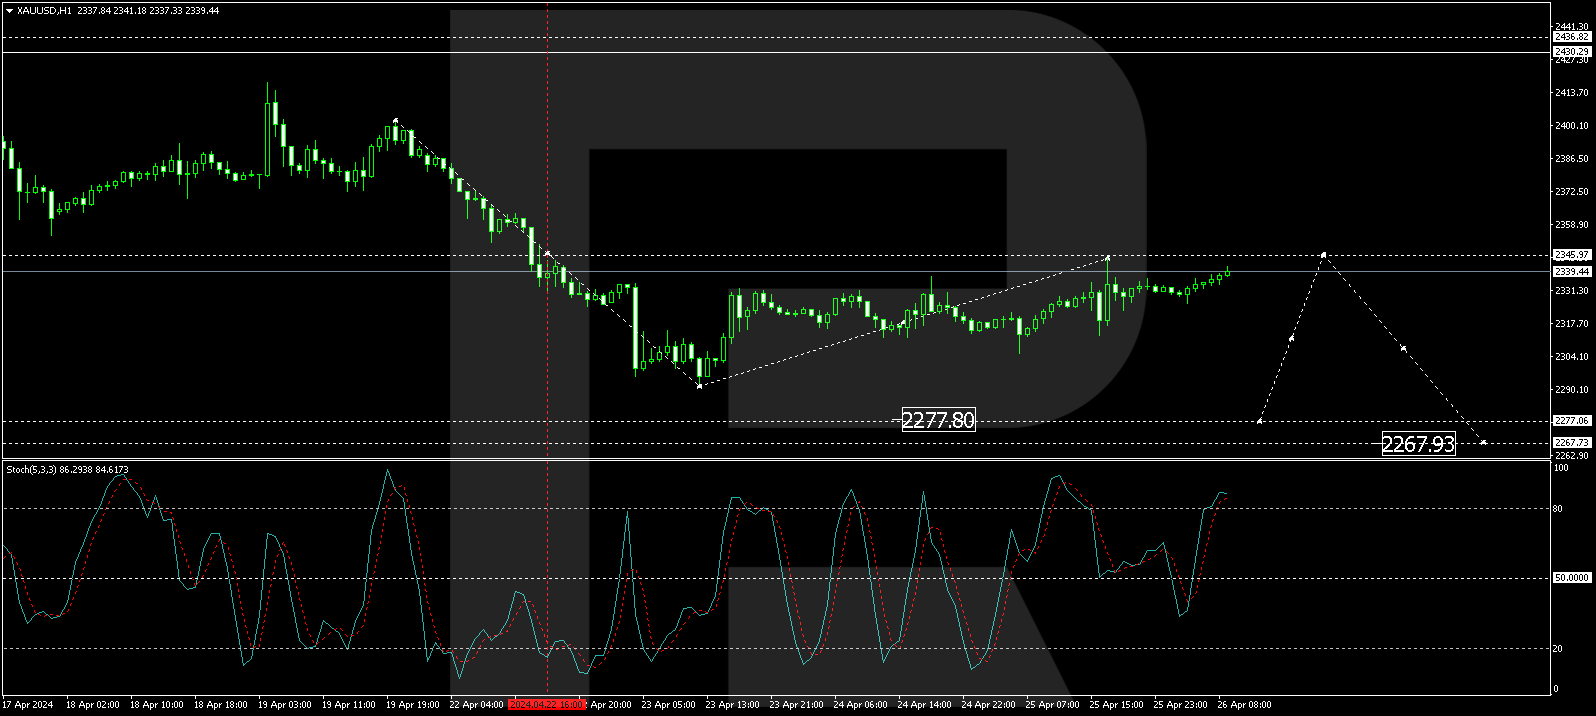
On the H1 chart, the corrective movement towards 2346.00 (testing from below) is continuing. Once completed, a new downward wave towards 2277.00 is expected, potentially reaching 2262.22. This outlook is confirmed by the Stochastic oscillator, with its signal line currently above 80 but poised for a decline towards 20.
Disclaimer
Any forecasts contained herein are based on the author’s particular opinion. This analysis may not be treated as trading advice. RoboForex bears no responsibility for trading results based on trading recommendations and reviews contained herein.

- COT Metals Charts: Weekly Speculator Changes led by Copper Jul 26, 2026
- COT Bonds Charts: Speculator Bets led by SOFR 3-Months & 5-Year Bonds Jul 26, 2026
- COT Energy Charts: Weekly Speculator Bets led by WTI Crude & Natural Gas Jul 26, 2026
- COT Soft Commodities Charts: Weekly Speculator Bets led by Corn & Soybeans Jul 26, 2026
- The US introduces new import tariffs for 60 countries. Brent crude surpasses $100 per barrel Jul 24, 2026
- USD/JPY Breaks Records: Nothing Slows the Yen’s Decline Jul 24, 2026
- Oil prices reached a 6‑week high. The AUD strengthened on the back of a strong labor‑market report Jul 23, 2026
- EUR/USD Recovers as Dollar Weakens Jul 23, 2026
- Bitcoin rose to $66,000. The New Zealand dollar continues to strengthen Jul 22, 2026
- Inflationary pressure is easing in Canada. In New Zealand, on the contrary, inflation is rising Jul 21, 2026