
By RoboForex Analytical Department
The USD/JPY pair is hovering around 155.00 on Monday, having earlier touched a new 34-year peak at 160.00. Market rumours suggest that the Japanese authorities might have intervened in the currency market, although there has been no official confirmation. Today’s market movement is particularly notable due to a public holiday in Japan, which has resulted in minimal market liquidity. This scenario made it relatively easy for investors to prompt significant changes in the quotes.
Last week, the Bank of Japan (BoJ) maintained its monetary policy foundation, keeping the interest rate steady at 0-0.1% per annum. Market participants were left disappointed, as they had anticipated a more pronounced reaction from the BoJ.
The primary driver of the yen’s ongoing weakness is the significant discrepancy between the interest rates set by the BoJ and the US Federal Reserve. This interest rate gap exerts substantial pressure on the yen, making any actual intervention largely ineffective. The BoJ, aware of this reality, has thus far limited its actions to verbal interventions to influence the yen’s value.
Technical analysis of USD/JPY
Free Reports:
 Download Our Metatrader 4 Indicators – Put Our Free MetaTrader 4 Custom Indicators on your charts when you join our Weekly Newsletter
 Get our Weekly Commitment of Traders Reports - See where the biggest traders (Hedge Funds and Commercial Hedgers) are positioned in the futures markets on a weekly basis.
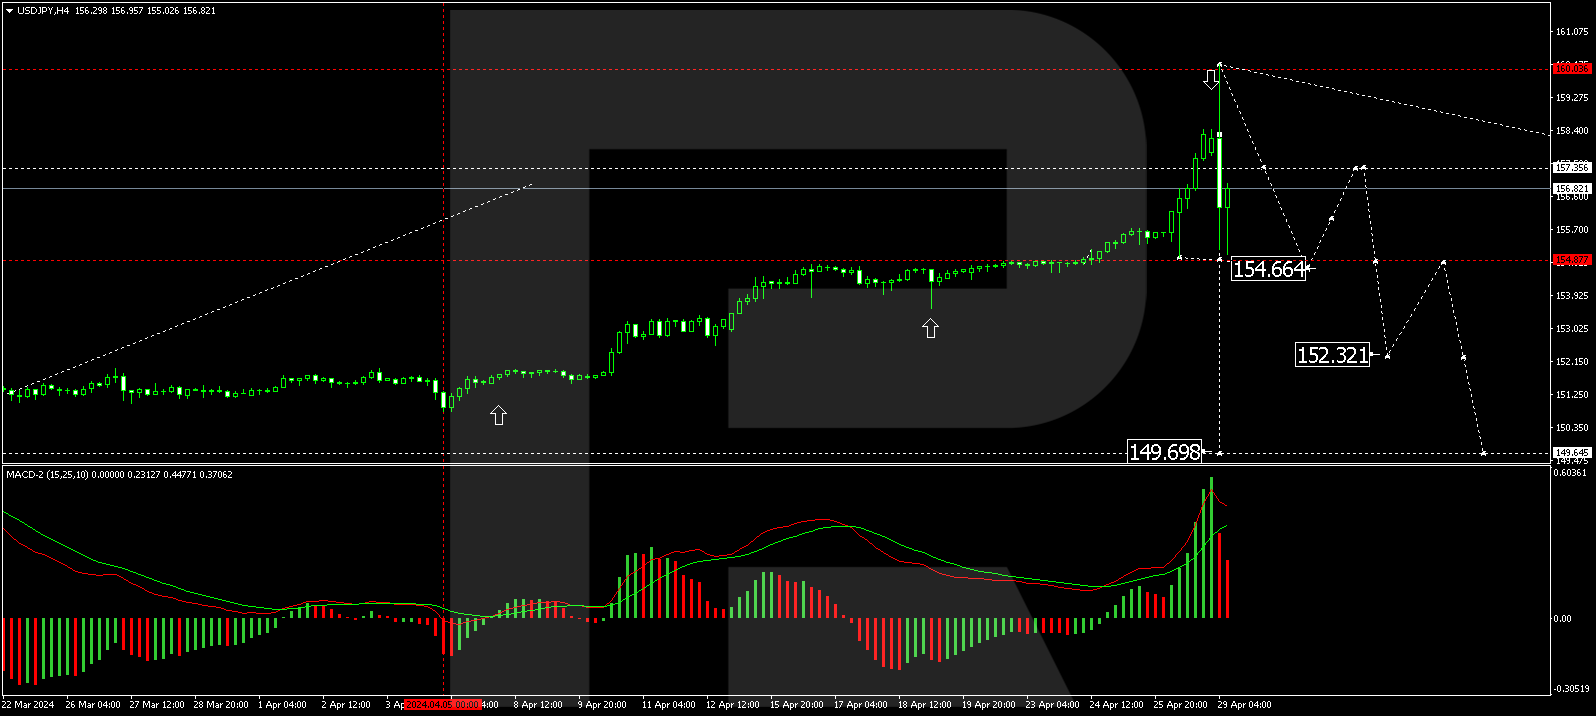
On the H4 chart of USD/JPY, a growth wave reaching the level of 160.16 was realised. The structure of the first impulse of decline to 154.70 is currently forming. Once this level is reached, a correction to 157.35 (testing from below) is anticipated, potentially followed by a new wave of decline towards 152.32, with the prospect of continuing the trend to 149.65. This scenario is technically supported by the MACD oscillator, which is positioned above zero at the highs but is expected to decline to new lows.
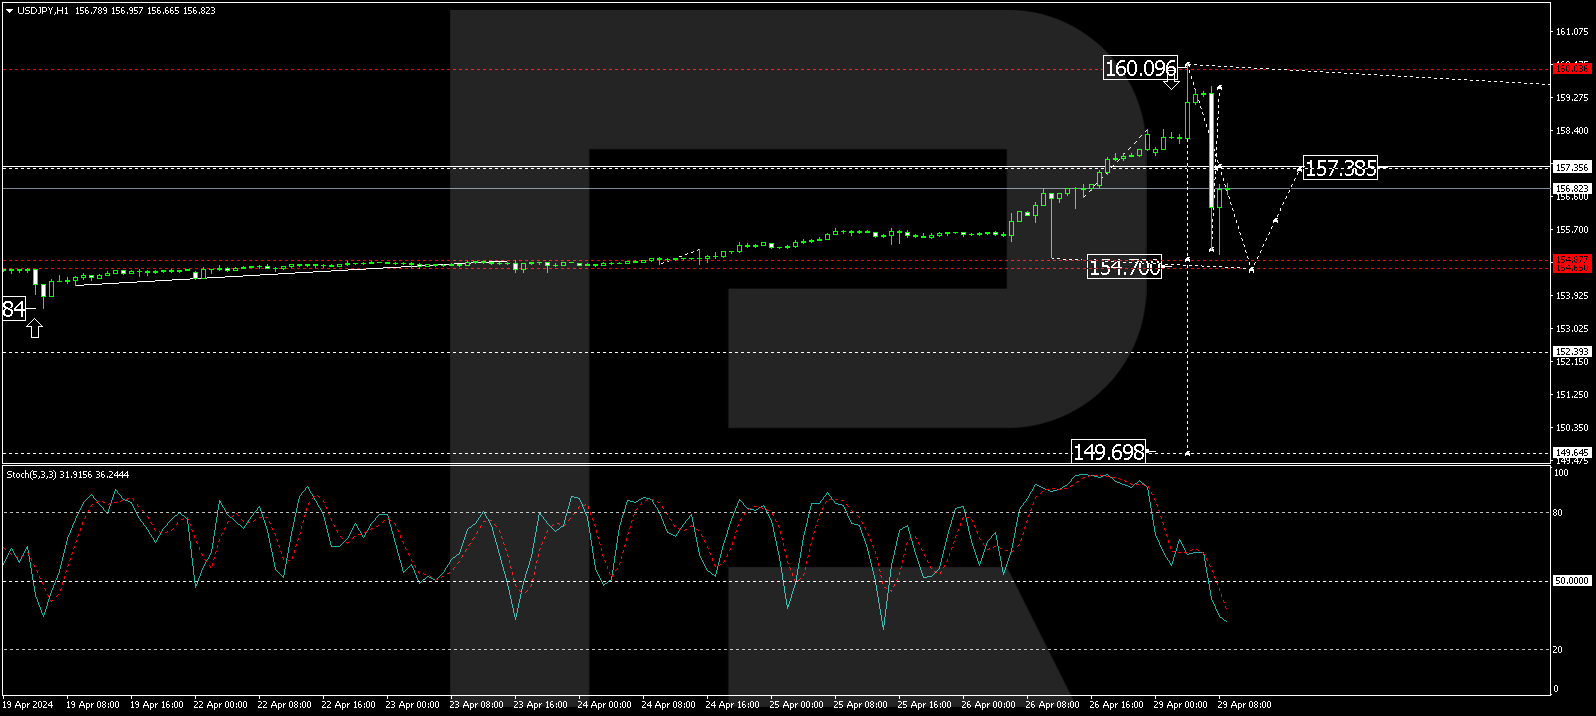
On the H1 chart, the upward growth wave to 160.16 has been completed. We are now observing the formation of the first impulse of the decline wave. The local target of this downside impulse at 155.15 has been achieved. We anticipate a corrective move to 157.35 (testing from below). Subsequently, the next phase of the downward trend to 154.65 is expected, which is the primary target. After completing this, a correction back to 157.35 may be considered. The Stochastic oscillator confirms this bearish outlook, with its signal line below 50 and pointing strictly downwards.
Disclaimer
Any forecasts contained herein are based on the author’s particular opinion. This analysis may not be treated as trading advice. RoboForex bears no responsibility for trading results based on trading recommendations and reviews contained herein.

- COT Metals Charts: Weekly Speculator Bets see small gains for Silver & Gold Jul 12, 2026
- COT Bonds Charts: Speculator Bets led by SOFR 3-Months & 2-Year Bonds Jul 12, 2026
- COT Energy Charts: Weekly Speculator Changes led by Brent Oil Jul 12, 2026
- COT Soft Commodities Charts: Weekly Speculator Changes led by Sugar, Corn & Soybeans Jul 12, 2026
- The US and European stock indices are rising again amid renewed investor interest in the AI industry. Jul 10, 2026
- USD/JPY Falls as Yen Recovers Weekly Losses Jul 10, 2026
- Crude oil prices surged sharply by 7% in reaction to the rapid escalation of the conflict in the Middle East Jul 9, 2026
- Middle East Tensions Weigh on Gold Jul 9, 2026
- Pound Awaits Tighter Policy from Bank of England Jul 8, 2026
- The United States carried out airstrikes on Iran after Iran’s attacked tankers in the Strait of Hormuz. The RBNZ raised the interest rate to 2.5% Jul 8, 2026