By JustMarkets
As of Thursday’s close, the Dow Jones Industrial Average (US30) was down 0.98%, while the S&P 500 Index (US500) lost 0.46%. The NASDAQ Technology Index (US100) closed negative 0.64%. US stock indices closed modestly lower, led by technological stock weakness. Meta Platforms (META) fell more than 10% after forecasting second-quarter revenue below consensus and raising its full-year total expense estimate. IBM (IBM) also fell more than 8% after it reported weak first-quarter earnings from its consulting division. In addition, shares of Caterpillar (CAT) fell more than 6% after the company said it expects second-quarter sales to decline from a year ago. Stock losses also accelerated after bond yields jumped on signs of a strengthening labor market when weekly jobless claims unexpectedly fell to a 2-month low, a hawkish factor for Fed policy.
US weekly initial jobless claims unexpectedly fell by 5,000 to a 2-month low of 207,000, indicating a stronger labor market than expectations of a rise to 215,000. US Q1 GDP was revised downward to 1.6% (q/q annualized) from 3.4%, weaker than expectations of 2.5%, and Q1 personal consumption was revised downward to 2.5% from 3.3%, weaker than expectations of 3.0%.
Microsoft said Thursday that its profit rose by 20% for January-March. Based on licensing the Windows operating system, Microsoft’s personal computer business earned $15.6 billion in the quarter, up 17% from a year ago. Microsoft shares rose about 4% in trading. The company said it intends to spend even more in the coming months to build infrastructure to build and operate artificial intelligence systems.
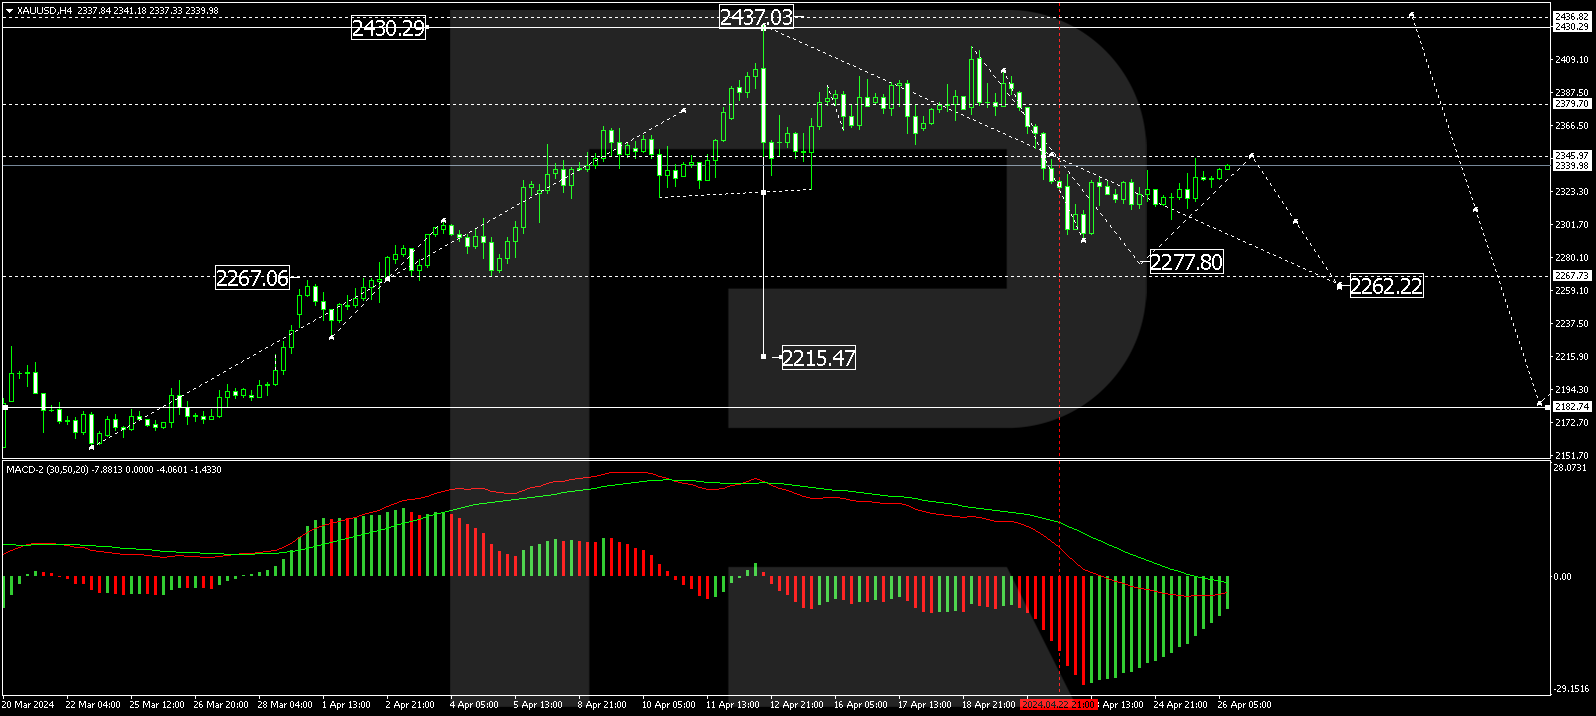
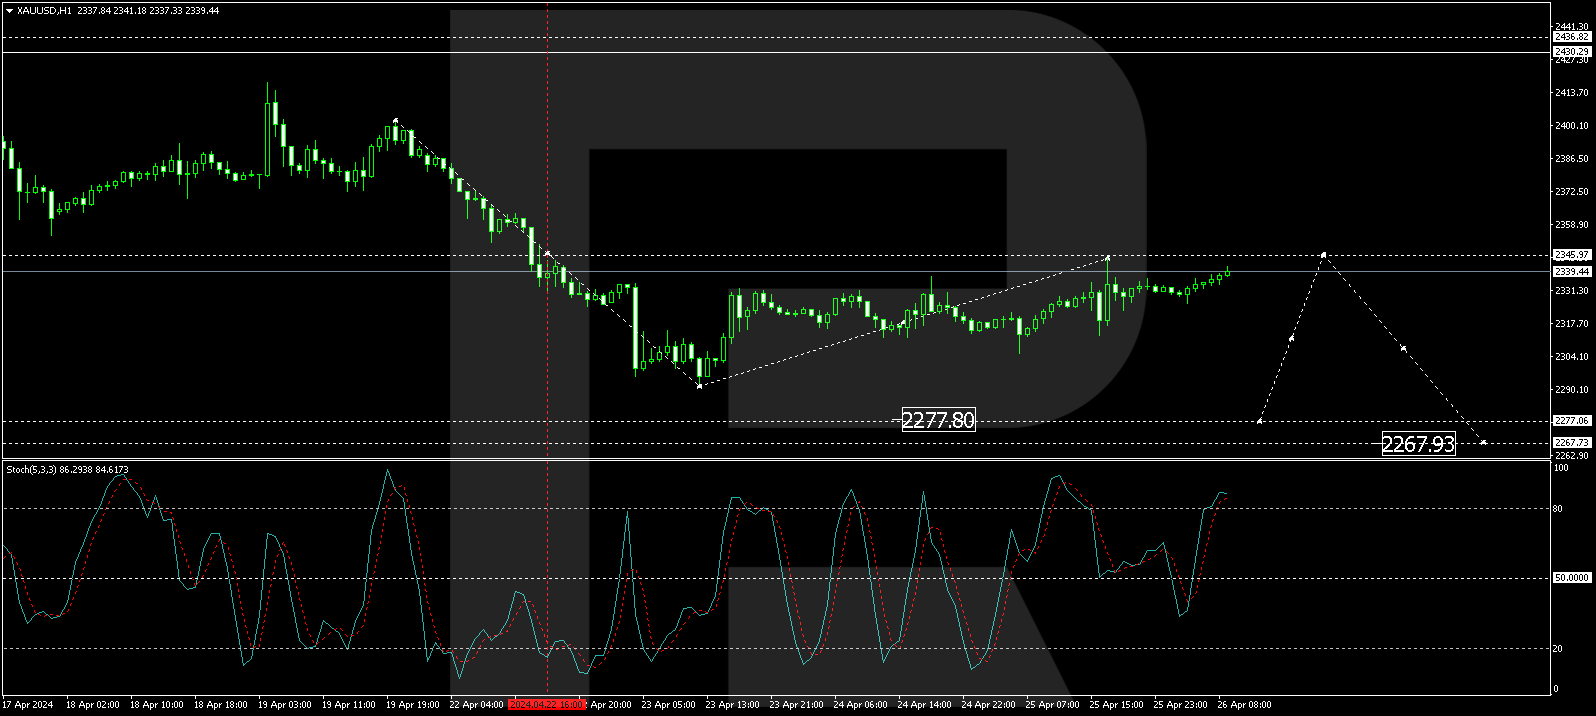
The PCE inflation report will be released in the US today. The March Personal Consumption Goods Price Index is predicted to show a mixed picture of inflationary trends, which could strengthen the US Federal Reserve’s resolve to refrain from raising interest rates. Nearly all Fed officials who have spoken recently have reiterated that the Central Bank is not ready to cut rates. Analysts at BofA expect the Fed to start cutting rates in December at quarterly intervals. For gold and indices to continue to rise, it is now crucial for inflation to continue to decline, as rising oil prices could start a new spiral of inflation unwinding.
Equity markets in Europe mostly went up yesterday. Germany’s DAX (DE40) decreased by 0.95%, France’s CAC 40 (FR40) closed down by 0.93%, Spain’s IBEX 35 (ES35) lost 0.40% cheaper, and the UK’s FTSE 100 (UK100) closed positive 0.48%. The GfK German Consumer Confidence Index for May rose by 3.1 to a 2-year high of 24.2, beating expectations of 26.0.
ECB Governing Council spokesman Muller said yesterday that he does not favor cutting interest rates for the second consecutive meeting after an expected first cut in June. His counterpart, ECB Governing Council spokesman Panetta, said ECB rate cuts need to be made soon because “unnecessary delays could leave the ECB uncomfortably close to the effective lower bound if stagflation takes root and inflation expectations fall below target.”
Asian markets were predominantly rising yesterday. Japan’s Nikkei 225 (JP225) was down 2.16%, China’s FTSE China A50 (CHA50) was up 0.52% for the day, Hong Kong’s Hang Seng (HK50) was up 0.48%, and Australia’s ASX 200 (AU200) was not trading.
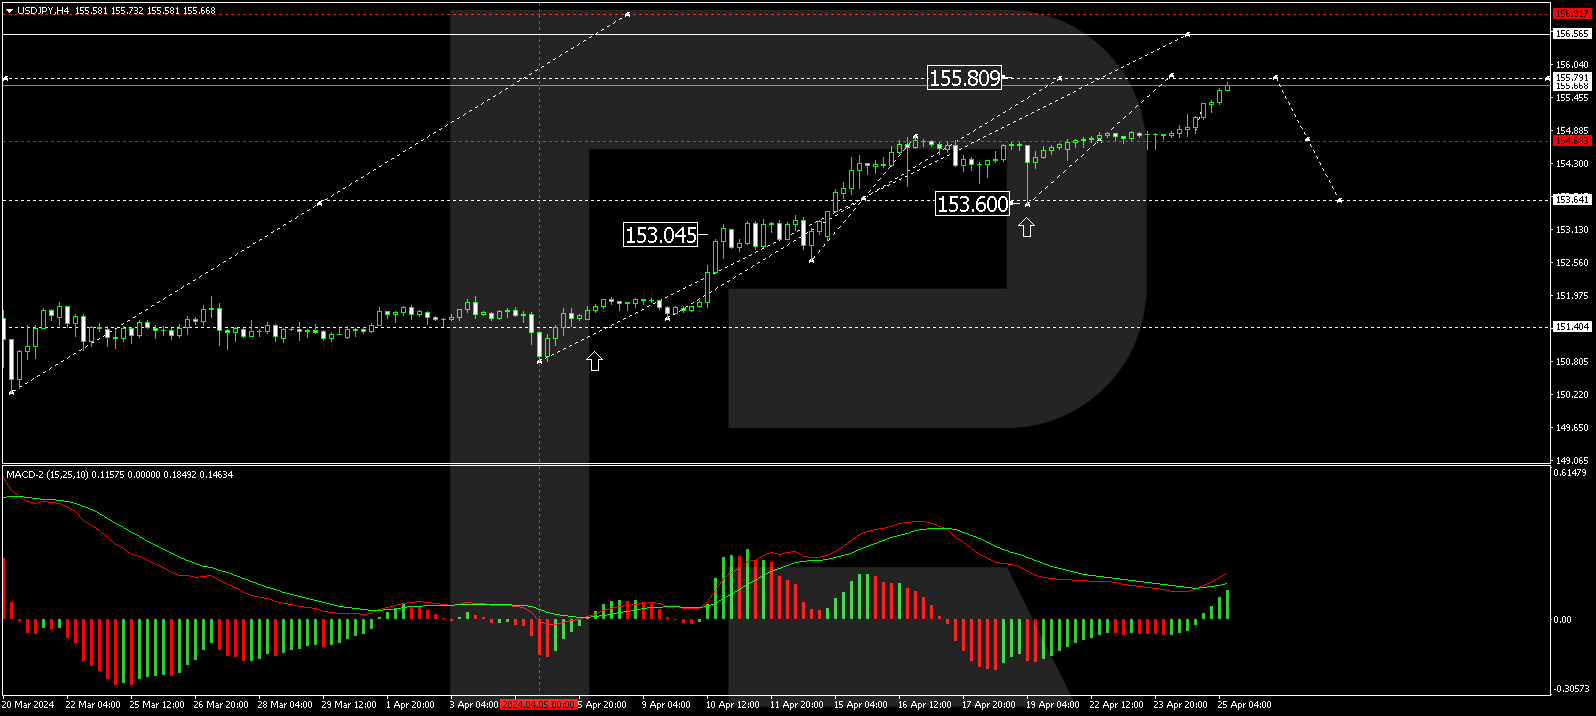
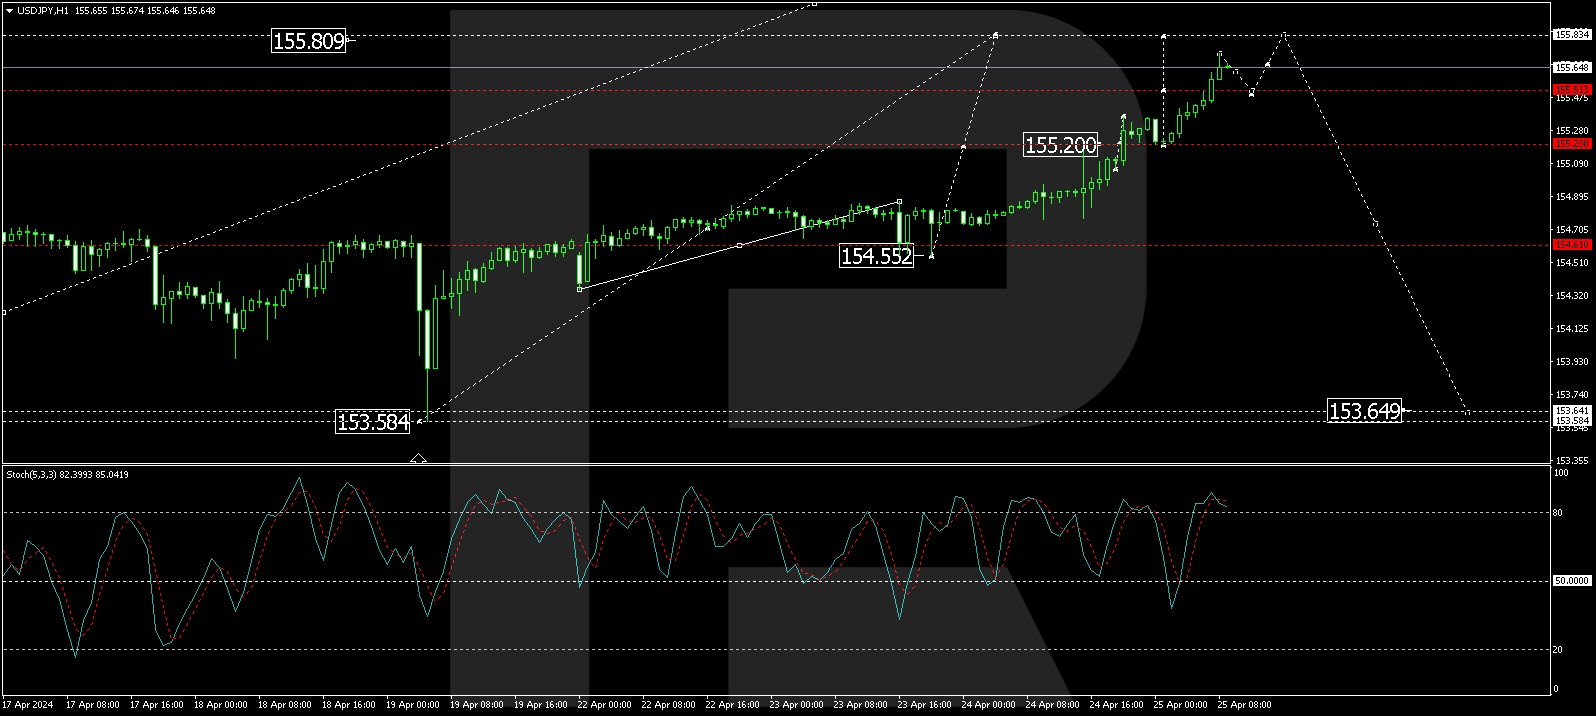
The Japanese yen fell to 156 per dollar, the first time since May 1990, as the Bank of Japan (BoJ) left interest rates unchanged despite pressure from the sharply declining currency. Meanwhile, the Central Bank revised its inflation forecasts and said the economy will likely continue growing healthy. Investors also reacted to data that Tokyo’s core inflation rate slowed to a two-year low of 1.6% in April. The yen has lost about 10% against the dollar this year as the Bank of Japan kept rates near zero despite interest rate hikes in other major economies, prompting traders to borrow yen and invest in higher-yielding currencies.
S&P 500 (US500) 5,048.42 −23.21 (−0.46%)
Dow Jones (US30) 38,085.80 −375.12 (−0.98%)
DAX (DE40) 17,917.28 −171.42 (−0.95%)
FTSE 100 (UK100) 8,078.86 +38.48 (+0.48%)
USD Index 105.57 −0.28 (−0.27%)
- – Japan Tokyo Core CPI (m/m) at 02:30 (GMT+3);
- – Australia Producer Price Index (q/q) at 04:30 (GMT+3);
- – Japan BoJ Monetary Policy Statement at 06:00 (GMT+3);
- – Japan BoJ Interest Rate Decision at 06:00 (GMT+3);
- – Japan BoJ Outlook Report at 06:00 (GMT+3);
- – Japan BoJ Press Conference at 09:30 (GMT+3);
- – Switzerland SNB Chairman Thomas Jordan speaks at 11:00 (GMT+3);
- – US PCE Price Index (m/m) at 15:30 (GMT+3);
- – US Michigan Consumer Sentiment (m/m) at 17:00 (GMT+3).
By JustMarkets
This article reflects a personal opinion and should not be interpreted as an investment advice, and/or offer, and/or a persistent request for carrying out financial transactions, and/or a guarantee, and/or a forecast of future events.