By InvestMacro
Here are the latest charts and statistics for the Commitment of Traders (COT) data published by the Commodities Futures Trading Commission (CFTC).
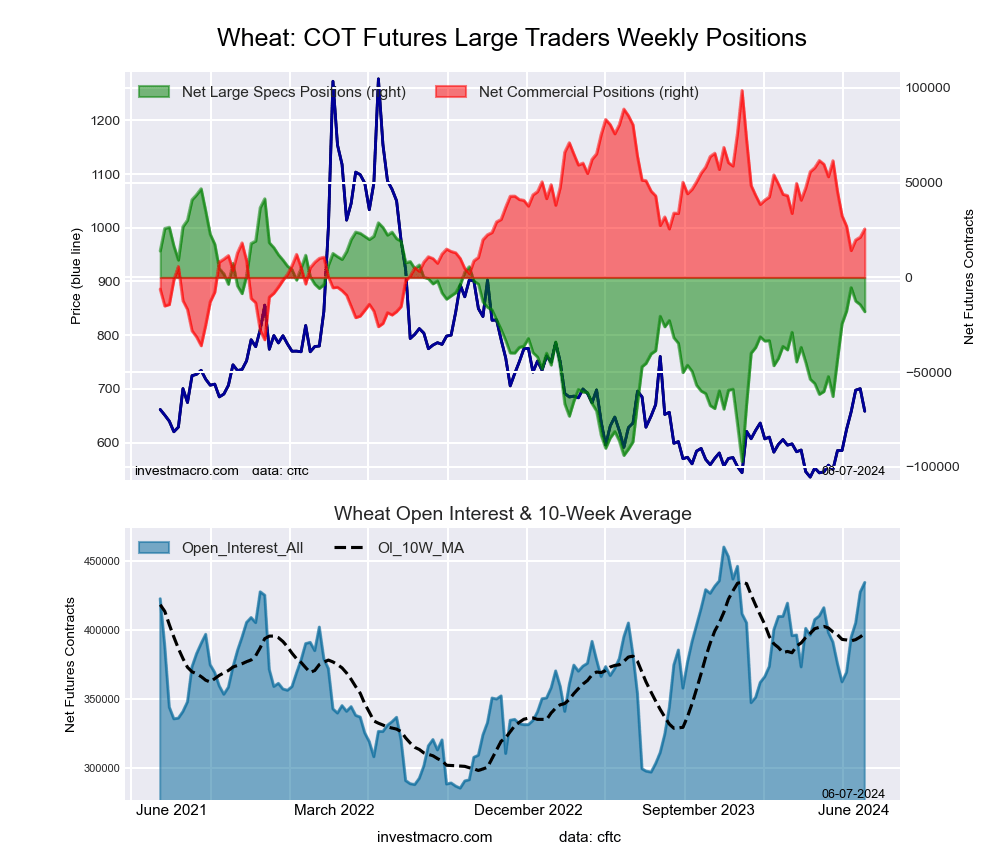
The latest COT data is updated through Tuesday June 4th and shows a quick view of how large traders (for-profit speculators and commercial entities) were positioned in the futures markets.
Weekly Speculator Bets led lower by Platinum & Copper
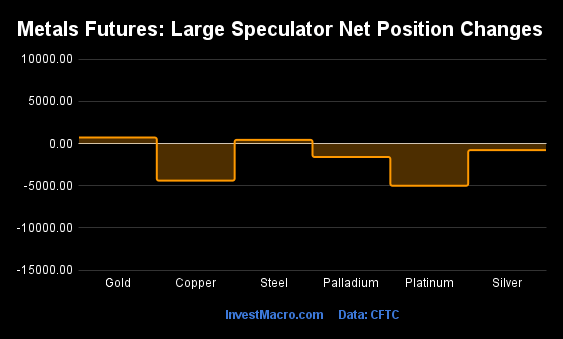
The COT metals markets speculator bets were lower this week as just two out of the six metals markets we cover had higher positioning while the other four markets had lower speculator contracts.
Leading the gains for the metals was Gold (717 contracts) with Steel (441 contracts) also showing a positive week.
The markets with declines in speculator bets for the week were Platinum (-5,001 contracts), Copper (-4,395 contracts), Palladium (-1,593 contracts) and with Silver (-780 contracts) also registering lower bets on the week.
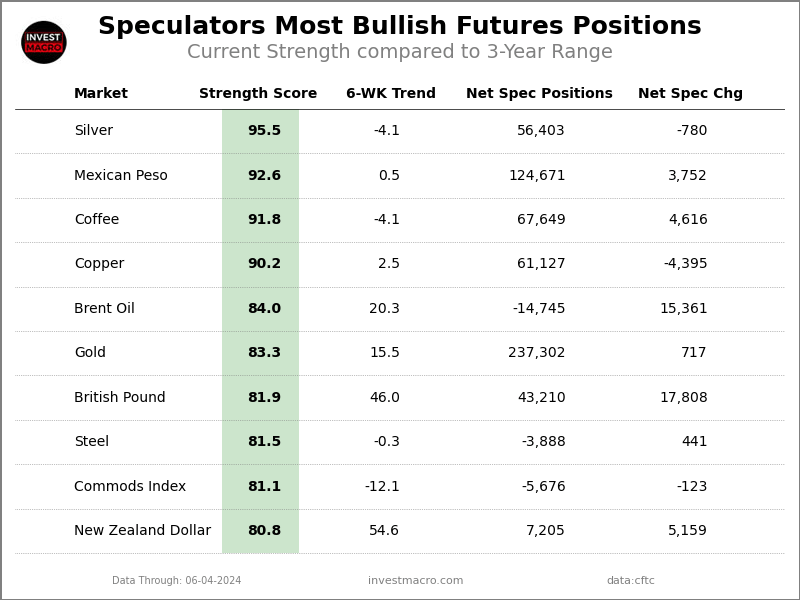
Metals Net Speculators Leaderboard
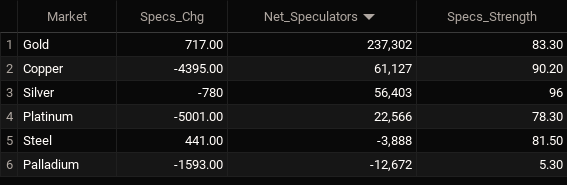
Legend: Weekly Speculators Change | Speculators Current Net Position | Speculators Strength Score compared to last 3-Years (0-100 range)
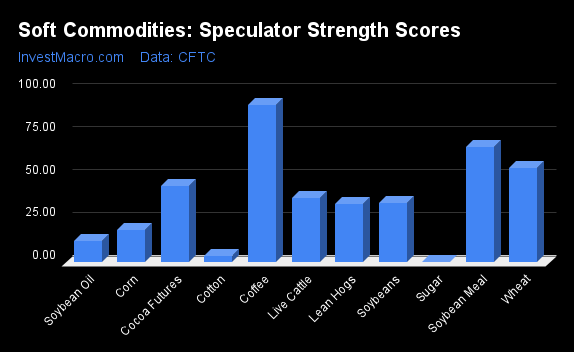
Strength Scores led by Silver & Copper
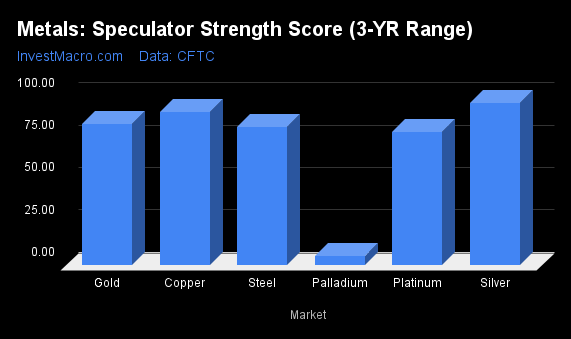
COT Strength Scores (a normalized measure of Speculator positions over a 3-Year range, from 0 to 100 where above 80 is Extreme-Bullish and below 20 is Extreme-Bearish) showed that Silver (96 percent) and Copper (90 percent) lead the metals markets this week. Gold (83 percent), Steel (82 percent) and Platinum (78 percent) come in as the next highest in the weekly strength scores.
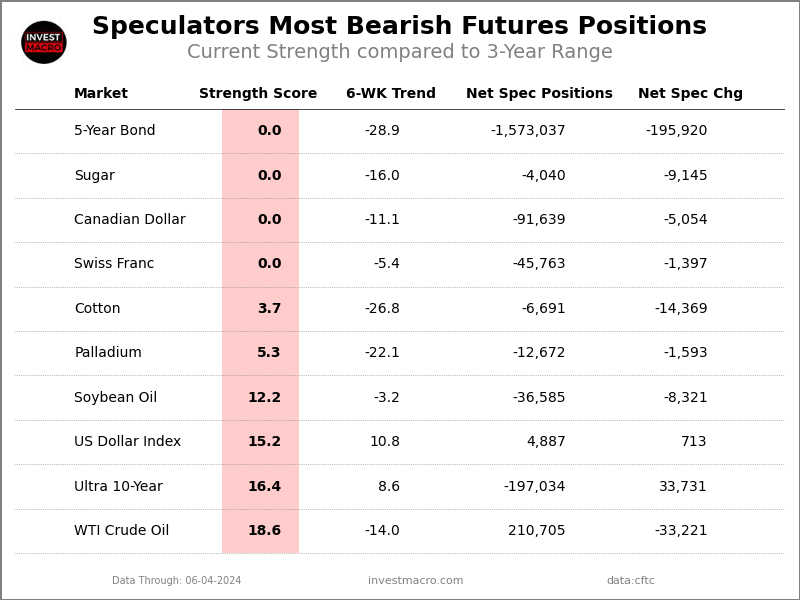
On the downside, Palladium (5 percent) comes in at the lowest strength level currently and is in Extreme-Bearish territory (below 20 percent).
Strength Statistics:
Gold (83.3 percent) vs Gold previous week (83.0 percent)
Silver (95.5 percent) vs Silver previous week (96.6 percent)
Copper (90.2 percent) vs Copper previous week (94.3 percent)
Platinum (78.3 percent) vs Platinum previous week (91.6 percent)
Palladium (5.3 percent) vs Palladium previous week (15.3 percent)
Steel (81.5 percent) vs Palladium previous week (79.8 percent)
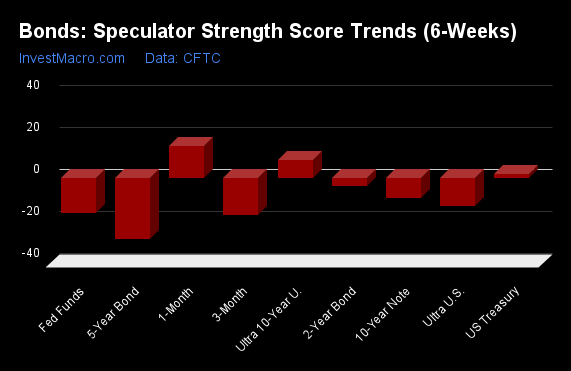
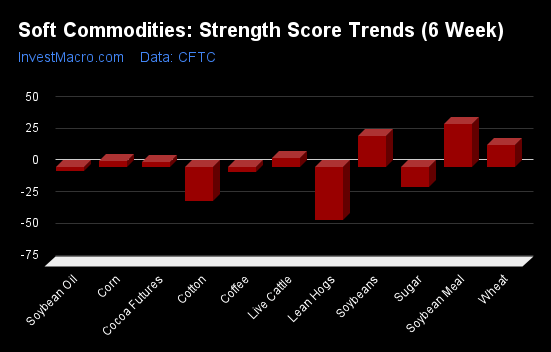
Platinum & Gold top the 6-Week Strength Trends
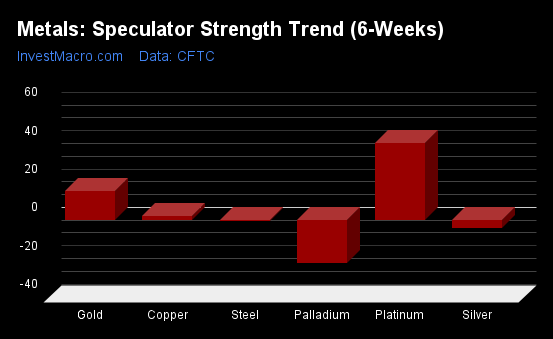
COT Strength Score Trends (or move index, calculates the 6-week changes in strength scores) showed that Platinum (40 percent) and Gold (15 percent) lead the past six weeks trends for metals.
Palladium (-22 percent) leads the downside trend scores currently with Silver (-4 percent) as the next market with lower trend scores.
Move Statistics:
Gold (15.5 percent) vs Gold previous week (15.6 percent)
Silver (-4.1 percent) vs Silver previous week (5.3 percent)
Copper (2.5 percent) vs Copper previous week (16.7 percent)
Platinum (40.3 percent) vs Platinum previous week (24.9 percent)
Palladium (-22.1 percent) vs Palladium previous week (-12.9 percent)
Steel (-0.3 percent) vs Steel previous week (-6.1 percent)
Individual Markets:
Gold Comex Futures:
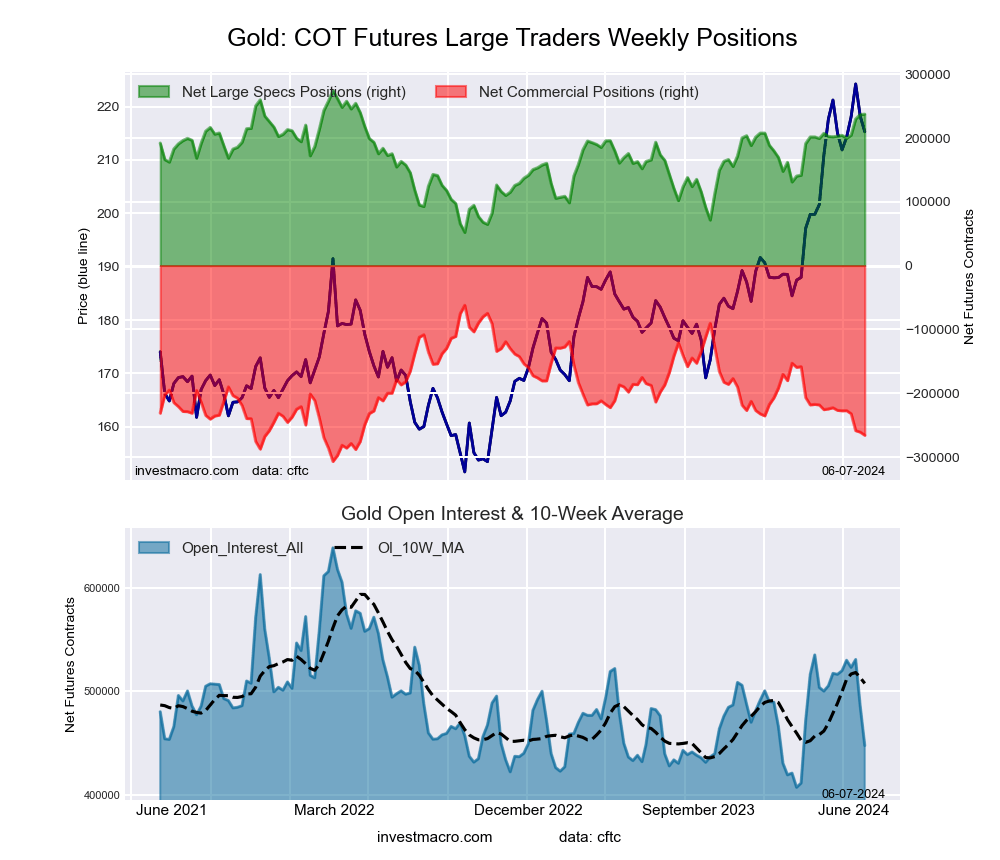 The Gold Comex Futures large speculator standing this week equaled a net position of 237,302 contracts in the data reported through Tuesday. This was a weekly rise of 717 contracts from the previous week which had a total of 236,585 net contracts.
This week’s current strength score (the trader positioning range over the past three years, measured from 0 to 100) shows the speculators are currently Bullish-Extreme with a score of 83.3 percent. The commercials are Bearish-Extreme with a score of 16.8 percent and the small traders (not shown in chart) are Bullish with a score of 66.1 percent.
Price Trend-Following Model: Uptrend
Our weekly trend-following model classifies the current market price position as: Uptrend. The current action for the model is considered to be: Hold – Maintain Long Position.
| Gold Futures Statistics | SPECULATORS | COMMERCIALS | SMALL TRADERS |
| – Percent of Open Interest Longs: | 63.6 | 18.6 | 11.1 |
| – Percent of Open Interest Shorts: | 10.6 | 78.1 | 4.7 |
| – Net Position: | 237,302 | -265,931 | 28,629 |
| – Gross Longs: | 284,566 | 83,418 | 49,807 |
| – Gross Shorts: | 47,264 | 349,349 | 21,178 |
| – Long to Short Ratio: | 6.0 to 1 | 0.2 to 1 | 2.4 to 1 |
| NET POSITION TREND: | |||
| – Strength Index Score (3 Year Range Pct): | 83.3 | 16.8 | 66.1 |
| – Strength Index Reading (3 Year Range): | Bullish-Extreme | Bearish-Extreme | Bullish |
| NET POSITION MOVEMENT INDEX: | |||
| – 6-Week Change in Strength Index: | 15.5 | -16.0 | 14.9 |
Silver Comex Futures:
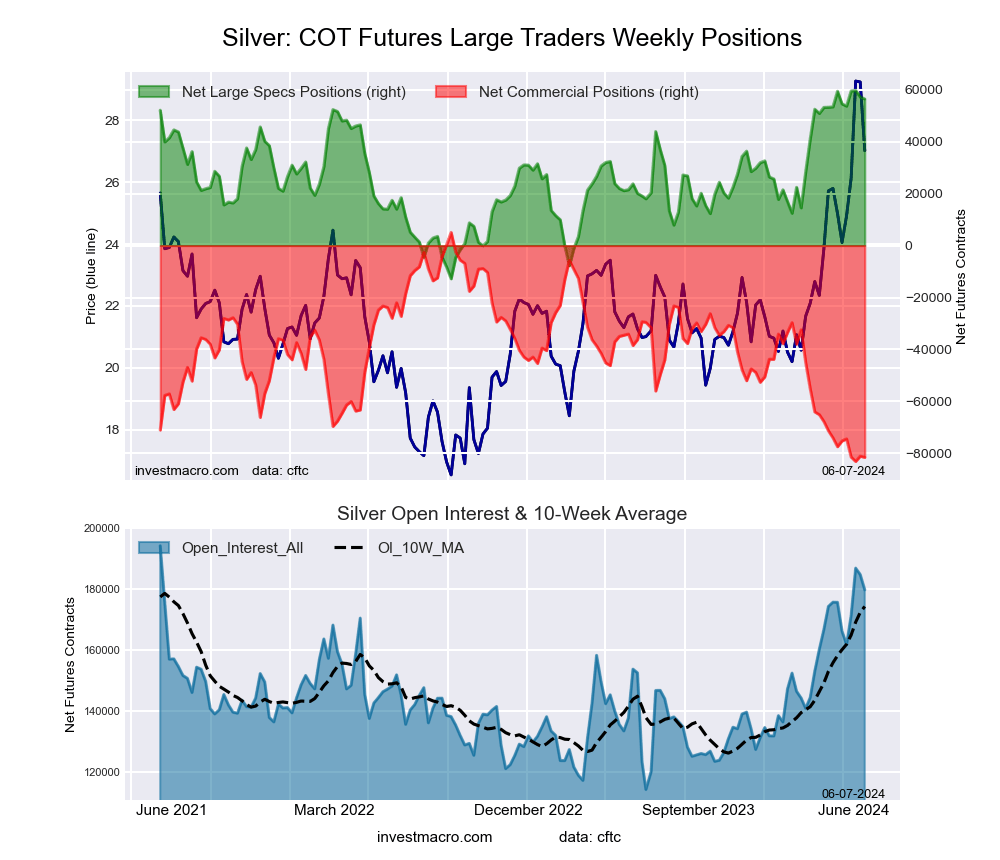 The Silver Comex Futures large speculator standing this week equaled a net position of 56,403 contracts in the data reported through Tuesday. This was a weekly decrease of -780 contracts from the previous week which had a total of 57,183 net contracts.
This week’s current strength score (the trader positioning range over the past three years, measured from 0 to 100) shows the speculators are currently Bullish-Extreme with a score of 95.5 percent. The commercials are Bearish-Extreme with a score of 1.8 percent and the small traders (not shown in chart) are Bullish-Extreme with a score of 100.0 percent.
Price Trend-Following Model: Uptrend
Our weekly trend-following model classifies the current market price position as: Uptrend. The current action for the model is considered to be: Hold – Maintain Long Position.
| Silver Futures Statistics | SPECULATORS | COMMERCIALS | SMALL TRADERS |
| – Percent of Open Interest Longs: | 49.3 | 23.0 | 19.9 |
| – Percent of Open Interest Shorts: | 17.9 | 68.3 | 5.9 |
| – Net Position: | 56,403 | -81,520 | 25,117 |
| – Gross Longs: | 88,604 | 41,280 | 35,798 |
| – Gross Shorts: | 32,201 | 122,800 | 10,681 |
| – Long to Short Ratio: | 2.8 to 1 | 0.3 to 1 | 3.4 to 1 |
| NET POSITION TREND: | |||
| – Strength Index Score (3 Year Range Pct): | 95.5 | 1.8 | 100.0 |
| – Strength Index Reading (3 Year Range): | Bullish-Extreme | Bearish-Extreme | Bullish-Extreme |
| NET POSITION MOVEMENT INDEX: | |||
| – 6-Week Change in Strength Index: | -4.1 | -4.7 | 37.1 |
Copper Grade #1 Futures:
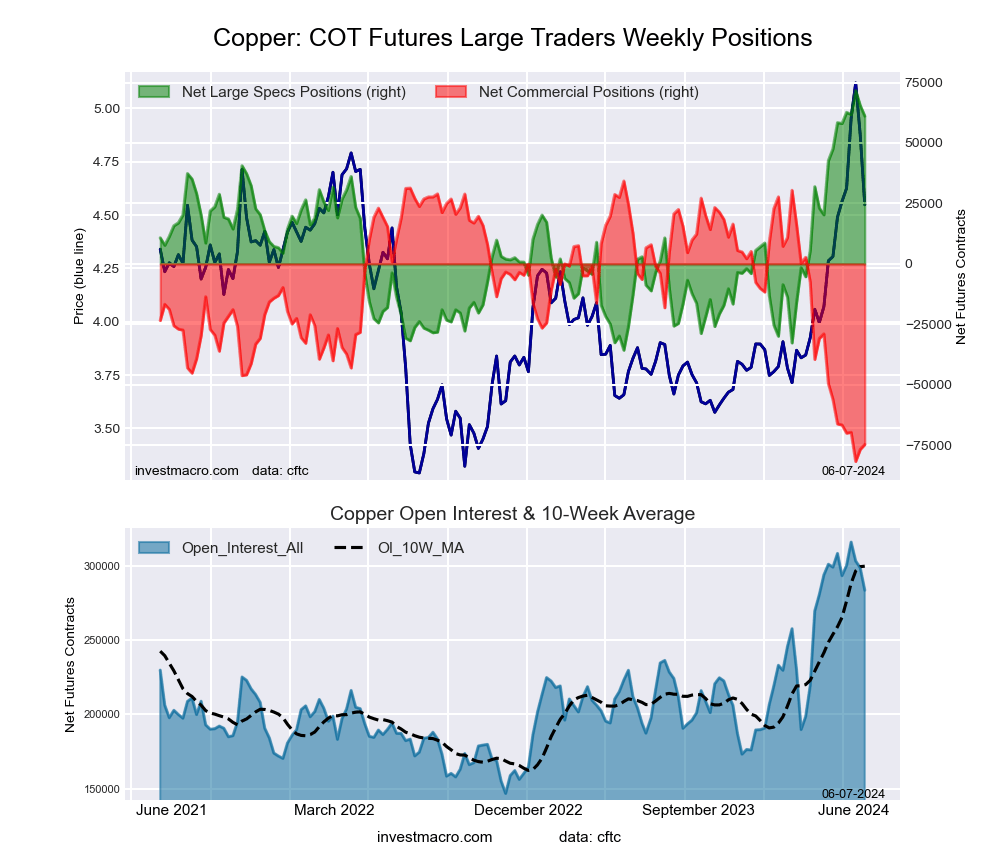 The Copper Grade #1 Futures large speculator standing this week equaled a net position of 61,127 contracts in the data reported through Tuesday. This was a weekly decrease of -4,395 contracts from the previous week which had a total of 65,522 net contracts.
This week’s current strength score (the trader positioning range over the past three years, measured from 0 to 100) shows the speculators are currently Bullish-Extreme with a score of 90.2 percent. The commercials are Bearish-Extreme with a score of 6.0 percent and the small traders (not shown in chart) are Bullish-Extreme with a score of 100.0 percent.
Price Trend-Following Model: Uptrend
Our weekly trend-following model classifies the current market price position as: Uptrend. The current action for the model is considered to be: Hold – Maintain Long Position.
| Copper Futures Statistics | SPECULATORS | COMMERCIALS | SMALL TRADERS |
| – Percent of Open Interest Longs: | 50.3 | 27.9 | 8.4 |
| – Percent of Open Interest Shorts: | 28.8 | 54.3 | 3.6 |
| – Net Position: | 61,127 | -74,715 | 13,588 |
| – Gross Longs: | 142,712 | 79,249 | 23,922 |
| – Gross Shorts: | 81,585 | 153,964 | 10,334 |
| – Long to Short Ratio: | 1.7 to 1 | 0.5 to 1 | 2.3 to 1 |
| NET POSITION TREND: | |||
| – Strength Index Score (3 Year Range Pct): | 90.2 | 6.0 | 100.0 |
| – Strength Index Reading (3 Year Range): | Bullish-Extreme | Bearish-Extreme | Bullish-Extreme |
| NET POSITION MOVEMENT INDEX: | |||
| – 6-Week Change in Strength Index: | 2.5 | -7.3 | 35.0 |
Platinum Futures:
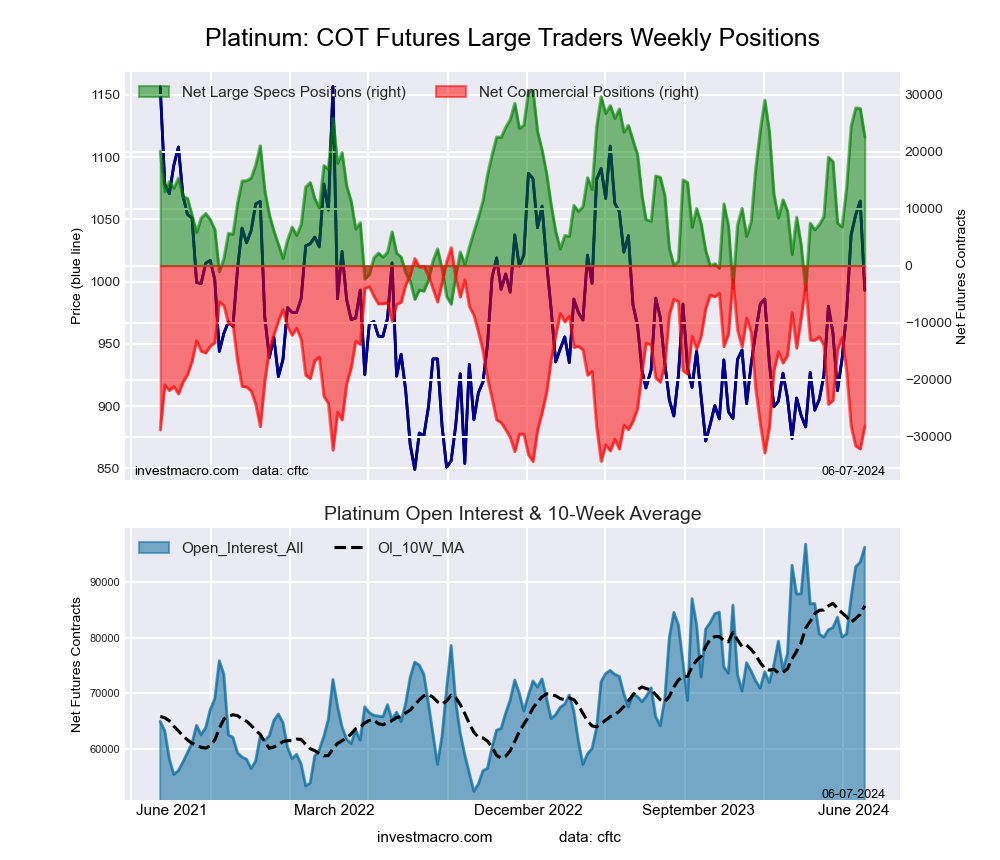 The Platinum Futures large speculator standing this week equaled a net position of 22,566 contracts in the data reported through Tuesday. This was a weekly lowering of -5,001 contracts from the previous week which had a total of 27,567 net contracts.
This week’s current strength score (the trader positioning range over the past three years, measured from 0 to 100) shows the speculators are currently Bullish with a score of 78.3 percent. The commercials are Bearish-Extreme with a score of 16.6 percent and the small traders (not shown in chart) are Bullish with a score of 50.1 percent.
Price Trend-Following Model: Uptrend
Our weekly trend-following model classifies the current market price position as: Uptrend. The current action for the model is considered to be: Hold – Maintain Long Position.
| Platinum Futures Statistics | SPECULATORS | COMMERCIALS | SMALL TRADERS |
| – Percent of Open Interest Longs: | 58.6 | 20.0 | 9.9 |
| – Percent of Open Interest Shorts: | 35.1 | 49.2 | 4.1 |
| – Net Position: | 22,566 | -28,123 | 5,557 |
| – Gross Longs: | 56,389 | 19,250 | 9,537 |
| – Gross Shorts: | 33,823 | 47,373 | 3,980 |
| – Long to Short Ratio: | 1.7 to 1 | 0.4 to 1 | 2.4 to 1 |
| NET POSITION TREND: | |||
| – Strength Index Score (3 Year Range Pct): | 78.3 | 16.6 | 50.1 |
| – Strength Index Reading (3 Year Range): | Bullish | Bearish-Extreme | Bullish |
| NET POSITION MOVEMENT INDEX: | |||
| – 6-Week Change in Strength Index: | 40.3 | -35.5 | -27.9 |
Palladium Futures:
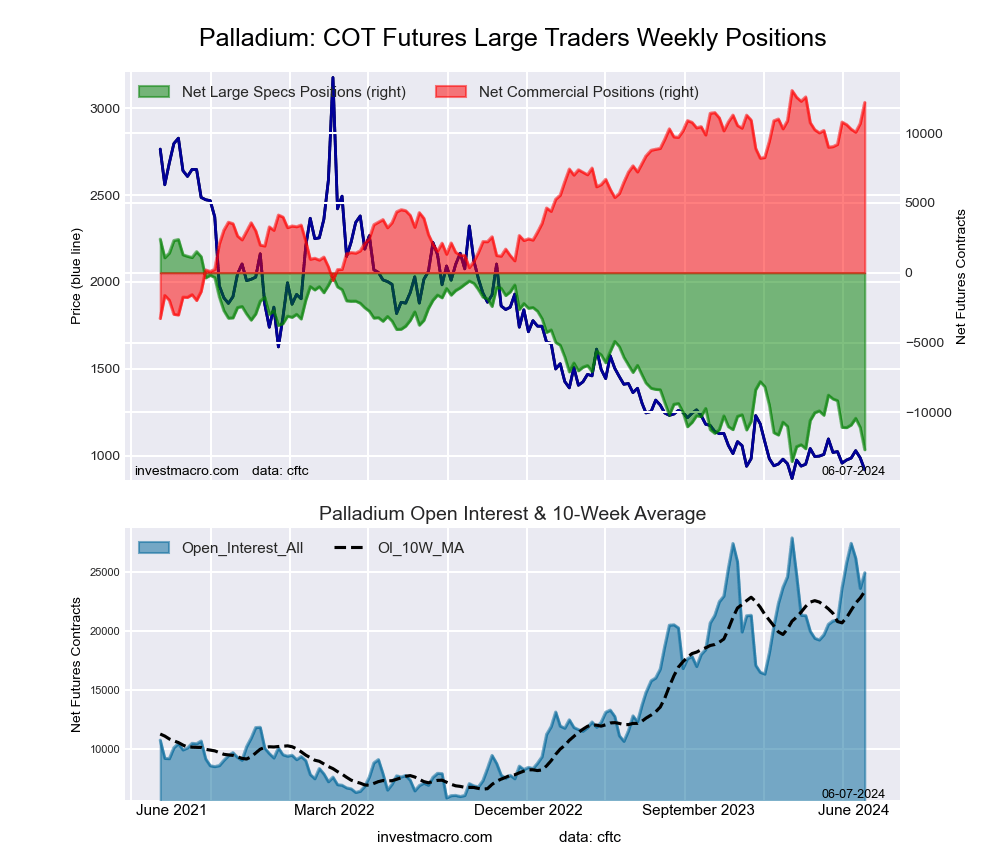 The Palladium Futures large speculator standing this week equaled a net position of -12,672 contracts in the data reported through Tuesday. This was a weekly lowering of -1,593 contracts from the previous week which had a total of -11,079 net contracts.
This week’s current strength score (the trader positioning range over the past three years, measured from 0 to 100) shows the speculators are currently Bearish-Extreme with a score of 5.3 percent. The commercials are Bullish-Extreme with a score of 94.8 percent and the small traders (not shown in chart) are Bullish with a score of 70.7 percent.
Price Trend-Following Model: Weak Uptrend
Our weekly trend-following model classifies the current market price position as: Weak Uptrend. The current action for the model is considered to be: Hold – Maintain Long Position.
| Palladium Futures Statistics | SPECULATORS | COMMERCIALS | SMALL TRADERS |
| – Percent of Open Interest Longs: | 29.5 | 56.9 | 9.1 |
| – Percent of Open Interest Shorts: | 80.3 | 7.9 | 7.2 |
| – Net Position: | -12,672 | 12,189 | 483 |
| – Gross Longs: | 7,342 | 14,165 | 2,266 |
| – Gross Shorts: | 20,014 | 1,976 | 1,783 |
| – Long to Short Ratio: | 0.4 to 1 | 7.2 to 1 | 1.3 to 1 |
| NET POSITION TREND: | |||
| – Strength Index Score (3 Year Range Pct): | 5.3 | 94.8 | 70.7 |
| – Strength Index Reading (3 Year Range): | Bearish-Extreme | Bullish-Extreme | Bullish |
| NET POSITION MOVEMENT INDEX: | |||
| – 6-Week Change in Strength Index: | -22.1 | 18.4 | 30.8 |
Steel Futures Futures:
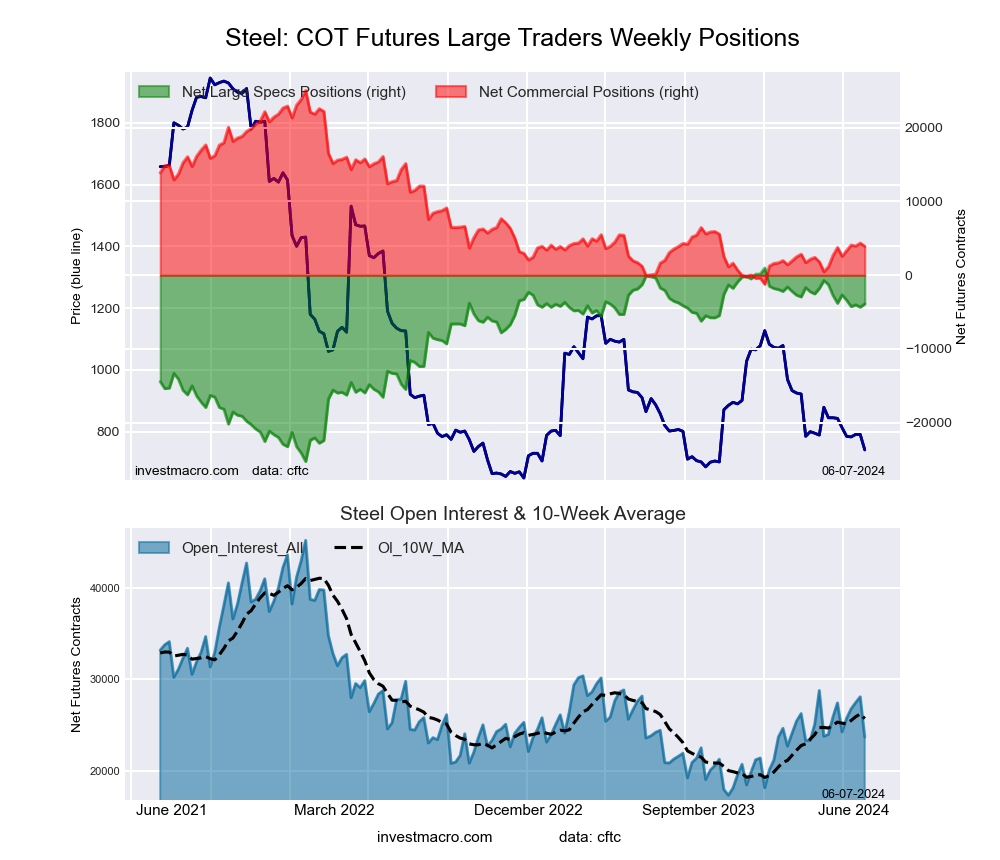 The Steel Futures large speculator standing this week equaled a net position of -3,888 contracts in the data reported through Tuesday. This was a weekly advance of 441 contracts from the previous week which had a total of -4,329 net contracts.
This week’s current strength score (the trader positioning range over the past three years, measured from 0 to 100) shows the speculators are currently Bullish-Extreme with a score of 81.5 percent. The commercials are Bearish-Extreme with a score of 19.6 percent and the small traders (not shown in chart) are Bearish with a score of 28.7 percent.
Price Trend-Following Model: Downtrend
Our weekly trend-following model classifies the current market price position as: Downtrend. The current action for the model is considered to be: Hold – Maintain Short Position.
| Steel Futures Statistics | SPECULATORS | COMMERCIALS | SMALL TRADERS |
| – Percent of Open Interest Longs: | 17.4 | 77.4 | 1.3 |
| – Percent of Open Interest Shorts: | 33.8 | 60.8 | 1.4 |
| – Net Position: | -3,888 | 3,922 | -34 |
| – Gross Longs: | 4,111 | 18,328 | 303 |
| – Gross Shorts: | 7,999 | 14,406 | 337 |
| – Long to Short Ratio: | 0.5 to 1 | 1.3 to 1 | 0.9 to 1 |
| NET POSITION TREND: | |||
| – Strength Index Score (3 Year Range Pct): | 81.5 | 19.6 | 28.7 |
| – Strength Index Reading (3 Year Range): | Bullish-Extreme | Bearish-Extreme | Bearish |
| NET POSITION MOVEMENT INDEX: | |||
| – 6-Week Change in Strength Index: | -0.3 | 0.6 | -8.1 |
Article By InvestMacro – Receive our weekly COT Newsletter
*COT Report: The COT data, released weekly to the public each Friday, is updated through the most recent Tuesday (data is 3 days old) and shows a quick view of how large speculators or non-commercials (for-profit traders) were positioned in the futures markets.
The CFTC categorizes trader positions according to commercial hedgers (traders who use futures contracts for hedging as part of the business), non-commercials (large traders who speculate to realize trading profits) and nonreportable traders (usually small traders/speculators) as well as their open interest (contracts open in the market at time of reporting). See CFTC criteria here.