
By RoboForex Analytical Department
At the end of the week, the US dollar is hovering around an eight-week low against the euro, but trading activity remains subdued. Everyone is conserving energy ahead of this evening’s May employment data from the US. These reports are expected to provide more insight into the timing of the Federal Reserve’s monetary policy easing.
Yesterday, the European Central Bank lowered its interest rate by 25 basis points, from 4.50% to 4.25% per annum. The euro retained its daily gains. The ECB gave few indications about its future steps, and the market remains uncertain whether there will be further rate cuts. Persistent inflationary pressures dim the prospects for the ECB.
In its comments, the ECB mentioned that the consumer price index will remain above the target of 2% until the end of next year.
The market is preparing for relatively soft non-farm payroll (NFP) data from the US. The final figure may fall below the forecast of 185,000.
Investor expectations regarding the Federal Reserve’s decisions are constantly shifting. The market now predicts the first rate cut in September, followed by another in November.
Free Reports:
 Get our Weekly Commitment of Traders Reports - See where the biggest traders (Hedge Funds and Commercial Hedgers) are positioned in the futures markets on a weekly basis.
 Download Our Metatrader 4 Indicators – Put Our Free MetaTrader 4 Custom Indicators on your charts when you join our Weekly Newsletter
EUR/USD Technical Analysis
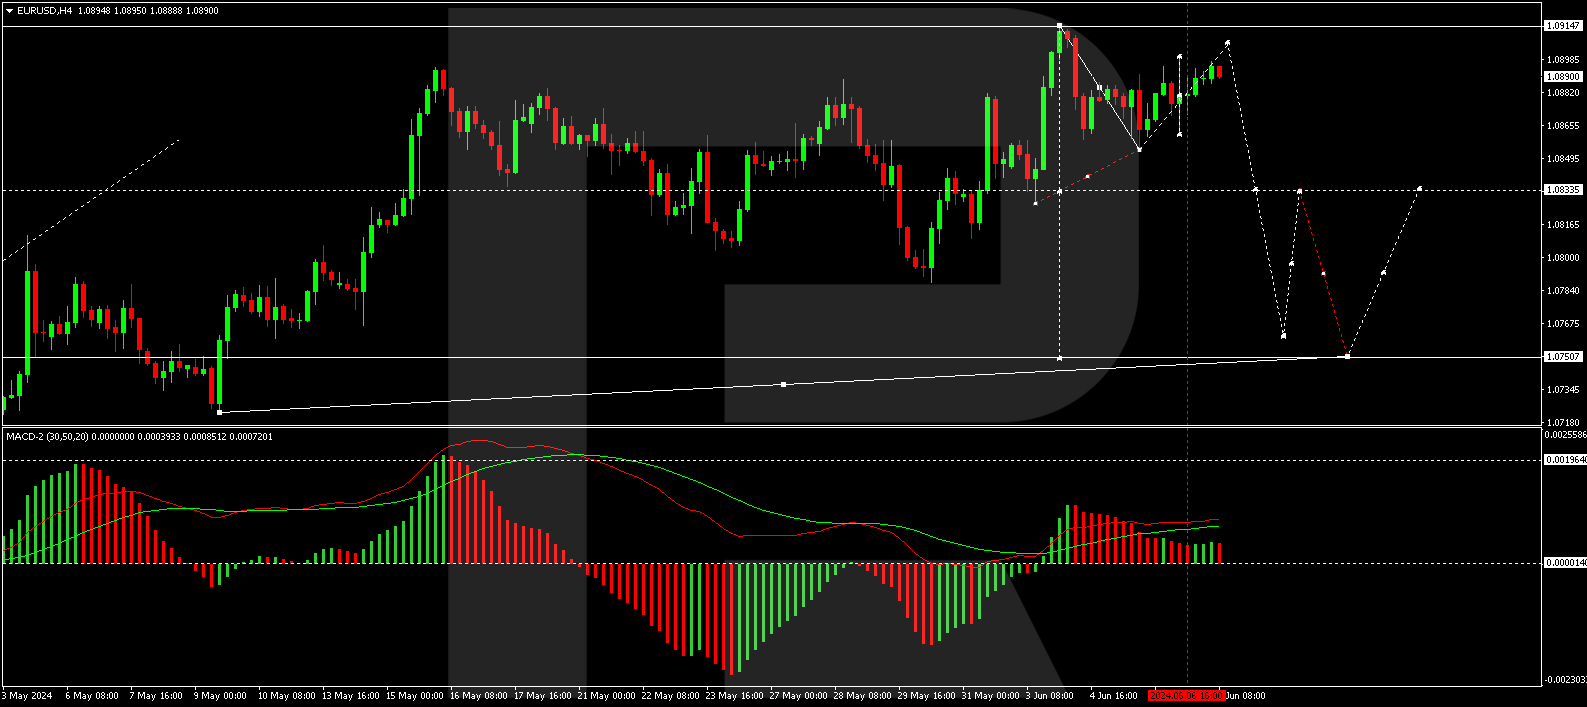
On the H4 chart, EUR/USD has formed an initial wave of decline to 1.0854 and a correction up to 1.0901. We expect the start of a new wave of decline to the level of 1.0833. A break below this level will open the potential for a wave down to 1.0760, with a trend continuation prospect to 1.0750. This first target of the decline wave is technically confirmed by the MACD indicator, whose signal line is at its peak and ready to continue descending.
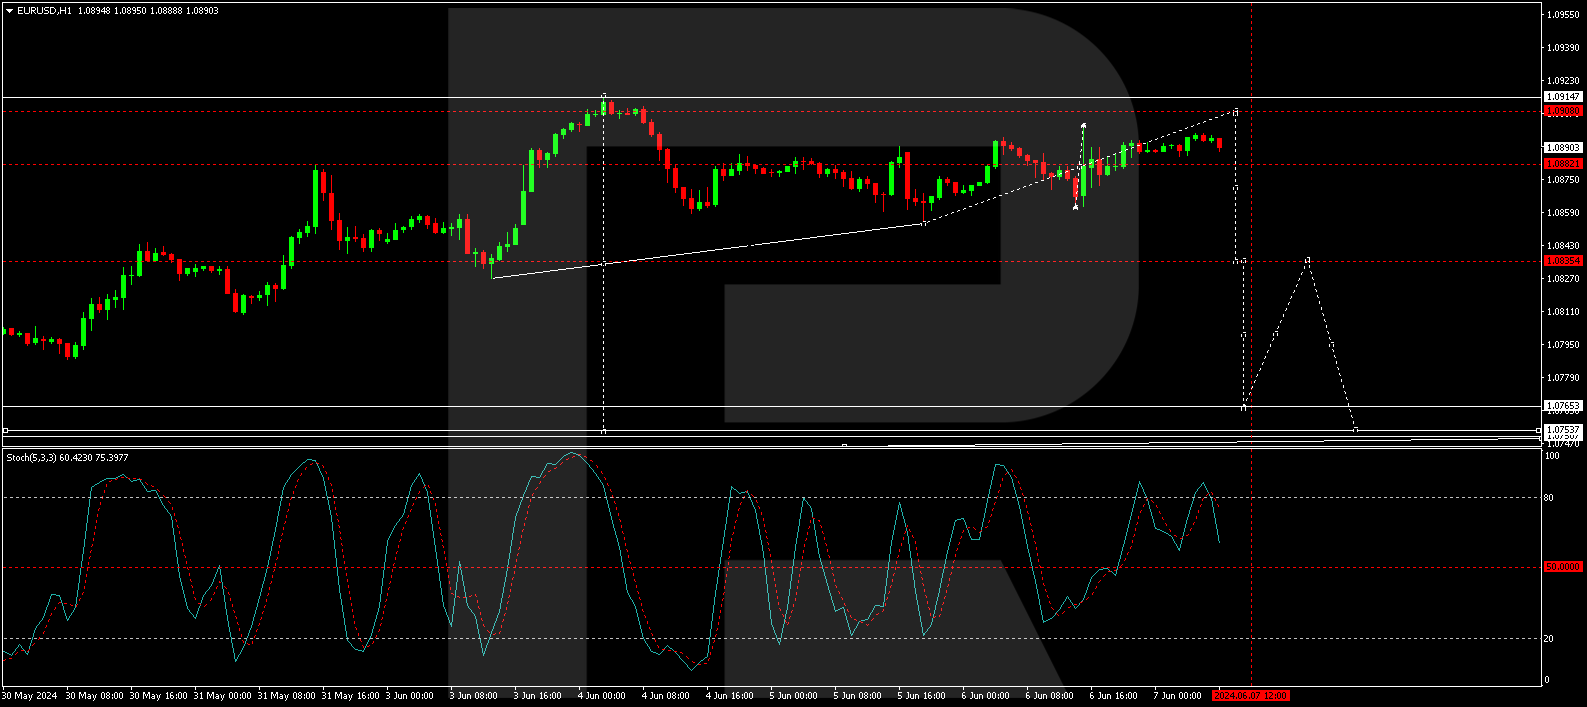
On the H1 chart, EUR/USD is forming a consolidation range around 1.0882. An expansion of the range to 1.0908 is possible. After reaching this level, we will consider the likelihood of a new wave of decline to 1.0882. A break below this level will open the potential for a wave down to 1.0835, with a trend continuation prospect to 1.0765. This local target is technically confirmed by the Stochastic oscillator, whose signal line is below the level of 80. We expect a decline to the level of 20.
Disclaimer
Any forecasts contained herein are based on the author’s particular opinion. This analysis may not be treated as trading advice. RoboForex bears no responsibility for trading results based on trading recommendations and reviews contained herein.

- The Tech‑heavy NASDAQ Index jumped by more than 3.3%. The offshore yuan is trading at its highest level since 2023 Jul 31, 2026
- USD/JPY After Volatility: Multiple Events in One Day Jul 31, 2026
- The US indices sell off amid renewed US-Iran clashes. Oil jumps by 7% Jul 30, 2026
- USD/JPY Temporary in Equilibrium: Multiple Factors in Focus Jul 30, 2026
- GBP/USD at Month’s Lows: The Outlook Remains Weak Jul 29, 2026
- Crude oil falls below $80 per barrel. Australia sees inflation slowdown Jul 29, 2026
- The US Tech sector hit by sell‑off. Oil prices decline on renewed negotiations Jul 28, 2026
- Gold Declines, Focus on Fed and Falling Oil Prices Jul 28, 2026
- This week will be one of the most crowded for central‑bank meetings Jul 27, 2026
- EUR/USD Ahead of a Key Week: Holding Near Lows Jul 27, 2026
