
By RoboForex Analytical Department
Gold prices climbed to 2368 USD per troy ounce on Thursday, continuing the upward momentum for the second session. This surge comes as market expectations adjust to the likelihood of future interest rate cuts by the Federal Reserve, fuelled by recent employment data.
Data from ADP indicated that the number of private-sector jobs in the US for May increased less than expected, with April’s figures also revised downwards. This suggests a cooling but robust employment market, reinforcing speculation about impending rate cuts. According to the CME Group’s FedWatch tool, market participants anticipate two rate cuts in 2024, with a 70% probability of easing by September.
Attention is now turning to Friday’s comprehensive labour market reports from the US, which will provide further insights into the economic health and possible direction of monetary policy. Additionally, recent global movements by central banks, such as the Bank of Canada’s first rate cut in four years and the expected rate cut by the European Central Bank today, are influencing gold prices.
XAU/USD technical analysis
Free Reports:
 Get our Weekly Commitment of Traders Reports - See where the biggest traders (Hedge Funds and Commercial Hedgers) are positioned in the futures markets on a weekly basis.
 Download Our Metatrader 4 Indicators – Put Our Free MetaTrader 4 Custom Indicators on your charts when you join our Weekly Newsletter
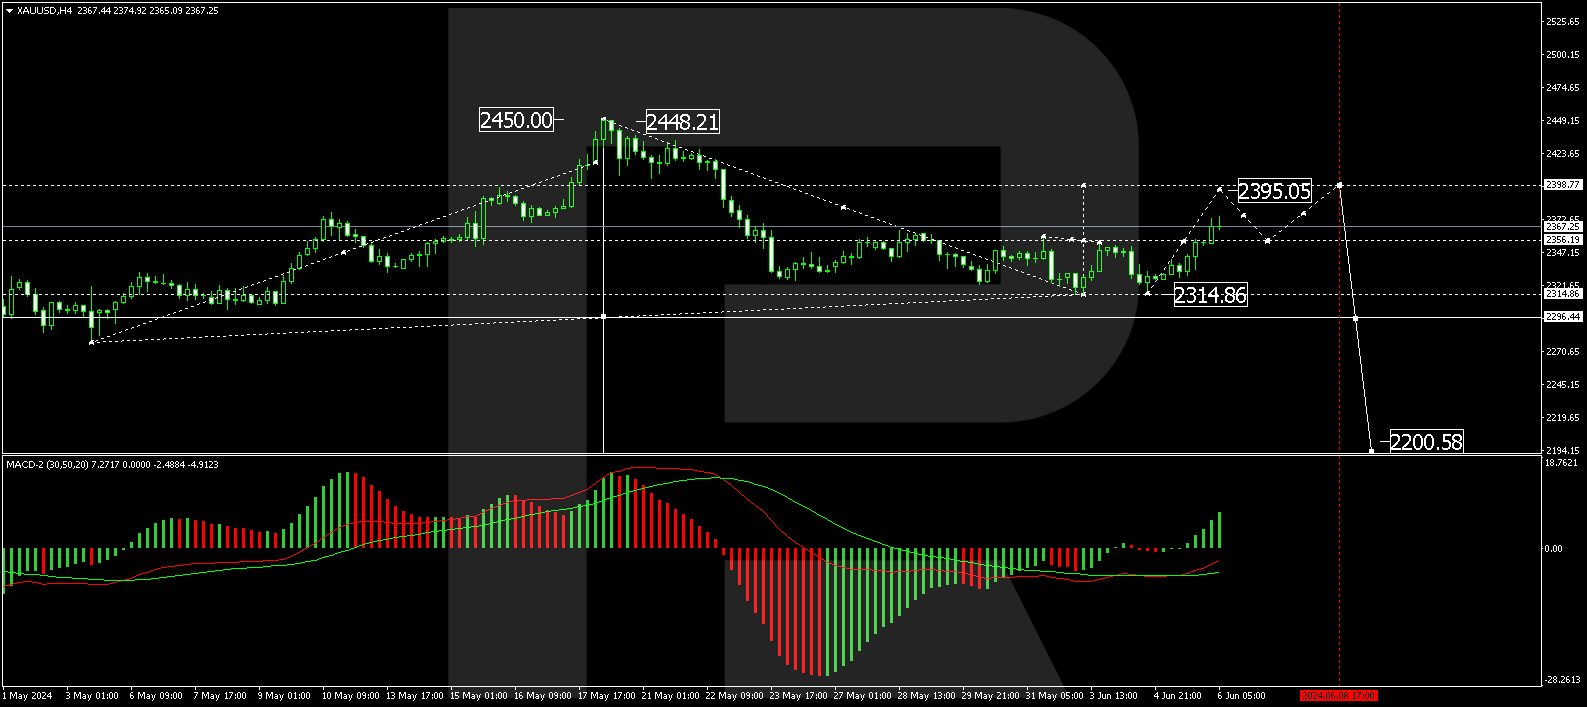
The H4 chart shows that gold has broken out of a consolidation range established above the 2315.00 USD level, moving upwards. The market is now poised to reach 2395.00 USD potentially. Once this target is met, a retraction to 2356.20 USD for a test from above could occur before another possible rise to 2399.00 USD. The MACD indicator supports this bullish outlook, with its signal line below zero but ascending sharply towards new highs.
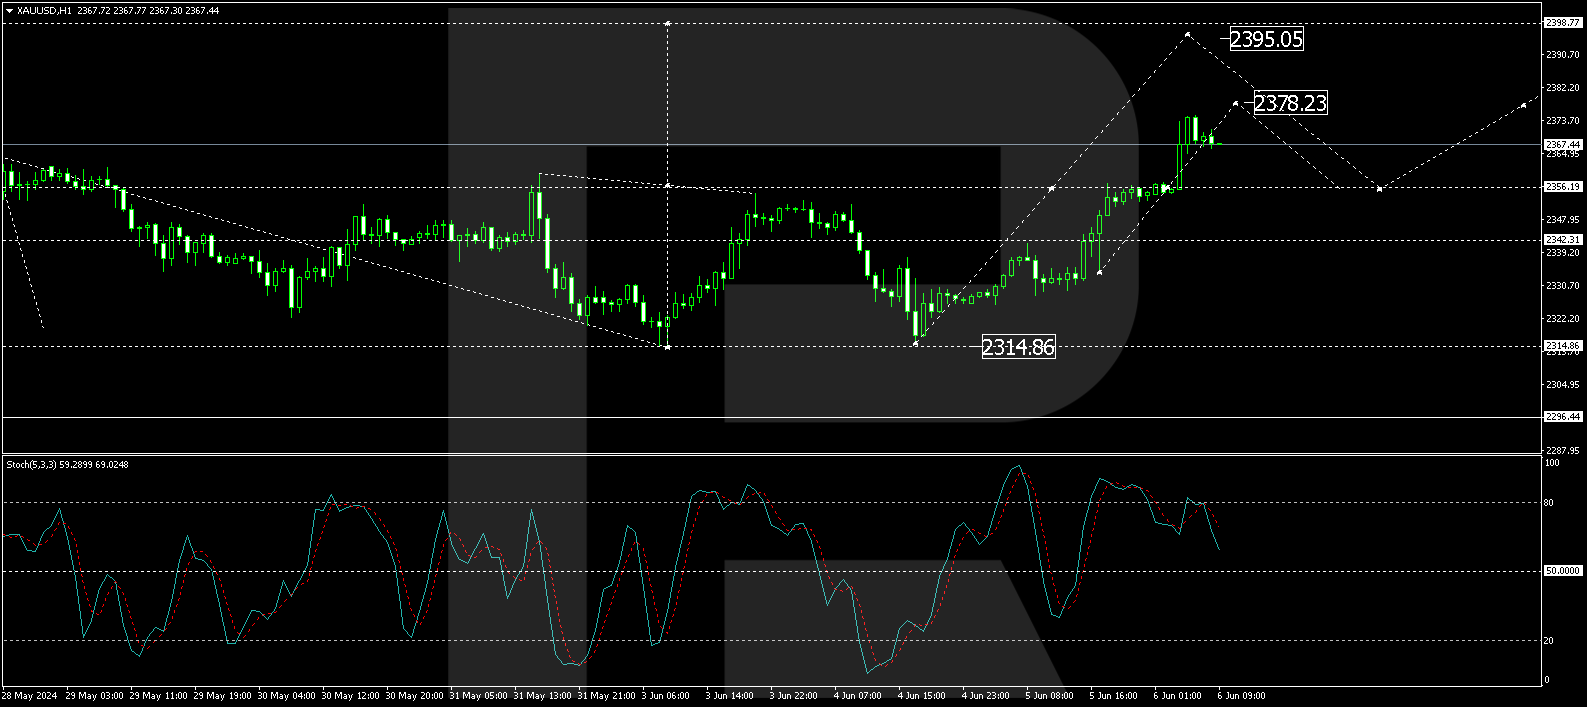
On the H1 chart, gold developed a growth wave towards 2356.20 USD, followed by a consolidation range forming below this level. The market has since broken upwards, continuing the growth trajectory towards 2378.23 USD. After reaching this level, a corrective movement back to 2356.20 USD may occur, potentially setting the stage for a push towards the 2395.00 USD mark. The Stochastic oscillator indicates that, while the signal line has dipped below 80, it is expected to rise again towards 80, suggesting continued upward momentum.
Market outlook
Gold prices are experiencing a bullish phase, underpinned by shifting expectations regarding US monetary policy and actions by other central banks. Investors should closely monitor the upcoming US employment data and global central bank decisions. These events could significantly influence gold’s price dynamics in the short term. The technical indicators suggest a continuation of the current uptrend, with key levels to watch for potential reversals or further gains.
Disclaimer
Any forecasts contained herein are based on the author’s particular opinion. This analysis may not be treated as trading advice. RoboForex bears no responsibility for trading results based on trading recommendations and reviews contained herein.

- The Tech‑heavy NASDAQ Index jumped by more than 3.3%. The offshore yuan is trading at its highest level since 2023 Jul 31, 2026
- USD/JPY After Volatility: Multiple Events in One Day Jul 31, 2026
- The US indices sell off amid renewed US-Iran clashes. Oil jumps by 7% Jul 30, 2026
- USD/JPY Temporary in Equilibrium: Multiple Factors in Focus Jul 30, 2026
- GBP/USD at Month’s Lows: The Outlook Remains Weak Jul 29, 2026
- Crude oil falls below $80 per barrel. Australia sees inflation slowdown Jul 29, 2026
- The US Tech sector hit by sell‑off. Oil prices decline on renewed negotiations Jul 28, 2026
- Gold Declines, Focus on Fed and Falling Oil Prices Jul 28, 2026
- This week will be one of the most crowded for central‑bank meetings Jul 27, 2026
- EUR/USD Ahead of a Key Week: Holding Near Lows Jul 27, 2026