China’s consumer inflation is on the rise. Today, the focus is on the FOMC meeting

By JustMarkets

At Tuesday’s close, the Dow Jones Index (US30) decreased by 0.31%, while the S&P 500 Index (US500) added 0.27%. The NASDAQ Technology Index (US100) closed positive 0.88%. Weakness in bank stocks weighed on the Dow Jones Industrials after Pimco said it expects more bank failures of regional banks in the US due to a “very high” concentration of troubled commercial real estate loans on their balance sheets. Stocks also came under some downward pressure due to caution ahead of Wednesday’s CPI report and the outcome of Wednesday’s FOMC meeting.

The US Central Bank will hold its next monetary policy meeting today. The probability that the US Fed will start cutting rates at the current meeting is almost zero. Therefore, traders should focus on the FOMC estimates and the speech of Fed Chief Jerome Powell at the press conference after the meeting. Consumer inflation data for May will be released a few hours before the Fed meeting on Wednesday. Further signs of weakening inflation could increase expectations for a rate cut, especially given signs of economic weakness. As a result, most factors indicate that the statement and speech will have a hawkish bias. This could give confidence to the dollar, which would negatively impact risk assets (euro, pound), metals, and indices. There is only a small chance that the situation will change. For that, inflation data would have to show significant downward progress.

Apple (AAPL) rose more than 7% to a record high and supported gains in tech stocks when D.A. Davidson upgraded the stock to “buy” from “neutral” with a $230 price target on “expectations of an iPhone refresh cycle.” Shares of PayPal Holdings (PYPL) fell more than 3% and topped the Nasdaq 100 losers list after Apple demonstrated a new tap-to-cash feature that allows for quick payments between individuals.

Equity markets in Europe were mostly down on Tuesday. Germany’s DAX (DE40) fell by 0.68%, France’s CAC 40 (FR40) closed down 1.33%, Spain’s IBEX 35 (ES35) lost 1.60%, and the UK’s FTSE 100 (UK100) closed negative 0.98%. ECB Governing Council spokesman Rehn said yesterday that the ECB is not pre-committing to any interest rate path. This confirms what his colleagues have said that the ECB will not cut rates at its next meeting. Swaps estimate the probability of a 25bp ECB rate cut at 8% for the July 18 meeting and 49% for the September 12 meeting.

French President Macron has called for snap legislative elections in response to the far-right’s success in the European Parliament elections. Although Macron will retain the presidency and powers over foreign policy and defense, his ability to push through legislation could be affected by the outcome of the election and the appointment of a new prime minister. There are also concerns that the president could resign if his party performs poorly in the upcoming elections, raising concerns about France’s financial situation.

WTI crude prices climbed above $78 a barrel on Wednesday, having risen in five of the last six sessions on the back of an improved global demand outlook. The US agency EIA raised its prognosis for global oil demand growth to 1.1 million bpd in 2024 from a previous estimate of 900,000 bpd, with demand in Asian countries, excluding Japan, revised upward. OPEC also maintained its prognosis for solid growth in global oil demand this year due to increased travel and tourism expectations in the second half of the year.

Asian markets were mostly down yesterday. Japan’s Nikkei 225 (JP225) gained 0.25%, China’s FTSE China A50 (CHA50) declined 1.48%, Hong Kong’s Hang Seng (HK50) fell on -1.04% and Australia’s ASX 200 (AU200) was negative 1.33%.

The offshore yuan rose to 7.26 per dollar as traders reacted to the latest Chinese inflation data. The data showed consumer prices rose steadily in May, and producer price deflation eased slightly. This suggests that the Chinese government’s efforts to stimulate the economy are starting to show positive results. China’s annual inflation rate in May 2024 was 0.3%, holding steady for the second consecutive month and falling short of market estimates of 0.4%. It was the fourth consecutive month of rising consumer inflation. Meanwhile, traders took a cautious stance following a report that the Biden administration may impose further restrictions on China’s access to artificial intelligence technology amid escalating tensions between the US and China.

S&P 500 (US500) 5,375.32 +14.53 (+0.27%)

Dow Jones (US30) 38,747.42 −120.62 (−0.31%)

DAX (DE40) 18,369.94 −124.95 (−0.68%)

FTSE 100 (UK100) 8,147.81 −80.67 (−0.98%)

USD Index 105.26 +0.03 (+0.03%)

Important events today:
  • – Japan Producer Price Index (m/m) at 02:50 (GMT+3);
  • – China Consumer Price Index (q/q) at 04:30 (GMT+3);
  • – China Producer Price Index (q/q) at 04:30 (GMT+3);
  • – UK GDP (m/m) at 09:00 (GMT+3);
  • – UK Industrial Production (m/m) at 09:00 (GMT+3);
  • – UK Trade Balance (m/m) at 09:00 (GMT+3);
  • – German Consumer Price Index (m/m) at 09:00 (GMT+3);
  • – US Consumer Price Index (m/m) at 15:30 (GMT+3);
  • – US Crude Oil Inventories (w/w) at 17:30 (GMT+3);
  • – US Fed Interest Rate Decision at 21:00 (GMT+3);
  • – US FOMC Monetary Policy Statement at 21:00 (GMT+3);
  • – US FOMC Press Conference at 21:30 (GMT+3);
  • – Canada BoC Gov Macklem Speaks at 22:15 (GMT+3).

By JustMarkets


This article reflects a personal opinion and should not be interpreted as an investment advice, and/or offer, and/or a persistent request for carrying out financial transactions, and/or a guarantee, and/or a forecast of future events.

US500: Braces for mid-week double whammy

By ForexTime 

  • US500 ↑ 13% since start of 2024
  • Index could be rocked by US CPI/Fed combo
  • Over past year Fed meeting triggered moves of ↑ 2% & ↓ 0.8%
  • Prices bullish on D1 but RSI overbought
  • Technical level – 5400

It would be a crime to overlook FXTM’s US500 on such a big day for global markets.

After hitting a new all-time high yesterday, the index could be injected with fresh volatility thanks to a rare US CPI and Fed combo.

Note: US500 tracks the S&P 500 index – the benchmark used to measure the stock performance of the largest listed US companies.

Since last Friday, we have hammered at the importance of these two events and their potential impacts on financial markets. Still, US equities continue to march higher despite the growing sense of caution. This may be based on Apple stocks surging to fresh all-time highs.

But the key question is whether US500 bulls can maintain their hunger for more gains…

The US Consumer Price Index (CPI) is forecast to rise 3.4% in May, unchanged from April. At the same time, the annual core is forecast to have cooled to 3.5% – its lowest since April 2021.

  • Should the inflation report print above expectations, this may further push back Fed cut bets – hitting the US500.

Traders are currently pricing in a 58% probability of a 25-basis point cut in September with this jumping to 89% by November.

Golden nugget: Over the past year, the US CPI report has triggered upside moves of as much as 0.7% or declines of 0.5% in a 6-hour window post-release.

A few hours after the CPI report will be the Fed decision which is widely expected to conclude with rates unchanged. However, all eyes will be on the economic projections including the “dot plot” which could potentially rock markets.

  • The new dot plot is expected to show two 25-basis point cuts in 2024 compared with the three projected in March. If the dot plot shows only one 25 basis point cut or none for this year, US equity bulls could be in trouble.

Golden nugget: Over the past year, the Fed has triggered upside moves of as much as 2% or declines of 0.8% in a 6-hour window post-release.

Looking at the technical picture

The US500 is firmly bullish on the daily charts with prices trading above the 50, 100, and 200-day SMA. However, the Relative Strength Index (RSI) is a whisker away from 70 – indicating that prices are overbought.

  • A solid breakout above 5400 could encourage a move toward the next psychological level at 5500.
  • Should 5400 prove reliable resistance, prices may slip back towards 5320 and 5270.


Forex-Time-LogoArticle by ForexTime

ForexTime Ltd (FXTM) is an award winning international online forex broker regulated by CySEC 185/12 www.forextime.com

New database features 250 AI tools that can enhance social science research

By Megan Stubbs-Richardson, Mississippi State University; Devon Brenner, Mississippi State University; Lauren Etheredge, Mississippi State University, and MacKenzie Paul, Baylor University 

AI – or artificial intelligence – is often used as a way to summarize data and improve writing. But AI tools also represent a powerful and efficient way to analyze large amounts of text to search for patterns. In addition, AI tools can assist with developing research products that can be shared widely.

It’s with that in mind that we, as researchers in social science, developed a new database of AI tools for the field. In the database, we compiled information about each tool and documented whether it was useful for literature reviews, data collection and analyses, or research dissemination. We also provided information on the costs, logins and plug-in extensions available for each tool.

When asked about their perceptions of AI, many social scientists express caution or apprehension. In a sample of faculty and students from over 600 institutions, only 22% of university faculty reported that they regularly used AI tools.

From combing through lengthy transcripts or text-based data to writing literature reviews and sharing results, we believe AI can help social science researchers – such as those in psychology, sociology and communication – as well as others get the most out of their data and present it to a wider audience.

Analyze text using AI

Qualitative research often involves poring over transcripts or written language to identify themes and patterns. While this kind of research is powerful, it is also labor-intensive. The power of AI platforms to sift through large datasets not only saves researchers time, but it can also help them analyze data that couldn’t have been analyzed previously because of the size of the dataset.

Specifically, AI can assist social scientists by identifying potential themes or common topics in large, text-based data that scientists can interrogate using qualitative research methods. For example, AI can analyze 15 million social media posts to identify themes in how people coped with COVID-19. These themes can then give researchers insight into larger trends in the data, allowing us to refine criteria for a more in-depth, qualitative analysis.

AI tools can also be used to adapt language and scientists’ word choice in research designs. In particular, AI can reduce bias by improving the wording of questions in surveys or refining keywords used in social media data collection.

Identify gaps in knowledge

Another key task in research is to scan the field for previous work to identify gaps in knowledge. AI applications are built on systems that can synthesize text. This makes literature reviews – the section of a research paper that summarizes other research on the same topic – and writing processes more efficient.

Research shows that human feedback to AI, such as providing examples of simple logic, can significantly improve the tools’ ability to perform complex reasoning. With this in mind, we can continually revise our instructions to AI and refine its ability to pull relevant literature.

However, social scientists must be wary of fake sources – a big concern with generative AI. It is essential to verify any sources AI tools provide to ensure they come from peer-reviewed journals.

Share research findings

AI tools can quickly summarize research findings in a reader-friendly way by assisting with writing blogs, creating infographics and producing presentation slides and even images.

Our database contains AI tools that can also help scientists present their findings on social media. One tool worth highlighting is BlogTweet. This free AI tool allows users to copy and paste text from an article like this one to generate tweet threads and start conversations.

Be aware of the cost of AI tools

Two-thirds of the tools in the database cost money. While our primary objective was to identify the most useful tools for social scientists, we also sought to identify open-source tools and curated a list of 85 free tools that can support literature reviews, writing, data collection, analysis and visualization efforts.

12 best free AI tools for academic research and researchers.

In our analysis of the cost of AI tools, we also found that many offer “freemium” access to tools. This means you can explore a free version of the product. More advanced versions of the tool are available through the purchase of tokens or subscription plans.

For some tools, costs can be somewhat hidden or unexpected. For instance, a tool that seems open source on the surface may actually have rate limits, and users may find that they’ve run out of free questions to ask the AI.

The future of the database

Since the release of the Artificial Intelligence Applications for Social Science Research Database on Oct. 5, 2023, it has been downloaded over 400 times across 49 countries. In the database, we found 131 AI tools useful for literature reviews, summaries or writing. As many as 146 AI tools are useful for data collection or analysis, and 108 are useful for research dissemination.

We continue to update the database and hope that it can aid academic communities in their exploration of AI and generate new conversations. The more that social scientists use the database, the more they can work toward consensus of adopting ethical approaches to using AI in research and analysis.The Conversation

About the Authors:

Megan Stubbs-Richardson, Assistant Research Professor at the Social Science Research Center, Mississippi State University; Devon Brenner, Professor of education, Mississippi State University; Lauren Etheredge, Research associate in sociology, Mississippi State University, and MacKenzie Paul, Doctoral student in psychology, Baylor University

This article is republished from The Conversation under a Creative Commons license. Read the original article.

Which cryptos could see biggest moves after US CPI/Fed meeting?

By ForexTime

  • Bitcoin, Ethereum falling over 3% each today
  • Markets angsty ahead of Wednesday’s US CPI, Fed decision
  • Avalanch has seen biggest up/down moves post-CPI
  • Dogecoin, Solana historically more reactive to Fed meetings
  • Traders could profit from big crypto volatility mid-week


The world’s 2 largest cryptos, Bitcoin and Ethereum, are both falling over 3% each!


These declines come on the eve of some ultra-important US economic events that could rock global financial markets.


On Wednesday, June 12th, markets will find out the latest:

  • @12:30 GMT: US consumer price indices (CPI), which measure inflation, for May 2024
  • @18:00 GMT: Fed interest rate decision and “dot plot” (Fed officials’ forecasts for US interest rates)
  • @18:30 GMT: Press conference by Fed Chair Jerome Powell

Note that the monthly CPI releases and the Fed meetings are not often scheduled on the same day.

Hence, markets are set up for what could be a “double-whammy” Wednesday.


We’ve already written extensively about why these events impact financial markets worldwide.

This article will focus exclusively on the crypto world.


Which crypto could see the biggest moves this week?

Of the 11 different cryptocurrencies offered by FXTM …

Avalanch, Dogecoin and Solana have offered the biggest reactions to the US CPI prints and Fed decisions from the past 12 months.


Let’s break this down by the respective marquee events: US CPI and Fed meeting.


Using a 6-hour timeframe after the monthly CPI releases from the past 12 months:

  1. Avalanch rose by as much as 16.7%, or fell as much as 7.1%
  2. Solana rose by as much as 7%, or fell as much as 5.2%
  3. Bitcoin Cash rose by as much as 5.7%, or fell as much as 3.4%
  4. Chainlink rose by as much as 4.7%, or fell as much as 4.1%
  5. Bitcoin rose by as much as 4.3%, or fell as much as 2.9%
  6. Litecoin rose by as much as 3.4%, or fell as much as 4.2%
  7. Ethereum rose by as much as 3.4%, or fell as much as 3.1%
  8. Ripple rose by as much as 3.2%, or fell as much as 7.1%
  9. Dogecoin rose by as much as 3%, or fell as much as 3.8%
  10. Polygon rose by as much as 4.1%, or fell as much as 5.9%
  11. Cardano rose by as much as 3.9%, or fallen as much as 4.8%


In the 6 hours after each of the FOMC rate decision announcements (the timeframe includes Fed Chair Jerome Powell’s press conference) over the past 12 months:

  1. Dogecoin rose by as much as 14.1%, or fell as much as 2.5%
  2. Solana rose by as much as 11.3%, or fell as much as 6%
  3. Avalanch rose by as much as 9.2%, or fell as much as 6.1%
  4. Bitcoin Cash rose by as much as 8.4%, or fell as much as 3.7%
  5. Cardano rose by as much as 7.9%, or fell as much as 3%
  6. Chainlink rose by as much as 6.9%, or fell as much as 3.3%
  7. Polygon rose by as much as 6.6%, or fell as much as 6.3%
  8. Ethereum rose by as much as 6.6%, or fell as much as 5.3%
  9. Bitcoin rose by as much as 5.8%, or fell as much as 3.4%
  10. Litecoin rose by as much as 4.5%, or fell as much as 6%
  11. Ripple rose by as much as 4.4%, or fell as much as 5%


These biggest-in-class moves by Avalanch, Dogecoin, and Solana should produce sizeable opportunities for traders tomorrow.

How might cryptos react to US CPI and Fed meeting?

While markets are certainly complex organisms, here are some simple scenarios that traders could refer to as a guide ahead of tomorrow’s highly-anticipated events.


Cryptos may fall if:

  • US inflation comes in higher-than-expected
  • Fed dot plot points to just 1 or zero rate cuts for 2024
  • Fed Chair Jerome Powell signals to the world that the intended US rate cuts have to be delayed


Cryptos may rise if:

  • US inflation comes in lower-than-expected
  • Fed dot plot sticks to its March 2024 forecasts for 3 rate cuts this year
  • Fed Chair Jerome Powell refuses to sound “hawkish” but instead assures the world that rate cuts are indeed on the way


Either way, cryptocurrencies are set to deliver big moves, depending on how much markets are surprised tomorrow.


Forex-Time-LogoArticle by ForexTime

ForexTime Ltd (FXTM) is an award winning international online forex broker regulated by CySEC 185/12 www.forextime.com

Brent Crude Oil stabilises around 81.50 USD amid demand optimism

By RoboForex Analytical Department

Brent crude oil is holding steady at 81.50 USD per barrel on Tuesday, following a significant surge of over 2.5% the previous day. The price increase was driven by optimistic market expectations about fuel demand this coming summer and news that the US government is seizing the opportunity to replenish its strategic oil reserves at relatively low prices, with a particular focus on oil priced around 79 USD per barrel.

As the US Federal Reserve meeting commences today, market caution is expected. The recent robust employment data for May from the US suggests that the Fed might maintain a tight monetary policy longer than anticipated. This potential shift in policy could dampen US economic growth prospects and impact energy demand, making the Fed’s forthcoming statements highly significant for the oil market.

Additionally, market participants eagerly await the release of the American Petroleum Institute (API) report on crude oil and petroleum product inventories today and the Department of Energy’s similar report on Wednesday. These data releases, along with the monthly market reports from the Energy Information Administration (EIA), OPEC, and the International Energy Agency (IEA) later in the week, could further influence oil price dynamics.

Brent technical analysis

On the H4 chart, Brent has completed the initial wave of growth to 81.79. Currently, a consolidation range is expected to form below this level. Should there be a downward breakout, a correction towards 79.30 could occur, followed by a potential new wave of growth aiming for 83.30. Breaking this level could open the pathway to 87.50, the local target of the upward trend. The MACD indicator supports this bullish scenario, with its signal line below zero but directed sharply upwards.

On the H1 chart, after reaching 81.79, Brent is forming a consolidation range beneath this level. A downward exit could initiate a decline to 80.50, and further breaking this level could extend the correction to 79.30. Upon reaching this level, an upward movement to 81.80 is anticipated, potentially leading to further growth towards 83.30. This scenario is technically supported by the Stochastic oscillator, indicating a potential upward movement, as its signal line is currently poised at 20.

Market outlook

As investors navigate a week packed with significant data releases and central bank meetings, Brent crude prices will likely exhibit volatility. The outcome of the US Federal Reserve’s deliberations will be particularly pivotal, given its potential implications for economic activity and energy demand. Additionally, inventory data and global market reports from major energy agencies will provide further clues about supply and demand trends, which could either support the current price levels or drive further adjustments.


Disclaimer

Any forecasts contained herein are based on the author’s particular opinion. This analysis may not be treated as trading advice. RoboForex bears no responsibility for trading results based on trading recommendations and reviews contained herein.

The warming ocean is leaving coastal economies in hot water

By Charles Colgan, Middlebury Institute of International Studies 

Ocean-related tourism and recreation supports more than 320,000 jobs and US$13.5 billion in goods and services in Florida. But a swim in the ocean became much less attractive in the summer of 2023, when the water temperatures off Miami reached as high as 101 degrees Fahrenheit (37.8 Celsius).

The future of some jobs and businesses across the ocean economy have also become less secure as the ocean warms and damage from storms, sea-level rise and marine heat waves increases.

Ocean temperatures have been heating up over the past century, and hitting record highs for much of the past year, driven primarily by the rise in greenhouse gas emissions from burning fossil fuels. Scientists estimate that more than 90% of the excess heat produced by human activities has been taken up by the ocean.

That warming, hidden for years in data of interest only to oceanographers, is now having profound consequences for coastal economies around the world.

Understanding the role of the ocean in the economy is something I have been working on for more than 40 years, currently at the Center for the Blue Economy of the Middlebury Institute of International Studies. Mostly, I study the positive contributions of the ocean, but this has begun to change, sometimes dramatically. Climate change has made the ocean a threat to the economy in multiple ways.

The dangers of sea-level rise

One of the big threats to economies from ocean warming is sea-level rise. As water warms, it expands. Along with meltwater from glaciers and ice sheets, thermal expansion of the water has increased flooding in low-lying coastal areas and put the future of island nations at risk.

In the U.S., rising sea levels will soon overwhelm Isle de Jean Charles in Louisiana and Tangier Island in Chesapeake Bay.

Flooding at high tide, even on sunny days, is becoming increasingly common in places such as Miami Beach; Annapolis, Maryland; Norfolk, Virginia; and San Francisco. High-tide flooding has more than doubled since 2000 and is on track to triple by 2050 along the country’s coasts.

Maps show temperatures and sea level rise, with the fastest ris along the Gulf and Atlantic coasts, and lower rates on the Pacific.
Satellite and tide gauge data show sea-level change from 1993 to 2020.
National Climate Assessment 2023

Rising sea levels also push salt water into freshwater aquifers, from which water is drawn to support agriculture. The strawberry crop in coastal California is already being affected.

These effects are still small and highly localized. Much larger effects come with storms enhanced by sea level.

Higher sea level can worsen storm damage

Warmer ocean water fuels tropical storms. It’s one reason forecasters are warning of a busy 2024 hurricane season.

Tropical storms pick up moisture over warm water and transfer it to cooler areas. The warmer the water, the faster the storm can form, the quicker it can intensify and the longer it can last, resulting in destructive storms and heavy downpours that can flood cities even far from the coasts.

When these storms now come in on top of already higher sea levels, the waves and storm surge can dramatically increase coastal flooding.

What Hurricane Hugo’s flooding would look like in Charleston, S.C., with today’s higher sea levels.

Tropical cyclones caused more than $1.3 trillion in damage in the U.S. from 1980 to 2023, with an average cost of $22.8 billion per storm. Much of that cost has been absorbed by federal taxpayers.

It is not just tropical storms. Maine saw what can happen when a winter storm in January 2024 generated tides 5 feet above normal that filled coastal streets with seawater.

What does that mean for the economy?

The possible future economic damages from sea-level rise are not known because the pace and extent of rising sea levels are unknown.

One estimate puts the costs from sea-level rise and storm surge alone at over $990 billion this century, with adaptation measures able to reduce this by only $100 billion. These estimates include direct property damage and damage to infrastructure such as transportation, water systems and ports. Not included are impacts on agriculture from saltwater intrusion into aquifers that support agriculture.

Marine heat waves leave fisheries in trouble

Rising ocean temperatures are also affecting marine life through extreme events, known as marine heat waves, and more gradual long-term shifts in temperature.

In spring 2024, one third of the global ocean was experiencing heat waves. Corals are struggling through their fourth global bleaching event on record as warm ocean temperatures cause them to expel the algae that live in their shells and give the corals color and provide food. While corals sometimes recover from bleaching, about half of the world’s coral reefs have died since 1950, and their future beyond the middle of this century is bleak.

A school of fish with yellow tails swim over a reef in July 2023.
Healthy coral reefs serve as fish nurseries and habitat. These schoolmaster snappers were spotted on Davey Crocker Reef near Islamorada in the Florida Keys.
Jstuby/wikimedia, CC BY

Losing coral reefs is about more than their beauty. Coral reefs serve as nurseries and feeding grounds for thousands of species of fish. By NOAA’s estimate, about half of all federally managed fisheries, including snapper and grouper, rely on reefs at some point in their life cycle.

Warmer waters cause fish to migrate to cooler areas. This is particularly notable with species that like cold water, such as lobsters, which have been steadily migrating north to flee warming seas. Once-robust lobstering in southern New England has declined significantly.

Map shows how the average locations of lobster, red hake and black sea bass changed over 45 year, 1974-2019. Smaller charts show each moving
How three fish and shellfish species migrated between 1974 and 2019 off the U.S. Atlantic Coast. Dots shows the annual average location.
NOAA

In the Gulf of Alaska, rising temperatures almost wiped out the snow crabs, and a $270 million fishery had to be completely closed for two years. A major heat wave off the Pacific coast extended over several years in the 2010s and disrupted fishing from Alaska to Oregon.

This won’t turn around soon

The accumulated ocean heat and greenhouse gases in the atmosphere will continue to affect ocean temperatures for centuries, even if countries cut their greenhouse gas emissions to net zero by 2050 as hoped. So, while ocean temperatures fluctuate year to year, the overall trend is likely to continue upward for at least a century.

There is no cold-water tap that we can simply turn on to quickly return ocean temperatures to “normal,” so communities will have to adapt while the entire planet works to slow greenhouse gas emissions to protect ocean economies for the future.The Conversation

About the Author:

Charles Colgan, Director of Research for the Center for the Blue Economy, Middlebury Institute of International Studies

This article is republished from The Conversation under a Creative Commons license. Read the original article.

Euro falls to four-week low: politicians to blame

By RoboForex Analytical Department

EUR/USD plummeted below 1.0800 and is currently hovering around 1.0796 on Monday morning. This development came amid heightened political tensions in France. President Emmanuel Macron called for early elections on Sunday in the wake of his party’s crushing defeat and Marine Le Pen’s party’s resounding victory in the European Parliament elections. The far-right, which secured twice as many votes as its closest competitors, has won and now has significant influence in France. The defeat of the country’s pro-presidential forces has profoundly impacted the euro’s position.

Furthermore, the euro was also under pressure from the US dollar ahead of this week’s Federal Reserve meeting. Robust employment statistics in the US for May had already led the market to lower its expectations of a Fed interest rate cut.

Last week, the European Central Bank lowered its interest rate for the first time in five years. However, it is adopting an overly cautious stance on further rate cuts. In its comments, the ECB acknowledged the continued price pressures and projected that inflation will exceed targets this year and next. The regulator is refraining from making any specific commitments on a clear rate trajectory, indicating that all future ECB actions will have to be based on incoming statistics one way or another.

Technical analysis of EUR/USD

On the H4 chart of EUR/USD, the market completed the correction at 1.0901 and started the development of a new wave of decline. The downward impulse to the level of 1.0835 is fulfilled at the moment. A consolidation range around this level was formed, and the structure of the wave to 1.0747 was worked out with a downward exit. Today, we will consider the probability of a decline to 1.0735. After working off this level, the growth link to 1.0785 (test from below) is possible, with a further decline to 1.0672, representing the local target. Technically, this scenario is confirmed by the MACD indicator, whose signal line is below zero and is directed strictly downwards.

On the H1 EUR/USD chart, the market continues to develop a structure of decline to 1.0734. After working off this level, a correction to 1.0785 is possible. Further, we will consider the probability of a decline to 1.0672, the first target of the downward trend. Technically, this scenario is confirmed by the Stochastic oscillator, whose signal line is under the level of 20. We expect the beginning of growth to the level of 50.


Disclaimer

Any forecasts contained herein are based on the author’s particular opinion. This analysis may not be treated as trading advice. RoboForex bears no responsibility for trading results based on trading recommendations and reviews contained herein.

Trade of the Week: EURGBP bears ready pounce?

By ForexTime

  • Euro ↓ on political jitters
  • EURGBP hits 22-month low  
  • UK Jobs report & EU data in focus
  • Technical level –  0.8500
  • Bloomberg FX model – 80% – EURGBP – (0.84065 – 0.85327)

Euro bears are back in action thanks to political uncertainty linked to the European Parliament elections.

The second most traded currency in the world is down against most of its major counterparts as of writing.

But our attention falls on the EURGBP which gapped to its lowest level since August 2022 at Monday’s Asian open!

The lowdown…

The euro seems to be gripped by political jitters in Europe.

Over the weekend, French President Emmanual Macron dissolved parliament and called for snap elections by the end of this month after his big defeat by the far right. Given how far-right parties have made big gains in the EU elections, this development has raised questions about Parliament’s ability to form the majorities needed to drive policy.

Looking beyond politics, here are 3 factors that could move the EURGBP this week:

    1) UK data dump

In the United Kingdom, the latest jobs data and industrial production figures could influence expectations about when the Bank of England will cut rates.

  • Tuesday 11th June: UK May jobless claims, April unemployment rate
  • Wednesday 12th June:  UK Industrial & manufacturing production

Traders are currently pricing in a 64% probability of a 25-basis point cut by September with a move fully priced in by November.

  • Should overall data from the UK exceed market forecasts, this could push back BoE rate cut bets – dragging the EURGBP lower.
  • Weaker-than-expected data may fuel BoE rate cut expectations that send the EURGBP higher.

Golden nugget: Over the past year, the UK jobs report has triggered upside moves of as much as 0.25% or declines of 0.23% in a 6-hour window post-release.


    2) EU data

Last week, the European Central Bank (ECB) cut interest rates for the first time since 2019.

The central bank clarified that a “data-dependent” approach will be adopted when considering future policy moves. This could increase the euro’s sensitivity to economic data, especially if it impacts ECB cut bets.

It may be worth keeping a tab on the Germany CPI (final) and Eurozone industrial production figures this week.

Traders are currently pricing in a 57% probability of a 25-basis point cut in September with this jumping to 77% by October.

  • The EURGBP could close the gap if data from Europe prints above market forecasts.
  • Should overall data disappoint, the EURGBP could extend losses as ECB cut bets rise.


    3) Technical forces

The EURGBP is under pressure on the daily charts with prices trading below the 50, 100, and 200-day SMA. However, the Relative Strength Index (RSI) has hit 30 – signalling that prices are oversold.

  • Sustained weakness below 0.8500 may encourage a decline towards 0.8400.
  • Should prices push back above 0.8500, this may open a path towards 0.8530.

Bloomberg’s FX model points to an 80% chance that EURGBP will trade within the 0.84065 – 0.85327 range over the next one-week period.


Forex-Time-LogoArticle by ForexTime

ForexTime Ltd (FXTM) is an award winning international online forex broker regulated by CySEC 185/12 www.forextime.com

Traders further lowered their expectations for a Fed interest rate cut this year

By JustMarkets

At Tuesday’s close, the Dow Jones Index (US30) decreased by 1.06% and fell to a 3-week low. The S&P 500 index (US500) was down 1.06%. The NASDAQ Technology Index (US100) closed negative 0.58%. Stocks declined amid rising bond yields driven by hawkish remarks from Fed officials. On Wednesday, Atlanta Fed President Bostic said that the path to 2% inflation is not guaranteed and that the scope for price increases is still significant. This came from recent comments from Minneapolis FRB President Kashkari, who said the US Central Bank should hold off on cutting rates until inflation improves significantly. Markets are pricing in a 25 bps chance of a rate cut to 0% at the June 12 FOMC meeting and 10% at the next meeting on July 31.

The Richmond Fed’s May survey of the US manufacturing outlook rose 7 to a 7-month high, beating expectations of no change at negative 7. The Fed’s Beige Book was neutral for stocks, showing that the US economy has grown at a “slight to moderate” pace in most regions since early April. Employment grew at a modest pace, with eight of twelve counties reporting “slight to moderate job growth,” and prices rose at a “moderate pace,” with business officials noting that consumers are resisting additional price increases.

Equity markets in Europe mostly fell yesterday. Germany’s DAX (DE40) fell by 1.10%, France’s CAC 40 (FR40) closed down 1.52%, Spain’s IBEX 35 (ES35) lost 1.16%, and the UK’s FTSE 100 (UK100) closed negative 0.86%.

The German GfK Consumer Confidence Index for June rose by 3.1 to a 2-year high of negative 20.9, which was stronger than expectations of negative 22.5. May German CPI (EU harmonized) rose to 2.8% y/y, beating expectations of 2.7% y/y and the largest increase in 4 months. ECB Governing Council spokesman Kazaks said the ECB should not go on “autopilot” when cutting interest rates after the expected rate cut next week.

WTI crude oil prices held near $79 a barrel on Thursday after losing nearly 1% in the previous session, weakened by growing expectations that borrowing costs could remain high for longer, dampening the demand outlook. Commodities and other risk assets sold off on Wednesday, and bond yields rose as traders bet that the US Federal Reserve may delay the start of its easing cycle or even decide not to cut rates at all this year. Today, the EIA will release last week’s crude oil inventories report. A decline of 1.6m barrels is expected, which may support oil prices.

Asian markets were mostly rising on Monday. Japan’s Nikkei 225 (JP225) was down 0.77%, China’s FTSE China A50 (CHA50) added 0.20%, Hong Kong’s Hang Seng (HK50) was down 1.83% for the day, and Australia’s ASX 200 (AU200) was negative 1.30%. In Asia, investors are awaiting the release of China’s PMI data for May on Friday to gauge the state of the world’s second-largest economy. On Wednesday, Chinese stocks rose after the IMF raised its growth prognoses to 5% from 4.6% this year thanks to strong first-quarter data and supportive policy measures.

The Australian dollar slid to $0.66, hitting its lowest level in two weeks, amid pressure from a strong US dollar and Treasury yields. Investors await the US PCE Price Index report later this week. Risk-sensitive currencies also followed broad declines in commodity prices and other risk assets.

S&P 500 (US500) 5,266.95 −39.09 (−0.74%)

Dow Jones (US30) 38,441.54 −411.32 (−1.06%)

DAX (DE40) 18,473.29 −204.58 (−1.10%)

FTSE 100 (UK100) 8,183.07 −71.11 (−0.86%)

USD Index 105.14 +0.52 (+0.50%)

Important events today:
  • – US FOMC Member Bostic Speaks at 02:00 (GMT+3);
  • – Switzerland GDP (q/q) at 10:00 (GMT+3);
  • – Switzerland KOF Leading Indicators (m/m) at 10:00 (GMT+3);
  • – Eurozone Unemployment Rate (m/m) at 12:00 (GMT+3);
  • – US Initial Jobless Claims (w/w) at 15:30 (GMT+3);
  • – US GDP (q/q) at 15:30 (GMT+3);
  • – US Pending Home Sales (m/m) at 17:00 (GMT+3);
  • – US Natural Gas Storage (w/w) at 17:30 (GMT+3);
  • – US Crude Oil Reserves (w/w) at 18:00 (GMT+3);
  • – US FOMC Member Williams Speaks at 19:05 (GMT+3).

By JustMarkets


This article reflects a personal opinion and should not be interpreted as an investment advice, and/or offer, and/or a persistent request for carrying out financial transactions, and/or a guarantee, and/or a forecast of future events.

Currency Speculators drop Swiss Franc bets to lowest since 2018

By InvestMacro

Here are the latest charts and statistics for the Commitment of Traders (COT) data published by the Commodities Futures Trading Commission (CFTC).

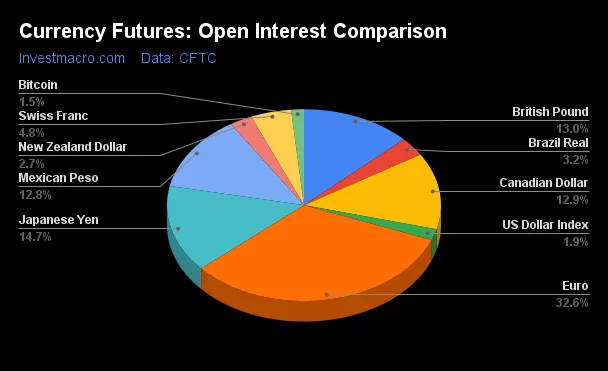
The latest COT data is updated through Tuesday June 4th and shows a quick view of how large market participants (for-profit speculators and commercial traders) were positioned in the futures markets. All currency positions are in direct relation to the US dollar where, for example, a bet for the euro is a bet that the euro will rise versus the dollar while a bet against the euro will be a bet that the euro will decline versus the dollar.

Weekly Speculator Changes led by Japanese Yen & New Zealand Dollar

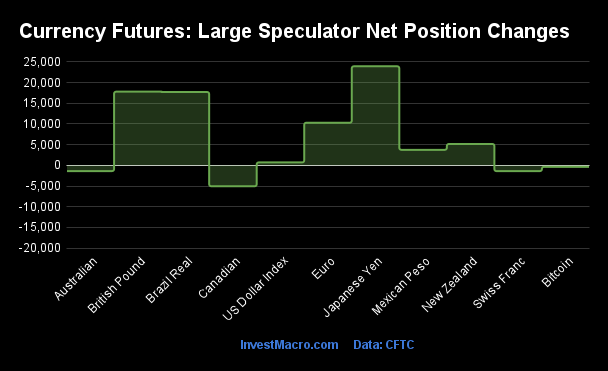
The COT currency market speculator bets were higher this week as seven out of the eleven currency markets we cover had higher positioning while the other four markets had lower speculator contracts.

Leading the gains for the currency markets was the Japanese Yen (23,938 contracts) with the British Pound (17,808 contracts), the Brazilian Real (17,722 contracts), the EuroFX (10,298 contracts),  the New Zealand Dollar (5,159 contracts), the Mexican Peso (3,752 contracts) and the US Dollar Index (713 contracts) also having positive weeks.

The currencies seeing declines in speculator bets on the week were the Canadian Dollar (-5,054 contracts), the Swiss Franc (-1,397 contracts), the Australian Dollar (-1,387 contracts) and with Bitcoin (-363 contracts) also seeing lower bets on the week.

Currency Speculators drop Swiss Franc bets to lowest since 2018

Swiss franc speculator bets fell for a second consecutive week this week and dropped to an overall standing at -45,763 contracts. This is the seventh straight week that the speculator position has now exceeded -40,000 contracts.

The current -45,763 contract position marks the lowest level for CHF bets since August 14th of 2018 (a span of 303 weeks) and the currency is currently tied as the most bearish extreme market of all the futures instruments we cover. The franc speculator position has now been consecutively in bearish territory for 143 weeks, dating back to September 7th of 2021 when the last bullish position was seen.

The Swiss franc exchange rate versus the US dollar has also been lower in 2024 following a strong run higher last year. The Swiss currency, in 2023, hit its highest level versus the USD since 2015 with a decade-high exchange rate above the 1.2000 threshold. Since then, however, the CHF has been heavily under pressure due to a strong dollar and combined with a surprise interest rate cut by the Swiss National Bank (SNB) in March. The franc has fallen by approximately 7 percent versus the dollar this year so far. The Swiss currency could remain under pressure for the time being as the SNB interest rate remains comparatively low at just 1.50 percent and Swiss inflation continues to be moderate with a 1.4 percent annual rate seen in May 2024.


Currencies Net Speculators Leaderboard

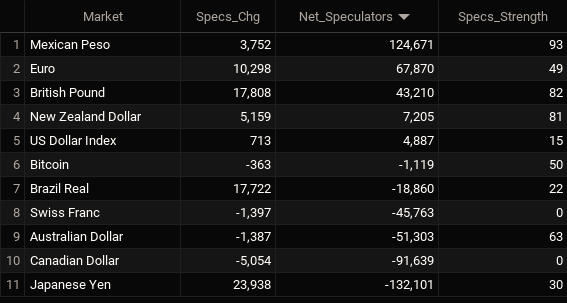
Legend: Weekly Speculators Change | Speculators Current Net Position | Speculators Strength Score compared to last 3-Years (0-100 range)


Strength Scores led by Mexican Peso & British Pound

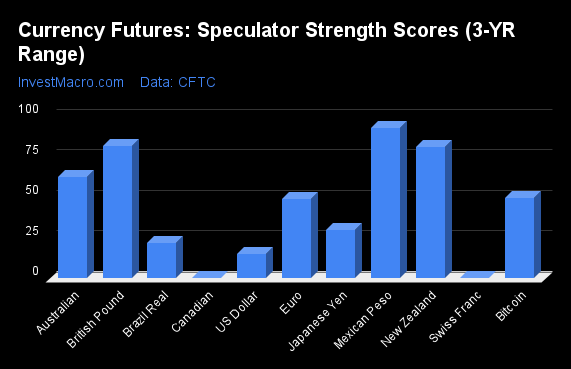
COT Strength Scores (a normalized measure of Speculator positions over a 3-Year range, from 0 to 100 where above 80 is Extreme-Bullish and below 20 is Extreme-Bearish) showed that the Mexican Peso (93 percent), the British Pound (82 percent) and the New Zealand Dollar (81 percent) led the currency markets this week. The Australian Dollar (63 percent) and Bitcoin (50 percent) come in as the next highest in the weekly strength scores.

On the downside, the Canadian Dollar (0 percent), the Swiss Franc (0 percent) and the US Dollar Index (15 percent) come in at the lowest strength levels currently and are in Extreme-Bearish territory (below 20 percent). The next lowest strength score was the Brazilian Real (22 percent).

Strength Statistics:
US Dollar Index (15.2 percent) vs US Dollar Index previous week (13.7 percent)
EuroFX (49.2 percent) vs EuroFX previous week (44.8 percent)
British Pound Sterling (81.9 percent) vs British Pound Sterling previous week (70.1 percent)
Japanese Yen (29.9 percent) vs Japanese Yen previous week (14.9 percent)
Swiss Franc (0.0 percent) vs Swiss Franc previous week (2.4 percent)
Canadian Dollar (0.0 percent) vs Canadian Dollar previous week (3.7 percent)
Australian Dollar (62.5 percent) vs Australian Dollar previous week (64.1 percent)
New Zealand Dollar (80.8 percent) vs New Zealand Dollar previous week (66.2 percent)
Mexican Peso (92.6 percent) vs Mexican Peso previous week (90.8 percent)
Brazilian Real (21.9 percent) vs Brazilian Real previous week (1.9 percent)
Bitcoin (49.6 percent) vs Bitcoin previous week (55.0 percent)


New Zealand Dollar & Australian Dollar top the 6-Week Strength Trends

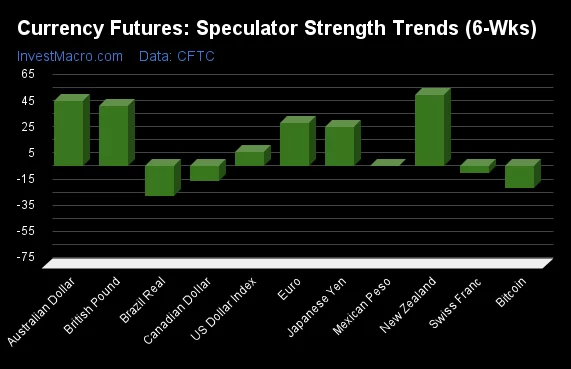
COT Strength Score Trends (or move index, calculates the 6-week changes in strength scores) showed that the New Zealand Dollar (55 percent), the Australian Dollar (50 percent) and the British Pound (46 percent) lead the past six weeks trends for the currencies. The EuroFX (33 percent) and the Japanese Yen (30 percent) are the next highest positive movers in the latest trends data.

The Brazilian Real (-22 percent) leads the downside trend scores currently with Bitcoin (-17 percent), the Canadian Dollar (-11 percent) and the Swiss Franc (-5 percent) following next with lower trend scores.

Strength Trend Statistics:
US Dollar Index (10.8 percent) vs US Dollar Index previous week (10.8 percent)
EuroFX (33.2 percent) vs EuroFX previous week (19.3 percent)
British Pound Sterling (46.0 percent) vs British Pound Sterling previous week (11.1 percent)
Japanese Yen (29.9 percent) vs Japanese Yen previous week (6.0 percent)
Swiss Franc (-5.4 percent) vs Swiss Franc previous week (-13.7 percent)
Canadian Dollar (-11.1 percent) vs Canadian Dollar previous week (-2.7 percent)
Australian Dollar (49.9 percent) vs Australian Dollar previous week (56.9 percent)
New Zealand Dollar (54.6 percent) vs New Zealand Dollar previous week (39.1 percent)
Mexican Peso (0.5 percent) vs Mexican Peso previous week (-3.3 percent)
Brazilian Real (-22.3 percent) vs Brazilian Real previous week (-42.2 percent)
Bitcoin (-16.8 percent) vs Bitcoin previous week (-5.9 percent)


Individual COT Forex Markets:

US Dollar Index Futures:

US Dollar Index Forex Futures COT Chart
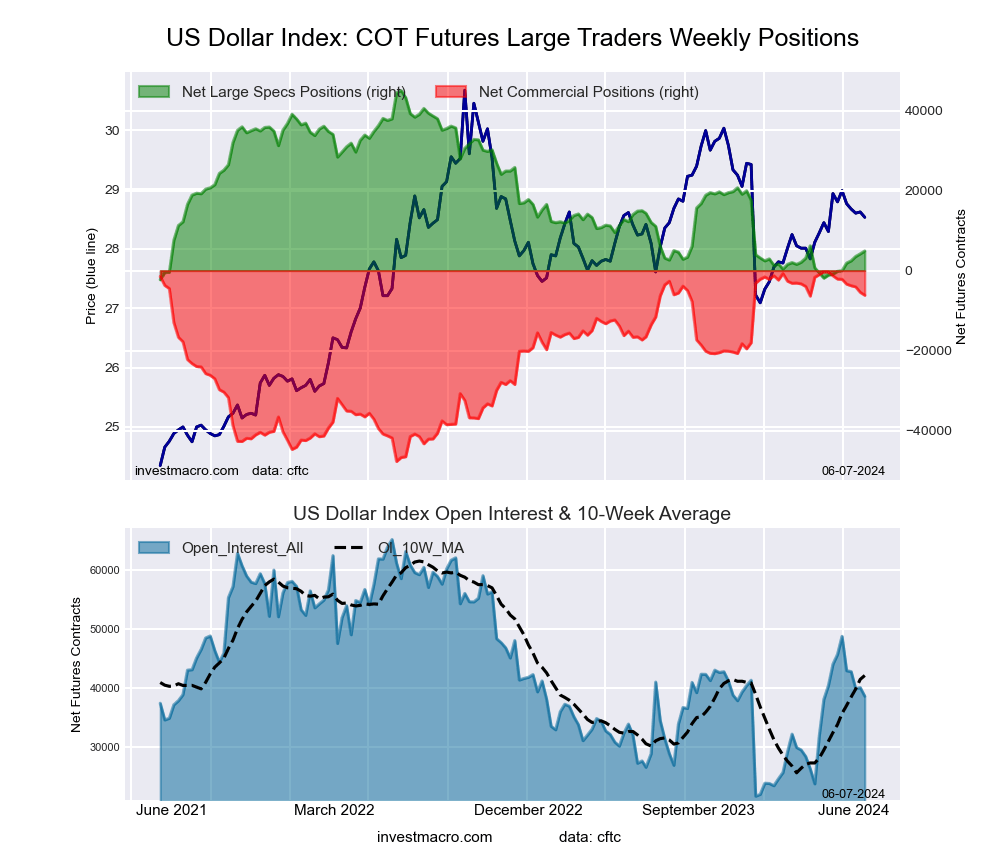
The US Dollar Index large speculator standing this week was a net position of 4,887 contracts in the data reported through Tuesday. This was a weekly increase of 713 contracts from the previous week which had a total of 4,174 net contracts.

This week’s current strength score (the trader positioning range over the past three years, measured from 0 to 100) shows the speculators are currently Bearish-Extreme with a score of 15.2 percent. The commercials are Bullish-Extreme with a score of 87.6 percent and the small traders (not shown in chart) are Bearish with a score of 26.3 percent.

Price Trend-Following Model: Uptrend

Our weekly trend-following model classifies the current market price position as: Uptrend. The current action for the model is considered to be: Hold – Maintain Long Position.

US DOLLAR INDEX StatisticsSPECULATORSCOMMERCIALSSMALL TRADERS
– Percent of Open Interest Longs:69.415.19.3
– Percent of Open Interest Shorts:56.731.16.0
– Net Position:4,887-6,1841,297
– Gross Longs:26,8035,8453,598
– Gross Shorts:21,91612,0292,301
– Long to Short Ratio:1.2 to 10.5 to 11.6 to 1
NET POSITION TREND:
– Strength Index Score (3 Year Range Pct):15.287.626.3
– Strength Index Reading (3 Year Range):Bearish-ExtremeBullish-ExtremeBearish
NET POSITION MOVEMENT INDEX:
– 6-Week Change in Strength Index:10.8-8.6-12.1


Euro Currency Futures:

Euro Currency Futures COT Chart
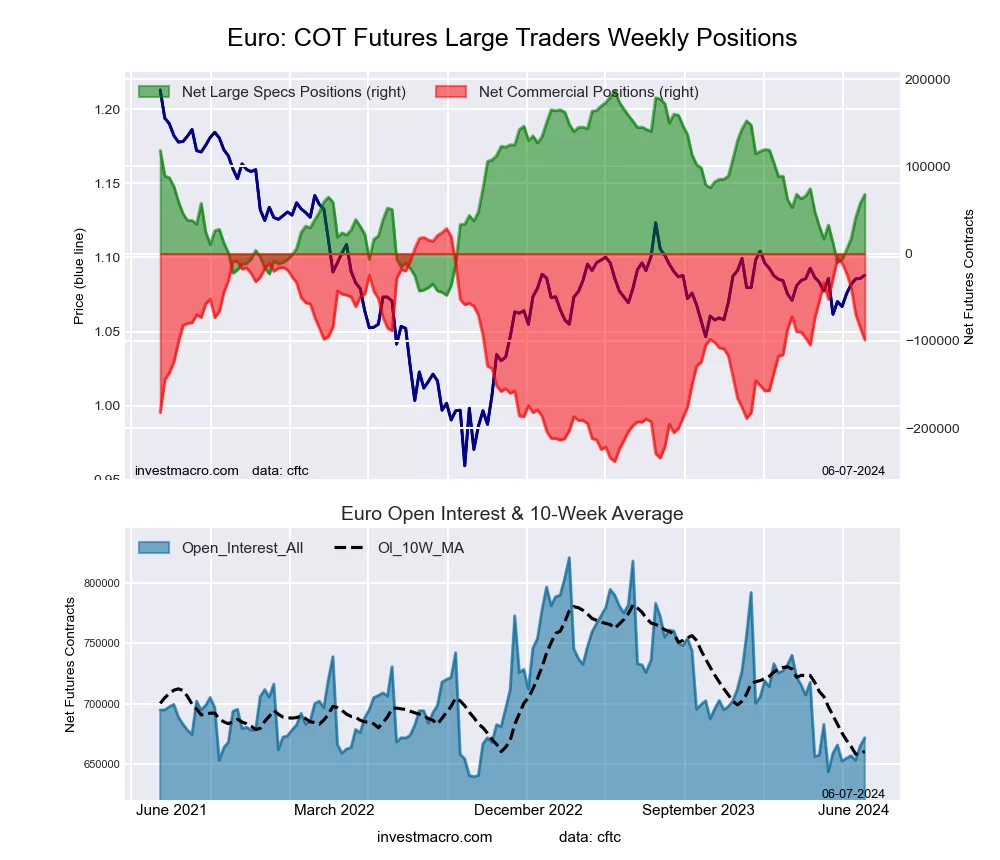
The Euro Currency large speculator standing this week was a net position of 67,870 contracts in the data reported through Tuesday. This was a weekly increase of 10,298 contracts from the previous week which had a total of 57,572 net contracts.

This week’s current strength score (the trader positioning range over the past three years, measured from 0 to 100) shows the speculators are currently Bearish with a score of 49.2 percent. The commercials are Bullish with a score of 52.2 percent and the small traders (not shown in chart) are Bearish with a score of 35.0 percent.

Price Trend-Following Model: Downtrend

Our weekly trend-following model classifies the current market price position as: Downtrend. The current action for the model is considered to be: Hold – Maintain Short Position.

EURO Currency StatisticsSPECULATORSCOMMERCIALSSMALL TRADERS
– Percent of Open Interest Longs:28.157.111.9
– Percent of Open Interest Shorts:18.071.87.3
– Net Position:67,870-98,78630,916
– Gross Longs:188,957383,42379,709
– Gross Shorts:121,087482,20948,793
– Long to Short Ratio:1.6 to 10.8 to 11.6 to 1
NET POSITION TREND:
– Strength Index Score (3 Year Range Pct):49.252.235.0
– Strength Index Reading (3 Year Range):BearishBullishBearish
NET POSITION MOVEMENT INDEX:
– 6-Week Change in Strength Index:33.2-35.030.9


British Pound Sterling Futures:

British Pound Sterling Futures COT Chart
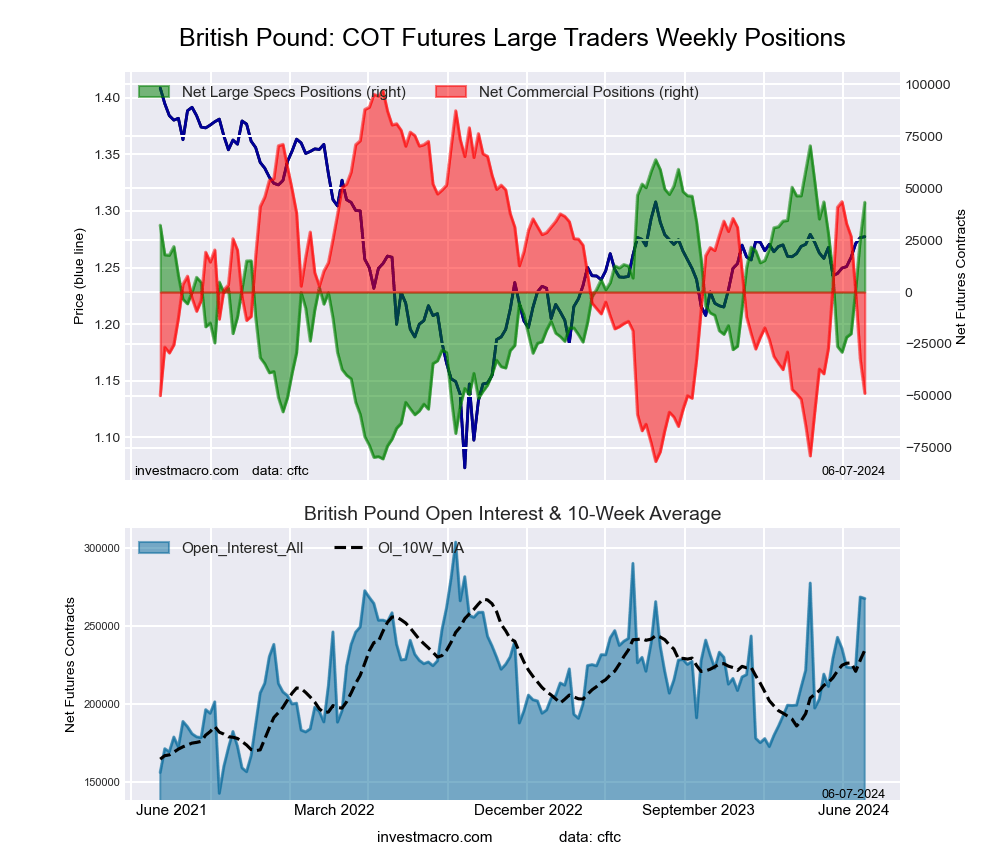
The British Pound Sterling large speculator standing this week was a net position of 43,210 contracts in the data reported through Tuesday. This was a weekly increase of 17,808 contracts from the previous week which had a total of 25,402 net contracts.

This week’s current strength score (the trader positioning range over the past three years, measured from 0 to 100) shows the speculators are currently Bullish-Extreme with a score of 81.9 percent. The commercials are Bearish-Extreme with a score of 18.4 percent and the small traders (not shown in chart) are Bullish with a score of 73.9 percent.

Price Trend-Following Model: Weak Downtrend

Our weekly trend-following model classifies the current market price position as: Weak Downtrend. The current action for the model is considered to be: Hold – Maintain Short Position.

BRITISH POUND StatisticsSPECULATORSCOMMERCIALSSMALL TRADERS
– Percent of Open Interest Longs:38.142.112.7
– Percent of Open Interest Shorts:22.060.310.6
– Net Position:43,210-48,7785,568
– Gross Longs:102,118112,71734,034
– Gross Shorts:58,908161,49528,466
– Long to Short Ratio:1.7 to 10.7 to 11.2 to 1
NET POSITION TREND:
– Strength Index Score (3 Year Range Pct):81.918.473.9
– Strength Index Reading (3 Year Range):Bullish-ExtremeBearish-ExtremeBullish
NET POSITION MOVEMENT INDEX:
– 6-Week Change in Strength Index:46.0-50.242.4


Japanese Yen Futures:

Japanese Yen Forex Futures COT Chart
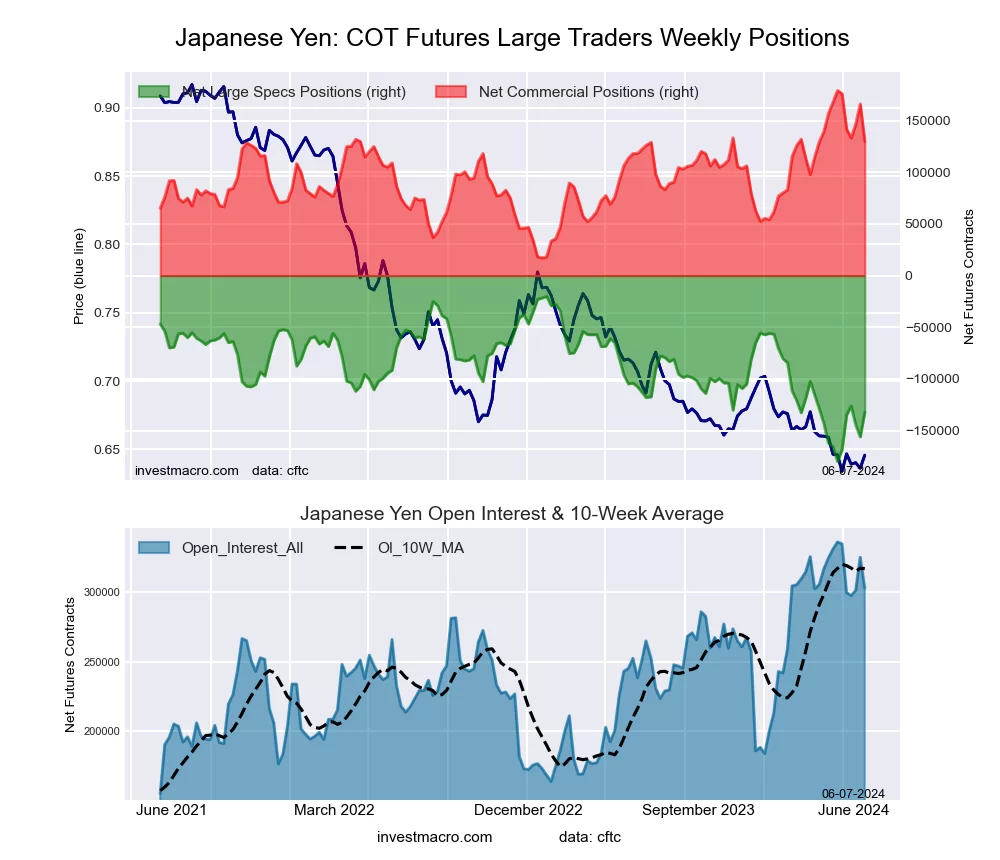
The Japanese Yen large speculator standing this week was a net position of -132,101 contracts in the data reported through Tuesday. This was a weekly gain of 23,938 contracts from the previous week which had a total of -156,039 net contracts.

This week’s current strength score (the trader positioning range over the past three years, measured from 0 to 100) shows the speculators are currently Bearish with a score of 29.9 percent. The commercials are Bullish with a score of 69.6 percent and the small traders (not shown in chart) are Bullish-Extreme with a score of 89.5 percent.

Price Trend-Following Model: Downtrend

Our weekly trend-following model classifies the current market price position as: Downtrend. The current action for the model is considered to be: Hold – Maintain Short Position.

JAPANESE YEN StatisticsSPECULATORSCOMMERCIALSSMALL TRADERS
– Percent of Open Interest Longs:13.367.614.7
– Percent of Open Interest Shorts:56.924.713.9
– Net Position:-132,101129,8952,206
– Gross Longs:40,427204,83044,416
– Gross Shorts:172,52874,93542,210
– Long to Short Ratio:0.2 to 12.7 to 11.1 to 1
NET POSITION TREND:
– Strength Index Score (3 Year Range Pct):29.969.689.5
– Strength Index Reading (3 Year Range):BearishBullishBullish-Extreme
NET POSITION MOVEMENT INDEX:
– 6-Week Change in Strength Index:29.9-30.44.5


Swiss Franc Futures:

Swiss Franc Forex Futures COT Chart
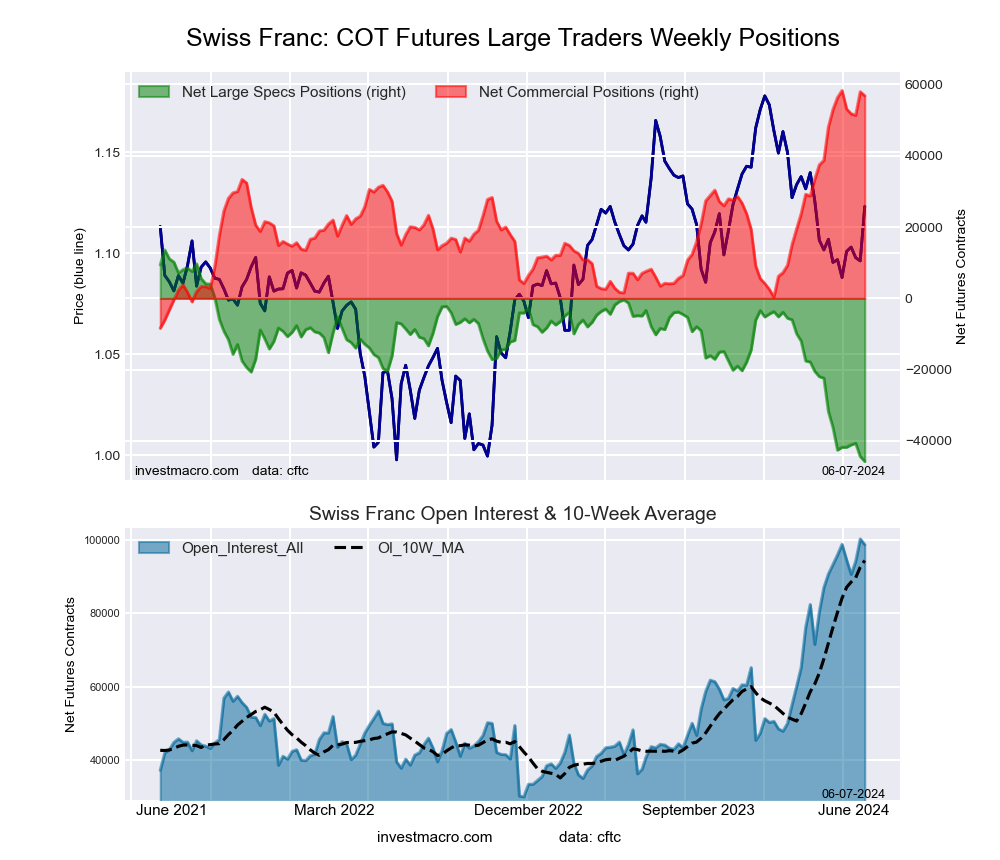
The Swiss Franc large speculator standing this week was a net position of -45,763 contracts in the data reported through Tuesday. This was a weekly lowering of -1,397 contracts from the previous week which had a total of -44,366 net contracts.

This week’s current strength score (the trader positioning range over the past three years, measured from 0 to 100) shows the speculators are currently Bearish-Extreme with a score of 0.0 percent. The commercials are Bullish-Extreme with a score of 97.8 percent and the small traders (not shown in chart) are Bearish with a score of 27.0 percent.

Price Trend-Following Model: Downtrend

Our weekly trend-following model classifies the current market price position as: Downtrend. The current action for the model is considered to be: Hold – Maintain Short Position.

SWISS FRANC StatisticsSPECULATORSCOMMERCIALSSMALL TRADERS
– Percent of Open Interest Longs:7.878.511.8
– Percent of Open Interest Shorts:54.221.023.0
– Net Position:-45,76356,817-11,054
– Gross Longs:7,75177,53411,667
– Gross Shorts:53,51420,71722,721
– Long to Short Ratio:0.1 to 13.7 to 10.5 to 1
NET POSITION TREND:
– Strength Index Score (3 Year Range Pct):0.097.827.0
– Strength Index Reading (3 Year Range):Bearish-ExtremeBullish-ExtremeBearish
NET POSITION MOVEMENT INDEX:
– 6-Week Change in Strength Index:-5.40.712.3


Canadian Dollar Futures:

Canadian Dollar Forex Futures COT Chart
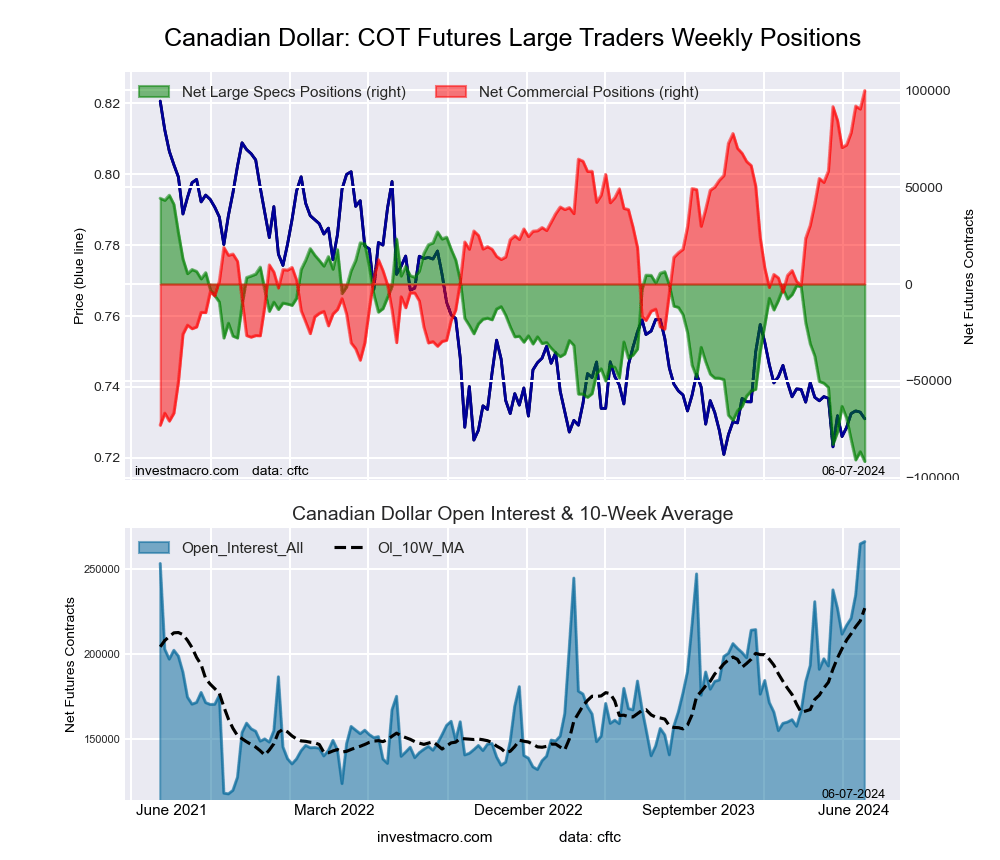
The Canadian Dollar large speculator standing this week was a net position of -91,639 contracts in the data reported through Tuesday. This was a weekly decrease of -5,054 contracts from the previous week which had a total of -86,585 net contracts.

This week’s current strength score (the trader positioning range over the past three years, measured from 0 to 100) shows the speculators are currently Bearish-Extreme with a score of 0.0 percent. The commercials are Bullish-Extreme with a score of 100.0 percent and the small traders (not shown in chart) are Bearish-Extreme with a score of 5.1 percent.

Price Trend-Following Model: Strong Downtrend

Our weekly trend-following model classifies the current market price position as: Strong Downtrend. The current action for the model is considered to be: Hold – Maintain Short Position.

CANADIAN DOLLAR StatisticsSPECULATORSCOMMERCIALSSMALL TRADERS
– Percent of Open Interest Longs:14.172.810.4
– Percent of Open Interest Shorts:48.535.213.5
– Net Position:-91,63999,904-8,265
– Gross Longs:37,360193,44927,528
– Gross Shorts:128,99993,54535,793
– Long to Short Ratio:0.3 to 12.1 to 10.8 to 1
NET POSITION TREND:
– Strength Index Score (3 Year Range Pct):0.0100.05.1
– Strength Index Reading (3 Year Range):Bearish-ExtremeBullish-ExtremeBearish-Extreme
NET POSITION MOVEMENT INDEX:
– 6-Week Change in Strength Index:-11.18.9-0.6


Australian Dollar Futures:

Australian Dollar Forex Futures COT Chart
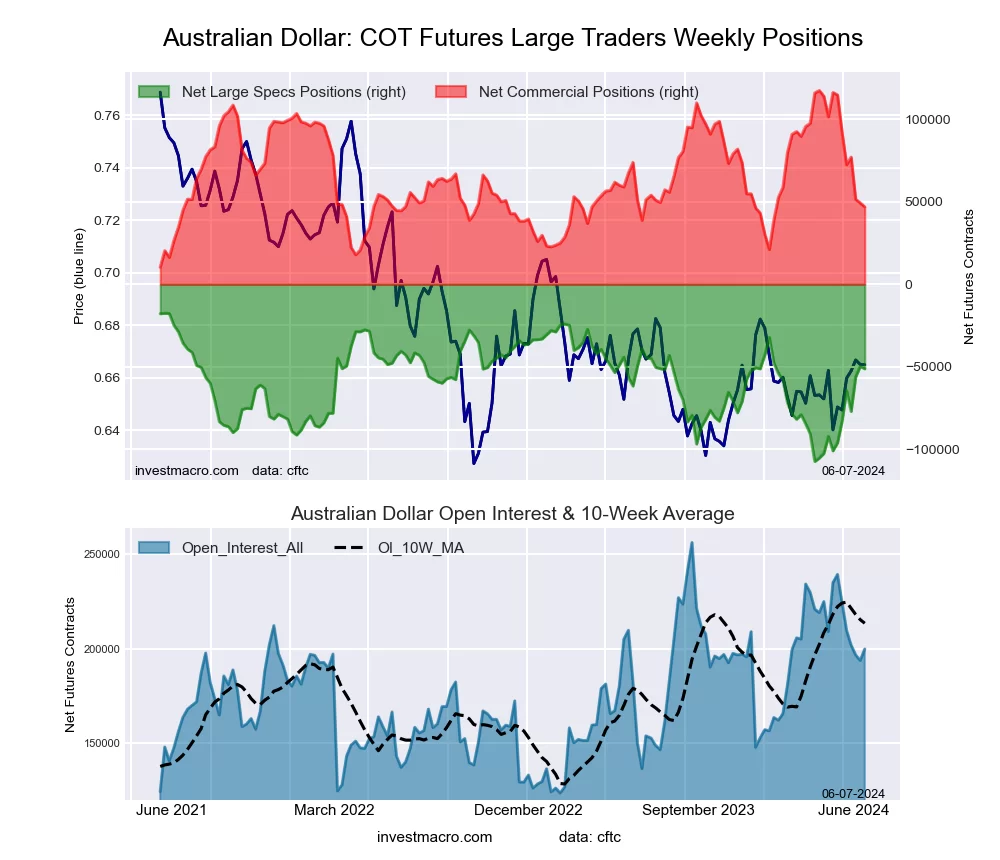
The Australian Dollar large speculator standing this week was a net position of -51,303 contracts in the data reported through Tuesday. This was a weekly decrease of -1,387 contracts from the previous week which had a total of -49,916 net contracts.

This week’s current strength score (the trader positioning range over the past three years, measured from 0 to 100) shows the speculators are currently Bullish with a score of 62.5 percent. The commercials are Bearish with a score of 34.1 percent and the small traders (not shown in chart) are Bullish with a score of 70.6 percent.

Price Trend-Following Model: Uptrend

Our weekly trend-following model classifies the current market price position as: Uptrend. The current action for the model is considered to be: Hold – Maintain Long Position.

AUSTRALIAN DOLLAR StatisticsSPECULATORSCOMMERCIALSSMALL TRADERS
– Percent of Open Interest Longs:25.958.613.5
– Percent of Open Interest Shorts:51.535.111.3
– Net Position:-51,30346,9234,380
– Gross Longs:51,661117,00026,878
– Gross Shorts:102,96470,07722,498
– Long to Short Ratio:0.5 to 11.7 to 11.2 to 1
NET POSITION TREND:
– Strength Index Score (3 Year Range Pct):62.534.170.6
– Strength Index Reading (3 Year Range):BullishBearishBullish
NET POSITION MOVEMENT INDEX:
– 6-Week Change in Strength Index:49.9-63.462.7


New Zealand Dollar Futures:

New Zealand Dollar Forex Futures COT Chart
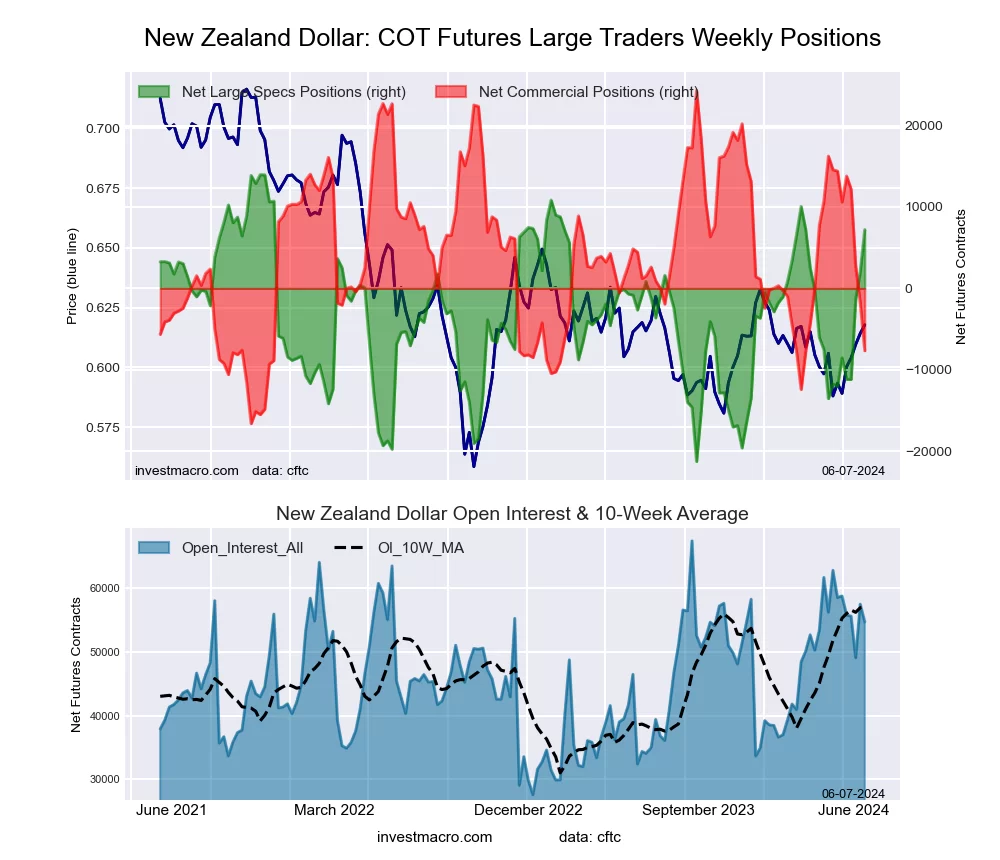
The New Zealand Dollar large speculator standing this week was a net position of 7,205 contracts in the data reported through Tuesday. This was a weekly gain of 5,159 contracts from the previous week which had a total of 2,046 net contracts.

This week’s current strength score (the trader positioning range over the past three years, measured from 0 to 100) shows the speculators are currently Bullish-Extreme with a score of 80.8 percent. The commercials are Bearish with a score of 21.9 percent and the small traders (not shown in chart) are Bullish with a score of 64.8 percent.

Price Trend-Following Model: Weak Downtrend

Our weekly trend-following model classifies the current market price position as: Weak Downtrend. The current action for the model is considered to be: Hold – Maintain Short Position.

NEW ZEALAND DOLLAR StatisticsSPECULATORSCOMMERCIALSSMALL TRADERS
– Percent of Open Interest Longs:54.434.87.4
– Percent of Open Interest Shorts:41.248.86.6
– Net Position:7,205-7,663458
– Gross Longs:29,79119,0654,058
– Gross Shorts:22,58626,7283,600
– Long to Short Ratio:1.3 to 10.7 to 11.1 to 1
NET POSITION TREND:
– Strength Index Score (3 Year Range Pct):80.821.964.8
– Strength Index Reading (3 Year Range):Bullish-ExtremeBearishBullish
NET POSITION MOVEMENT INDEX:
– 6-Week Change in Strength Index:54.6-53.939.1


Mexican Peso Futures:

Mexican Peso Futures COT Chart
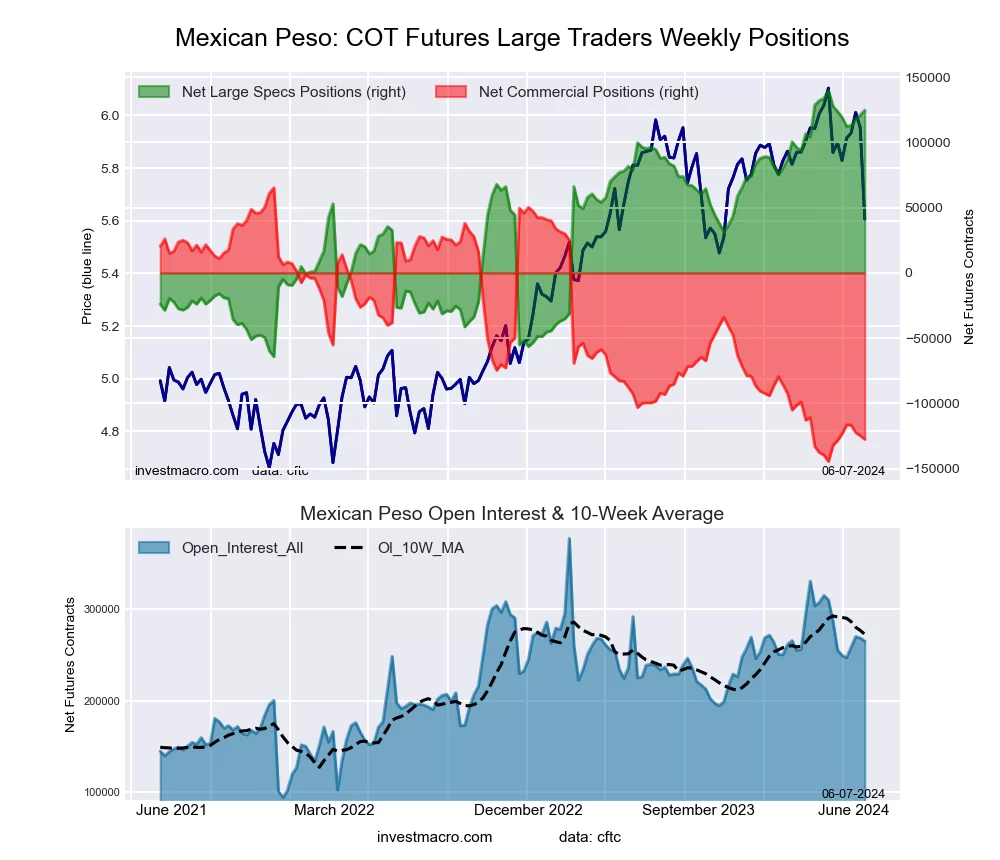
The Mexican Peso large speculator standing this week was a net position of 124,671 contracts in the data reported through Tuesday. This was a weekly rise of 3,752 contracts from the previous week which had a total of 120,919 net contracts.

This week’s current strength score (the trader positioning range over the past three years, measured from 0 to 100) shows the speculators are currently Bullish-Extreme with a score of 92.6 percent. The commercials are Bearish-Extreme with a score of 8.1 percent and the small traders (not shown in chart) are Bearish with a score of 28.6 percent.

Price Trend-Following Model: Strong Downtrend

Our weekly trend-following model classifies the current market price position as: Strong Downtrend. The current action for the model is considered to be: New Sell – Short Position.

MEXICAN PESO StatisticsSPECULATORSCOMMERCIALSSMALL TRADERS
– Percent of Open Interest Longs:58.137.62.2
– Percent of Open Interest Shorts:11.185.71.2
– Net Position:124,671-127,4102,739
– Gross Longs:153,94399,5525,875
– Gross Shorts:29,272226,9623,136
– Long to Short Ratio:5.3 to 10.4 to 11.9 to 1
NET POSITION TREND:
– Strength Index Score (3 Year Range Pct):92.68.128.6
– Strength Index Reading (3 Year Range):Bullish-ExtremeBearish-ExtremeBearish
NET POSITION MOVEMENT INDEX:
– 6-Week Change in Strength Index:0.50.5-12.7


Brazilian Real Futures:

Brazil Real Futures COT ChartThe Brazilian Real large speculator standing this week was a net position of -18,860 contracts in the data reported through Tuesday. This was a weekly boost of 17,722 contracts from the previous week which had a total of -36,582 net contracts.

This week’s current strength score (the trader positioning range over the past three years, measured from 0 to 100) shows the speculators are currently Bearish with a score of 21.9 percent. The commercials are Bullish-Extreme with a score of 80.0 percent and the small traders (not shown in chart) are Bearish with a score of 22.7 percent.

Price Trend-Following Model: Strong Downtrend

Our weekly trend-following model classifies the current market price position as: Strong Downtrend. The current action for the model is considered to be: Hold – Maintain Short Position.

BRAZIL REAL StatisticsSPECULATORSCOMMERCIALSSMALL TRADERS
– Percent of Open Interest Longs:49.347.12.7
– Percent of Open Interest Shorts:78.216.34.7
– Net Position:-18,86020,125-1,265
– Gross Longs:32,23130,7681,785
– Gross Shorts:51,09110,6433,050
– Long to Short Ratio:0.6 to 12.9 to 10.6 to 1
NET POSITION TREND:
– Strength Index Score (3 Year Range Pct):21.980.022.7
– Strength Index Reading (3 Year Range):BearishBullish-ExtremeBearish
NET POSITION MOVEMENT INDEX:
– 6-Week Change in Strength Index:-22.322.8-8.0


Bitcoin Futures:

Bitcoin Crypto Futures COT Chart
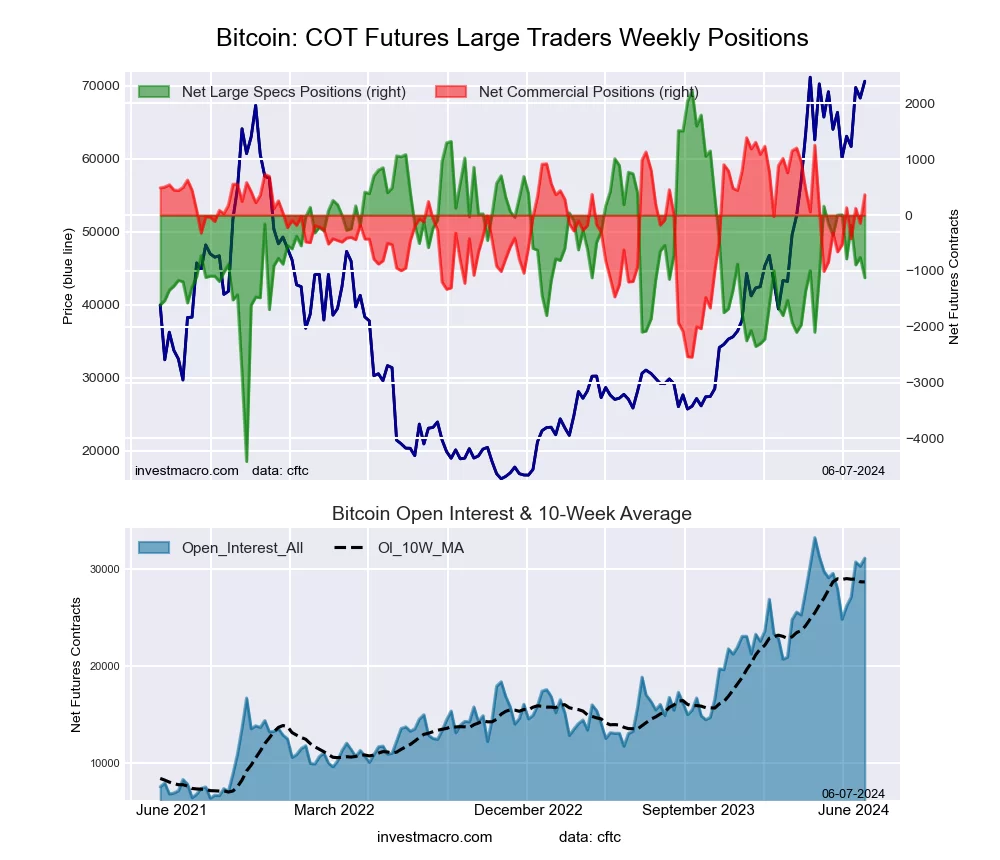
The Bitcoin large speculator standing this week was a net position of -1,119 contracts in the data reported through Tuesday. This was a weekly lowering of -363 contracts from the previous week which had a total of -756 net contracts.

This week’s current strength score (the trader positioning range over the past three years, measured from 0 to 100) shows the speculators are currently Bearish with a score of 49.6 percent. The commercials are Bullish with a score of 74.0 percent and the small traders (not shown in chart) are Bearish with a score of 30.1 percent.

Price Trend-Following Model: Uptrend

Our weekly trend-following model classifies the current market price position as: Uptrend. The current action for the model is considered to be: Hold – Maintain Long Position.

BITCOIN StatisticsSPECULATORSCOMMERCIALSSMALL TRADERS
– Percent of Open Interest Longs:78.74.75.2
– Percent of Open Interest Shorts:82.33.62.7
– Net Position:-1,119366753
– Gross Longs:24,4701,4721,601
– Gross Shorts:25,5891,106848
– Long to Short Ratio:1.0 to 11.3 to 11.9 to 1
NET POSITION TREND:
– Strength Index Score (3 Year Range Pct):49.674.030.1
– Strength Index Reading (3 Year Range):BearishBullishBearish
NET POSITION MOVEMENT INDEX:
– 6-Week Change in Strength Index:-16.826.02.2


Article By InvestMacroReceive our weekly COT Newsletter

*COT Report: The COT data, released weekly to the public each Friday, is updated through the most recent Tuesday (data is 3 days old) and shows a quick view of how large speculators or non-commercials (for-profit traders) were positioned in the futures markets.

The CFTC categorizes trader positions according to commercial hedgers (traders who use futures contracts for hedging as part of the business), non-commercials (large traders who speculate to realize trading profits) and nonreportable traders (usually small traders/speculators) as well as their open interest (contracts open in the market at time of reporting). See CFTC criteria here.