Archive for CountingPips Forex Blog – Page 20

COT Soft Commodities Speculators raise their Corn bullish bets for 3rd time in 4 weeks

By InvestMacro | COT | Data Tables | COT Leaders | Downloads | COT Newsletter

Here are the latest charts and statistics for the Commitment of Traders (COT) data published by the Commodities Futures Trading Commission (CFTC).

The latest COT data is updated through Tuesday December 7th 2021 and shows a quick view of how large traders (for-profit speculators and commercial entities) were positioned in the futures markets.

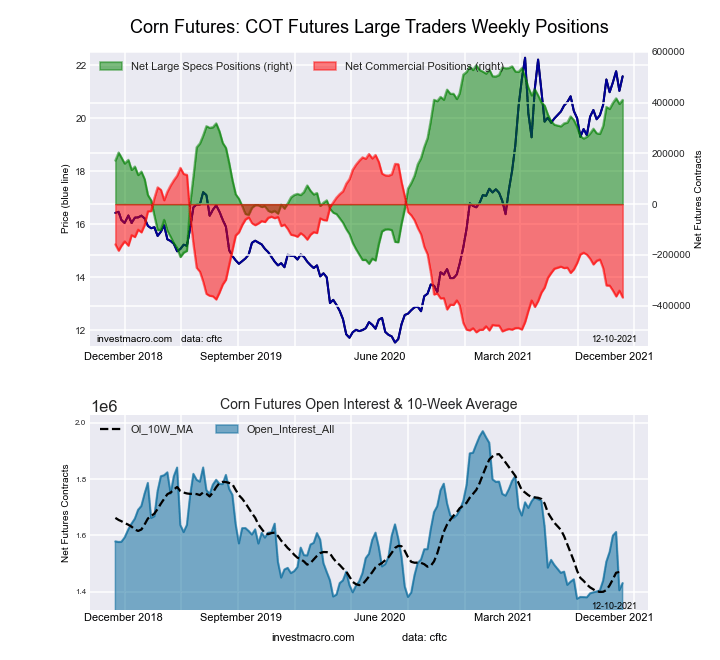
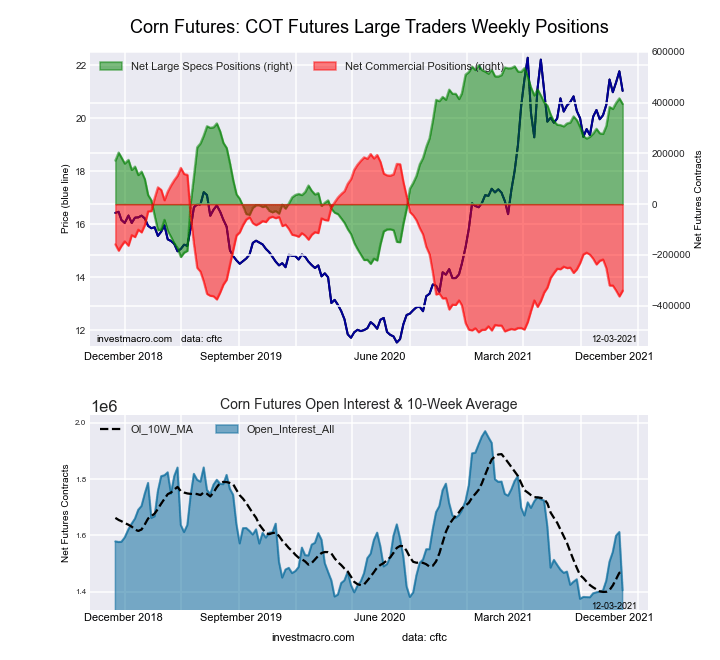
Highlighting this week’s COT soft commodities data is the recent rises in Corn futures bets. The speculative net position in the Corn futures has gained in three out of the past four weeks with the total rise of +35,516 contracts over that four-week time-frame. The current net standing is now over +400,000 net contracts for just the second time in the past twenty-five weeks as Corn continues to hold an extreme bullish strength score at 82.5 percent (current speculator standing compared to past three years, above 80 is bullish extreme, below 20 is bearish extreme).

The soft commodities that saw higher bets this week were Corn (15,902 contracts), Soybeans (4,337 contracts) and Live Cattle (2,869 contracts).

The markets that saw lower bets this week were Sugar (-23,756 contracts), Coffee (-3,681 contracts), Soybean Oil (-2,602 contracts), Soybean Meal (-8,478 contracts), Lean Hogs (-7,652 contracts), Cotton (-6,981 contracts), Cocoa (-1,598 contracts), and Wheat (-2,627 contracts).


Data Snapshot of Commodity Market Traders | Columns Legend
Dec-07-2021OIOI-IndexSpec-NetSpec-IndexCom-NetCOM-IndexSmalls-NetSmalls-Index
WTI Crude1,972,5363367,23229-400,4316233,19962
Gold499,30723217,18557-245,6234328,43845
Silver136,572429,83352-43,1485713,31517
Copper173,95487,20448-14,219507,01566
Palladium9,25312-2,73143,03697-30527
Platinum65,134306,06211-12,138926,07647
Natural Gas1,205,62620-132,4433999,3726233,07163
Brent211,25448-20,4468417,107173,33955
Heating Oil298,99708,59755-21,3514912,75443
Soybeans672,1161559,65445-22,74460-36,91010
Corn1,430,4019410,81483-367,87320-42,94118
Coffee265,0463362,34494-65,59683,25211
Sugar857,6218191,23976-221,2892630,05045
Wheat359,1861215,66760-8,38633-7,28167


CORN Futures:

Federal Funds 30-Day Bonds Futures COT ChartThe CORN large speculator standing this week reached a net position of 410,814 contracts in the data reported through Tuesday. This was a weekly rise of 15,902 contracts from the previous week which had a total of 394,912 net contracts.

This week’s current strength score (the trader positioning range over the past three years, measured from 0 to 100) shows the speculators are currently Bullish-Extreme with a score of 82.5 percent. The commercials are Bearish-Extreme with a score of 19.5 percent and the small traders (not shown in chart) are Bearish-Extreme with a score of 18.3 percent.

CORN Futures StatisticsSPECULATORSCOMMERCIALSSMALL TRADERS
– Percent of Open Interest Longs:33.746.48.9
– Percent of Open Interest Shorts:5.072.111.9
– Net Position:410,814-367,873-42,941
– Gross Longs:482,428663,484127,218
– Gross Shorts:71,6141,031,357170,159
– Long to Short Ratio:6.7 to 10.6 to 10.7 to 1
NET POSITION TREND:
– Strength Index Score (3 Year Range Pct):82.519.518.3
– Strength Index Reading (3 Year Range):Bullish-ExtremeBearish-ExtremeBearish-Extreme
NET POSITION MOVEMENT INDEX:
– 6-Week Change in Strength Index:13.2-16.57.4


SUGAR Futures:

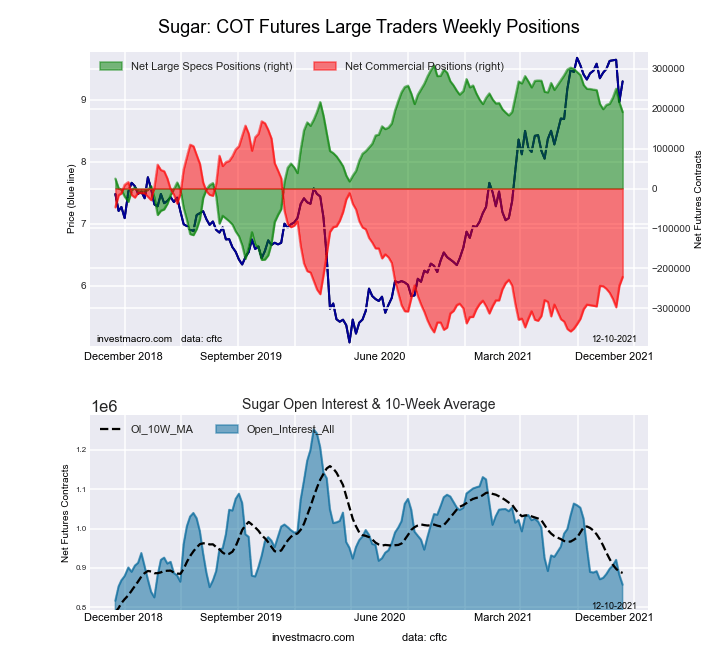
2-Year Treasury Bonds Futures COT ChartThe SUGAR large speculator standing this week reached a net position of 191,239 contracts in the data reported through Tuesday. This was a weekly lowering of -23,756 contracts from the previous week which had a total of 214,995 net contracts.

This week’s current strength score (the trader positioning range over the past three years, measured from 0 to 100) shows the speculators are currently Bullish with a score of 75.9 percent. The commercials are Bearish with a score of 26.2 percent and the small traders (not shown in chart) are Bearish with a score of 45.0 percent.

SUGAR Futures StatisticsSPECULATORSCOMMERCIALSSMALL TRADERS
– Percent of Open Interest Longs:29.048.19.4
– Percent of Open Interest Shorts:6.773.95.9
– Net Position:191,239-221,28930,050
– Gross Longs:248,411412,29580,891
– Gross Shorts:57,172633,58450,841
– Long to Short Ratio:4.3 to 10.7 to 11.6 to 1
NET POSITION TREND:
– Strength Index Score (3 Year Range Pct):75.926.245.0
– Strength Index Reading (3 Year Range):BullishBearishBearish
NET POSITION MOVEMENT INDEX:
– 6-Week Change in Strength Index:-1.54.4-19.4


COFFEE Futures:

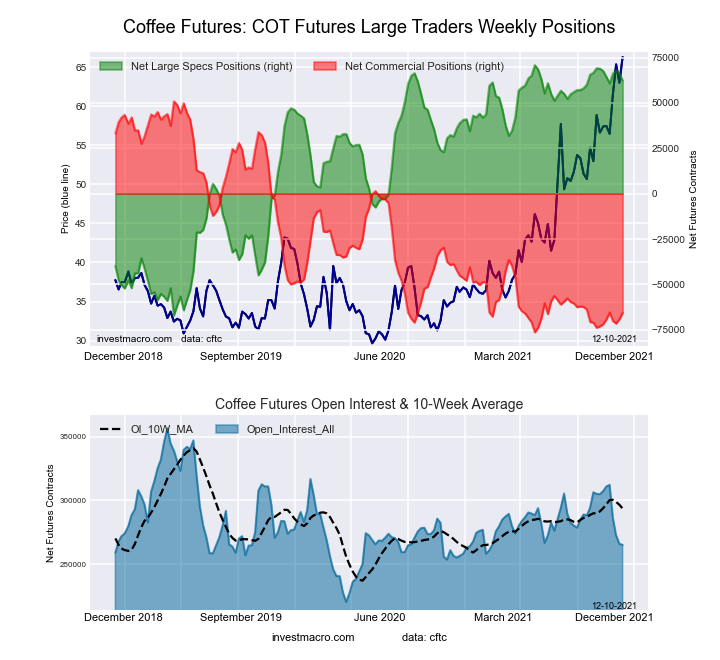
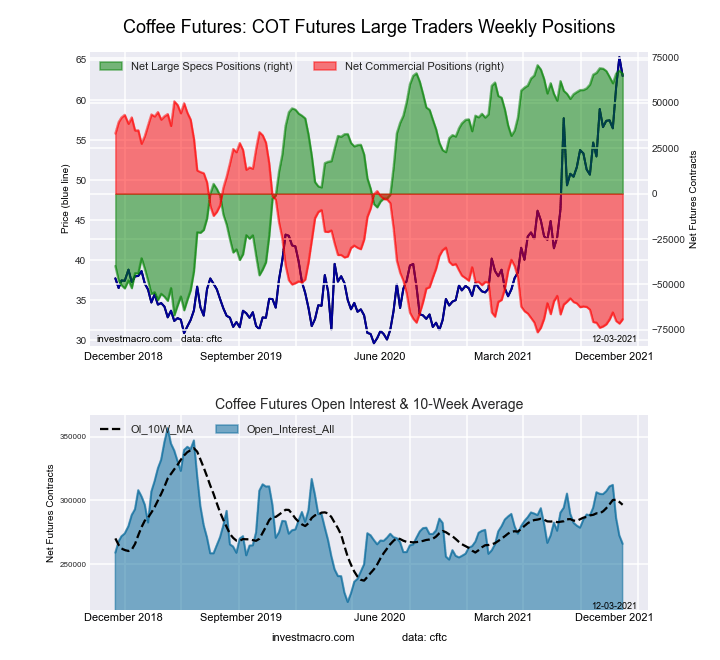
5-Year Treasury Bonds Futures COT ChartThe COFFEE large speculator standing this week reached a net position of 62,344 contracts in the data reported through Tuesday. This was a weekly lowering of -3,681 contracts from the previous week which had a total of 66,025 net contracts.

This week’s current strength score (the trader positioning range over the past three years, measured from 0 to 100) shows the speculators are currently Bullish-Extreme with a score of 93.9 percent. The commercials are Bearish-Extreme with a score of 8.4 percent and the small traders (not shown in chart) are Bearish-Extreme with a score of 10.8 percent.

COFFEE Futures StatisticsSPECULATORSCOMMERCIALSSMALL TRADERS
– Percent of Open Interest Longs:29.047.23.8
– Percent of Open Interest Shorts:5.571.92.5
– Net Position:62,344-65,5963,252
– Gross Longs:76,852125,10010,004
– Gross Shorts:14,508190,6966,752
– Long to Short Ratio:5.3 to 10.7 to 11.5 to 1
NET POSITION TREND:
– Strength Index Score (3 Year Range Pct):93.98.410.8
– Strength Index Reading (3 Year Range):Bullish-ExtremeBearish-ExtremeBearish-Extreme
NET POSITION MOVEMENT INDEX:
– 6-Week Change in Strength Index:-3.85.0-7.4


SOYBEANS Futures:

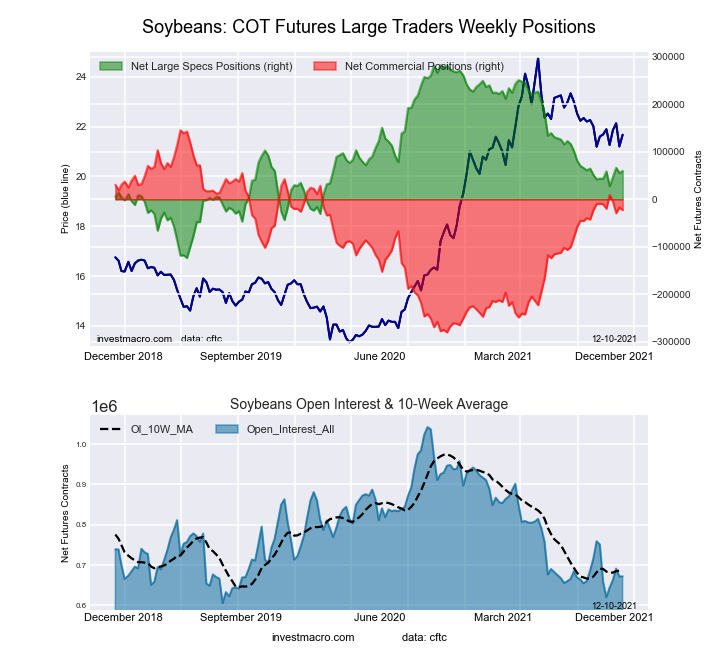
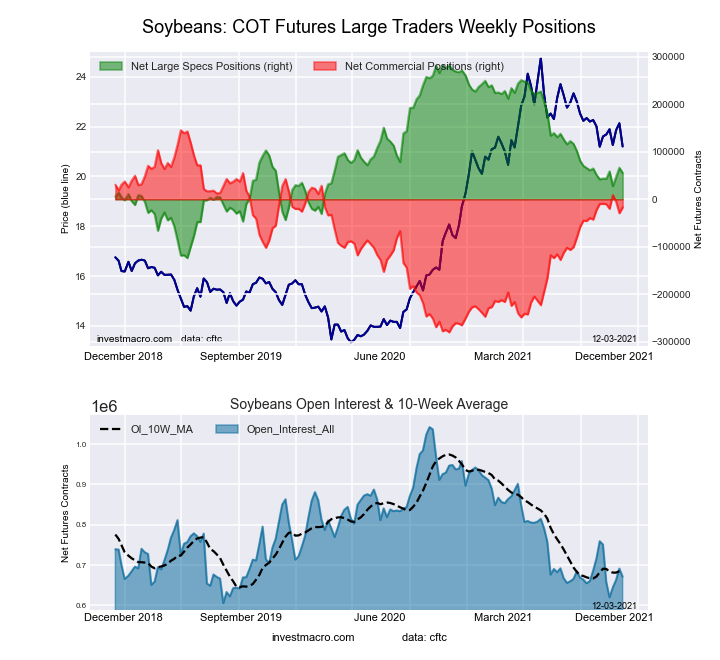
10-Year Treasury Notes Bonds Futures COT ChartThe SOYBEANS large speculator standing this week reached a net position of 59,654 contracts in the data reported through Tuesday. This was a weekly rise of 4,337 contracts from the previous week which had a total of 55,317 net contracts.

This week’s current strength score (the trader positioning range over the past three years, measured from 0 to 100) shows the speculators are currently Bearish with a score of 45.1 percent. The commercials are Bullish with a score of 60.5 percent and the small traders (not shown in chart) are Bearish-Extreme with a score of 10.4 percent.

SOYBEANS Futures StatisticsSPECULATORSCOMMERCIALSSMALL TRADERS
– Percent of Open Interest Longs:18.657.57.0
– Percent of Open Interest Shorts:9.860.912.5
– Net Position:59,654-22,744-36,910
– Gross Longs:125,257386,50046,981
– Gross Shorts:65,603409,24483,891
– Long to Short Ratio:1.9 to 10.9 to 10.6 to 1
NET POSITION TREND:
– Strength Index Score (3 Year Range Pct):45.160.510.4
– Strength Index Reading (3 Year Range):BearishBullishBearish-Extreme
NET POSITION MOVEMENT INDEX:
– 6-Week Change in Strength Index:4.1-3.0-6.4


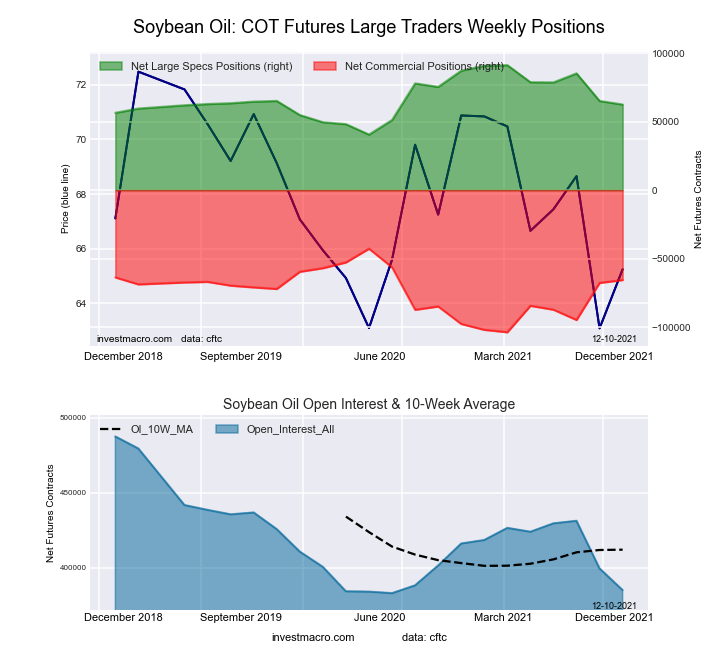
SOYBEAN OIL Futures:

Ultra 10-Year Treasury Notes Bonds Futures COT ChartThe SOYBEAN OIL large speculator standing this week reached a net position of 62,445 contracts in the data reported through Tuesday. This was a weekly reduction of -2,602 contracts from the previous week which had a total of 65,047 net contracts.

This week’s current strength score (the trader positioning range over the past three years, measured from 0 to 100) shows the speculators are currently Bullish with a score of 57.5 percent. The commercials are Bearish with a score of 47.0 percent and the small traders (not shown in chart) are Bearish with a score of 24.9 percent.

SOYBEAN OIL Futures StatisticsSPECULATORSCOMMERCIALSSMALL TRADERS
– Percent of Open Interest Longs:26.451.97.1
– Percent of Open Interest Shorts:10.269.06.3
– Net Position:62,445-65,5013,056
– Gross Longs:101,774199,94227,293
– Gross Shorts:39,329265,44324,237
– Long to Short Ratio:2.6 to 10.8 to 11.1 to 1
NET POSITION TREND:
– Strength Index Score (3 Year Range Pct):57.547.024.9
– Strength Index Reading (3 Year Range):BullishBearishBearish
NET POSITION MOVEMENT INDEX:
– 6-Week Change in Strength Index:-15.318.2-30.0


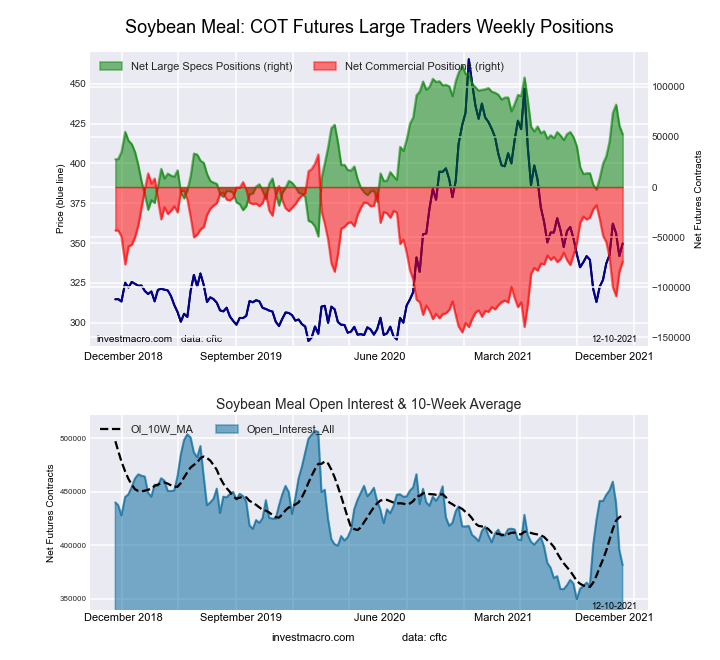
SOYBEAN MEAL Futures:

US Year Treasury Notes Long Bonds Futures COT ChartThe SOYBEAN MEAL large speculator standing this week reached a net position of 52,643 contracts in the data reported through Tuesday. This was a weekly fall of -8,478 contracts from the previous week which had a total of 61,121 net contracts.

This week’s current strength score (the trader positioning range over the past three years, measured from 0 to 100) shows the speculators are currently Bullish with a score of 59.6 percent. The commercials are Bearish with a score of 39.8 percent and the small traders (not shown in chart) are Bullish with a score of 57.6 percent.

SOYBEAN MEAL Futures StatisticsSPECULATORSCOMMERCIALSSMALL TRADERS
– Percent of Open Interest Longs:22.149.412.8
– Percent of Open Interest Shorts:8.368.97.1
– Net Position:52,643-74,34121,698
– Gross Longs:84,189188,49448,687
– Gross Shorts:31,546262,83526,989
– Long to Short Ratio:2.7 to 10.7 to 11.8 to 1
NET POSITION TREND:
– Strength Index Score (3 Year Range Pct):59.639.857.6
– Strength Index Reading (3 Year Range):BullishBearishBullish
NET POSITION MOVEMENT INDEX:
– 6-Week Change in Strength Index:17.1-14.5-13.6


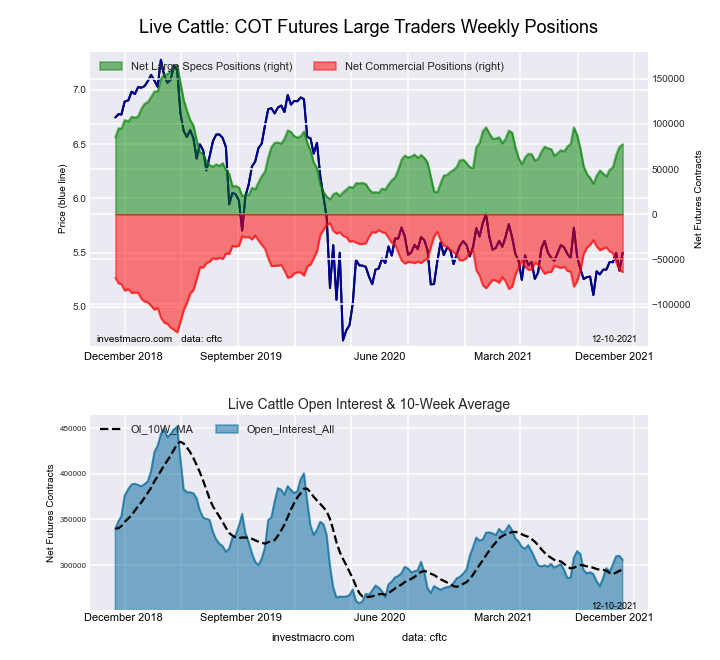
LIVE CATTLE Futures:

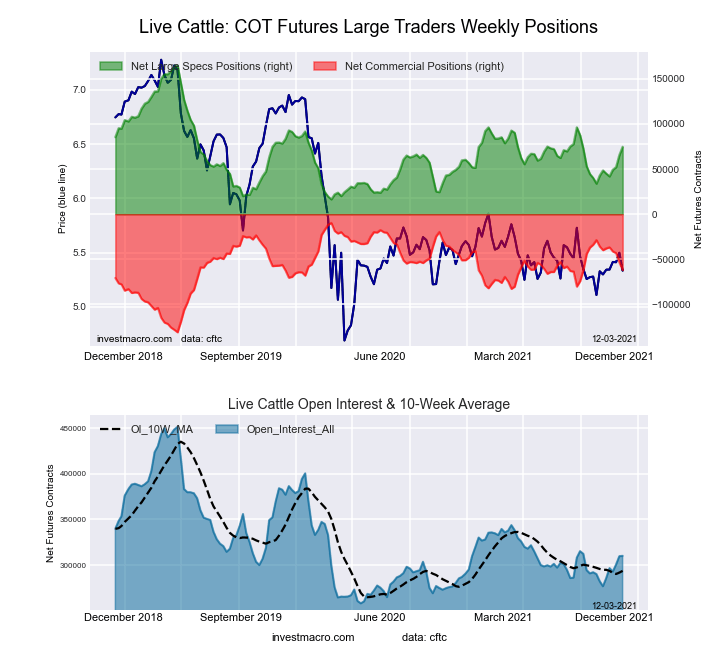
Ultra US Year Treasury Notes Long Bonds Futures COT ChartThe LIVE CATTLE large speculator standing this week reached a net position of 77,523 contracts in the data reported through Tuesday. This was a weekly advance of 2,869 contracts from the previous week which had a total of 74,654 net contracts.

This week’s current strength score (the trader positioning range over the past three years, measured from 0 to 100) shows the speculators are currently Bearish with a score of 41.1 percent. The commercials are Bullish with a score of 55.2 percent and the small traders (not shown in chart) are Bullish with a score of 54.1 percent.

LIVE CATTLE Futures StatisticsSPECULATORSCOMMERCIALSSMALL TRADERS
– Percent of Open Interest Longs:39.637.79.2
– Percent of Open Interest Shorts:14.258.613.6
– Net Position:77,523-63,995-13,528
– Gross Longs:120,946115,14928,080
– Gross Shorts:43,423179,14441,608
– Long to Short Ratio:2.8 to 10.6 to 10.7 to 1
NET POSITION TREND:
– Strength Index Score (3 Year Range Pct):41.155.254.1
– Strength Index Reading (3 Year Range):BearishBullishBullish
NET POSITION MOVEMENT INDEX:
– 6-Week Change in Strength Index:21.9-21.6-15.7


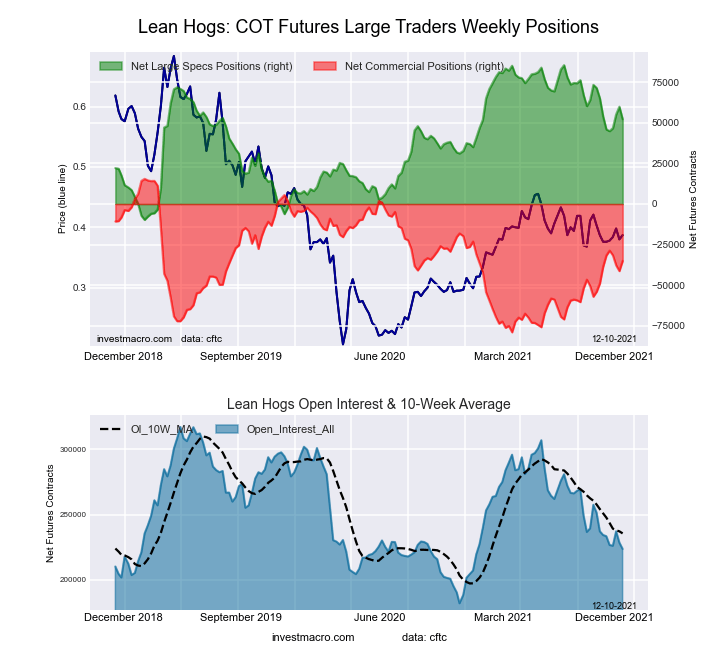
LEAN HOGS Futures:

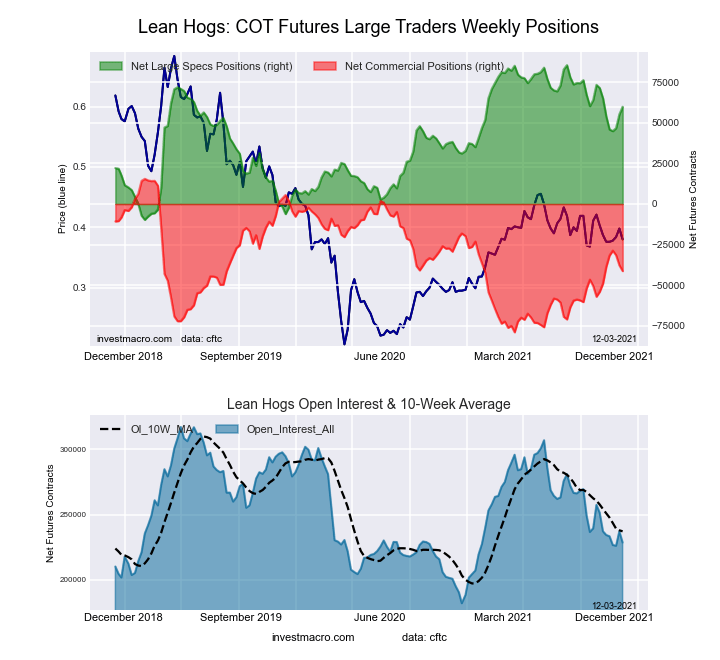
Eurodollar Bonds Futures COT ChartThe LEAN HOGS large speculator standing this week reached a net position of 52,297 contracts in the data reported through Tuesday. This was a weekly fall of -7,652 contracts from the previous week which had a total of 59,949 net contracts.

This week’s current strength score (the trader positioning range over the past three years, measured from 0 to 100) shows the speculators are currently Bullish with a score of 65.1 percent. The commercials are Bearish with a score of 46.5 percent and the small traders (not shown in chart) are Bearish-Extreme with a score of 6.0 percent.

LEAN HOGS Futures StatisticsSPECULATORSCOMMERCIALSSMALL TRADERS
– Percent of Open Interest Longs:41.534.76.8
– Percent of Open Interest Shorts:18.150.414.5
– Net Position:52,297-35,096-17,201
– Gross Longs:92,82477,62715,221
– Gross Shorts:40,527112,72332,422
– Long to Short Ratio:2.3 to 10.7 to 10.5 to 1
NET POSITION TREND:
– Strength Index Score (3 Year Range Pct):65.146.56.0
– Strength Index Reading (3 Year Range):BullishBearishBearish-Extreme
NET POSITION MOVEMENT INDEX:
– 6-Week Change in Strength Index:-1.83.9-8.2


COTTON Futures:

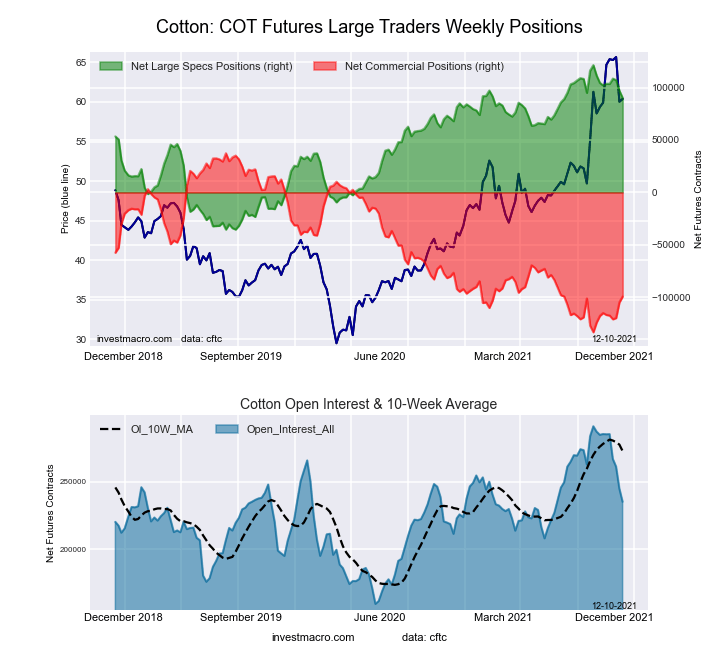
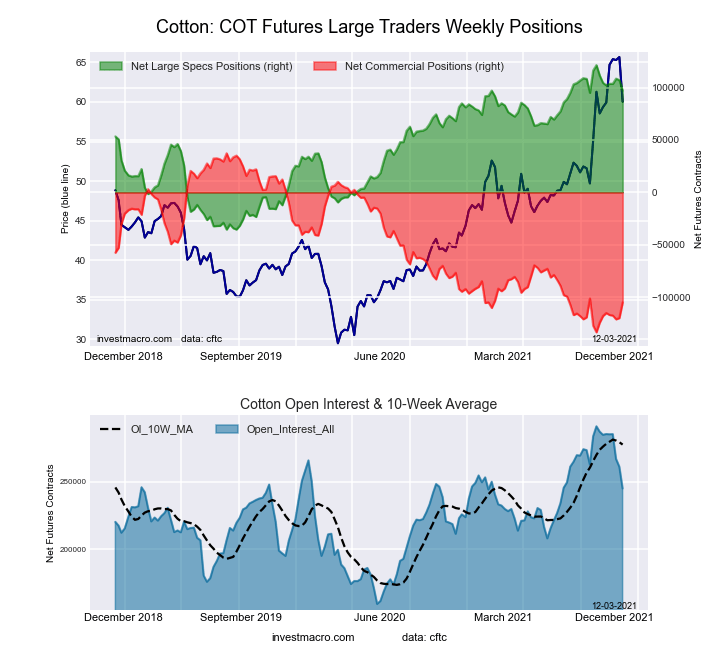
Ultra 10-Year Treasury Notes Bonds Futures COT ChartThe COTTON large speculator standing this week reached a net position of 90,014 contracts in the data reported through Tuesday. This was a weekly decline of -6,981 contracts from the previous week which had a total of 96,995 net contracts.

This week’s current strength score (the trader positioning range over the past three years, measured from 0 to 100) shows the speculators are currently Bullish-Extreme with a score of 80.0 percent. The commercials are Bearish-Extreme with a score of 19.9 percent and the small traders (not shown in chart) are Bullish with a score of 71.5 percent.

COTTON Futures StatisticsSPECULATORSCOMMERCIALSSMALL TRADERS
– Percent of Open Interest Longs:44.136.27.1
– Percent of Open Interest Shorts:5.878.53.2
– Net Position:90,014-99,3039,289
– Gross Longs:103,61185,09516,792
– Gross Shorts:13,597184,3987,503
– Long to Short Ratio:7.6 to 10.5 to 12.2 to 1
NET POSITION TREND:
– Strength Index Score (3 Year Range Pct):80.019.971.5
– Strength Index Reading (3 Year Range):Bullish-ExtremeBearish-ExtremeBullish
NET POSITION MOVEMENT INDEX:
– 6-Week Change in Strength Index:-7.79.2-22.5


COCOA Futures:

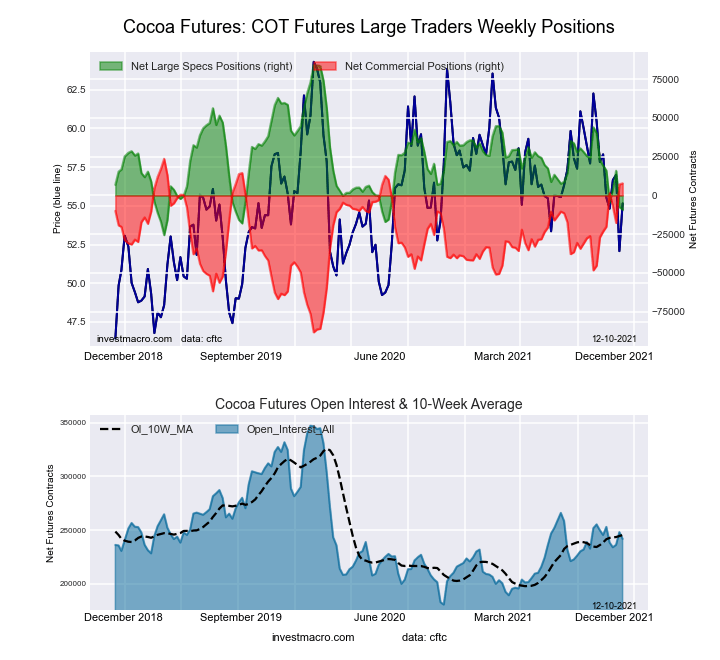
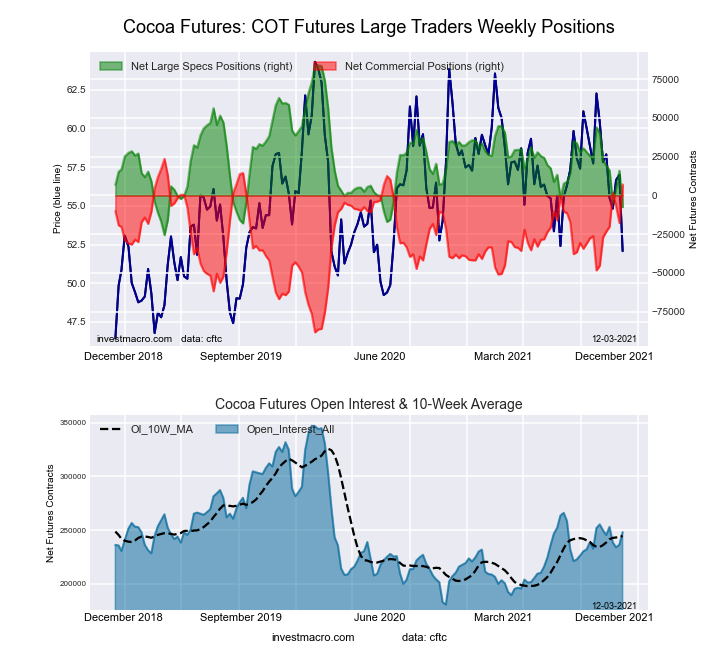
US Year Treasury Notes Long Bonds Futures COT ChartThe COCOA large speculator standing this week reached a net position of -9,095 contracts in the data reported through Tuesday. This was a weekly decrease of -1,598 contracts from the previous week which had a total of -7,497 net contracts.

This week’s current strength score (the trader positioning range over the past three years, measured from 0 to 100) shows the speculators are currently Bearish-Extreme with a score of 15.0 percent. The commercials are Bullish-Extreme with a score of 85.9 percent and the small traders (not shown in chart) are Bearish with a score of 23.2 percent.

COCOA Futures StatisticsSPECULATORSCOMMERCIALSSMALL TRADERS
– Percent of Open Interest Longs:26.354.14.8
– Percent of Open Interest Shorts:30.050.84.3
– Net Position:-9,0957,7991,296
– Gross Longs:63,483130,73411,672
– Gross Shorts:72,578122,93510,376
– Long to Short Ratio:0.9 to 11.1 to 11.1 to 1
NET POSITION TREND:
– Strength Index Score (3 Year Range Pct):15.085.923.2
– Strength Index Reading (3 Year Range):Bearish-ExtremeBullish-ExtremeBearish
NET POSITION MOVEMENT INDEX:
– 6-Week Change in Strength Index:-25.827.7-31.4


WHEAT Futures:

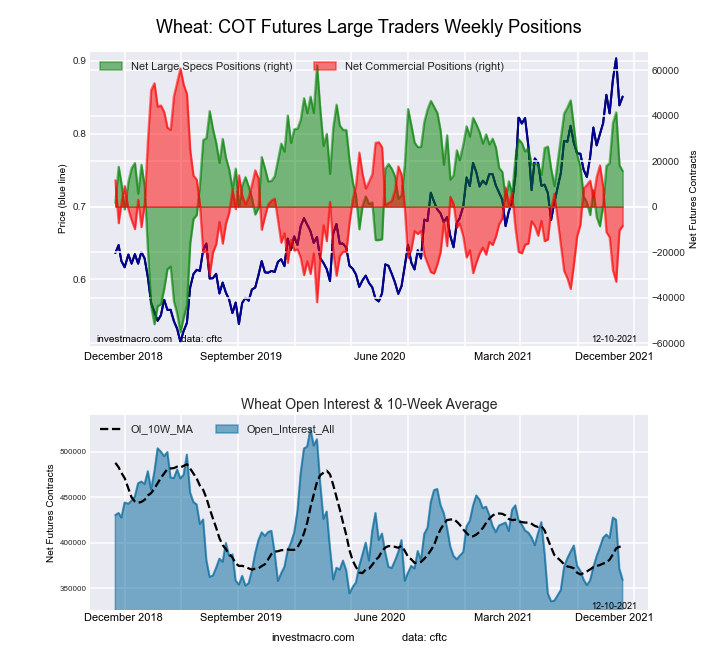
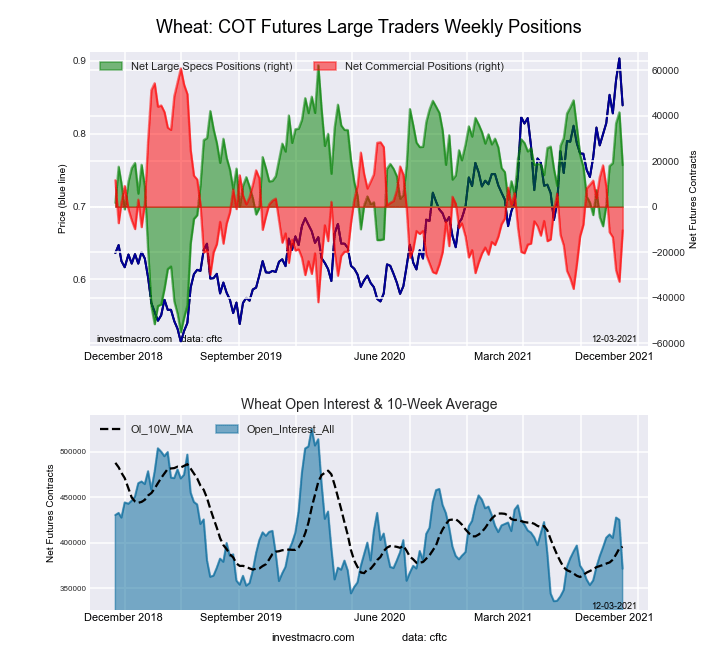
Ultra US Year Treasury Notes Long Bonds Futures COT ChartThe WHEAT large speculator standing this week reached a net position of 15,667 contracts in the data reported through Tuesday. This was a weekly decrease of -2,627 contracts from the previous week which had a total of 18,294 net contracts.

This week’s current strength score (the trader positioning range over the past three years, measured from 0 to 100) shows the speculators are currently Bullish with a score of 60.4 percent. The commercials are Bearish with a score of 32.7 percent and the small traders (not shown in chart) are Bullish with a score of 66.8 percent.

WHEAT Futures StatisticsSPECULATORSCOMMERCIALSSMALL TRADERS
– Percent of Open Interest Longs:31.235.59.2
– Percent of Open Interest Shorts:26.837.811.3
– Net Position:15,667-8,386-7,281
– Gross Longs:111,973127,43533,159
– Gross Shorts:96,306135,82140,440
– Long to Short Ratio:1.2 to 10.9 to 10.8 to 1
NET POSITION TREND:
– Strength Index Score (3 Year Range Pct):60.432.766.8
– Strength Index Reading (3 Year Range):BullishBearishBullish
NET POSITION MOVEMENT INDEX:
– 6-Week Change in Strength Index:12.7-16.710.7


Article By InvestMacroReceive our weekly COT Reports by Email

*COT Report: The COT data, released weekly to the public each Friday, is updated through the most recent Tuesday (data is 3 days old) and shows a quick view of how large speculators or non-commercials (for-profit traders) were positioned in the futures markets.

The CFTC categorizes trader positions according to commercial hedgers (traders who use futures contracts for hedging as part of the business), non-commercials (large traders who speculate to realize trading profits) and nonreportable traders (usually small traders/speculators) as well as their open interest (contracts open in the market at time of reporting).See CFTC criteria here.

COT Metals Speculators drop Silver bullish bets to 8-week low

By InvestMacro | COT | Data Tables | COT Leaders | Downloads | COT Newsletter

Here are the latest charts and statistics for the Commitment of Traders (COT) data published by the Commodities Futures Trading Commission (CFTC).

The latest COT data is updated through Tuesday December 7th 2021 and shows a quick view of how large traders (for-profit speculators and commercial entities) were positioned in the futures markets.

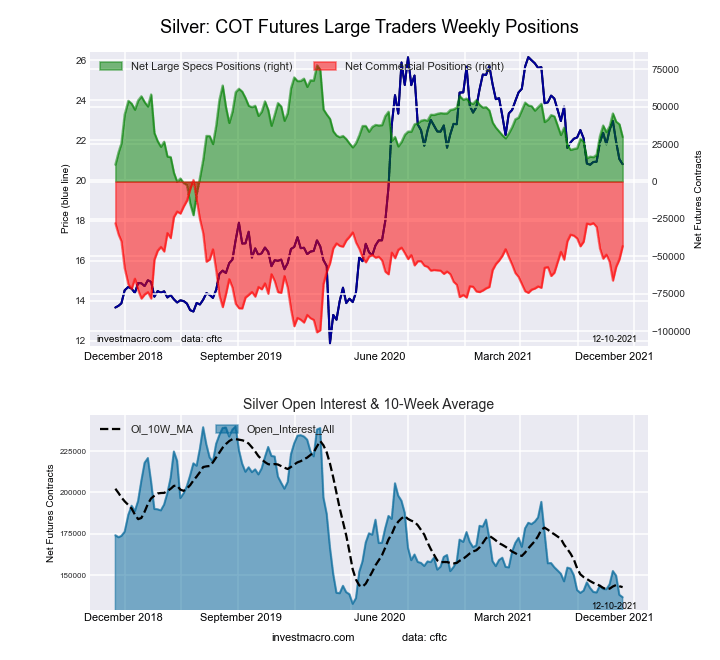
Highlighting this week’s COT metals data is the recent decline in the Silver futures bets. The speculative net position in the Silver futures has fallen for three consecutive weeks and by a total of -15,792 contracts over that time-frame. This weakness has brought the current standing for Silver net positions to the least bullish level in the past eight weeks, dating back to October 12th. Speculators had been raising their positions for Silver in recent months with bullish bets hitting a 22-week high on November 16th before turning lower. Despite the recent declines, the Silver strength index (current positioning compared to the positioning of the past three years) remains almost right down the middle at a 52.1 percent score.

Joining Silver (-8,601 contracts) in falling this week are Gold (-8,675 contracts), Copper (-1,987 contracts), Platinum (-2,886 contracts) while the Palladium (242 contracts) were the only rising futures contracts for speculators this week in the metals we cover.


Data Snapshot of Commodity Market Traders | Columns Legend
Dec-07-2021OIOI-IndexSpec-NetSpec-IndexCom-NetCOM-IndexSmalls-NetSmalls-Index
WTI Crude1,972,5363367,23229-400,4316233,19962
Gold499,30723217,18557-245,6234328,43845
Silver136,572429,83352-43,1485713,31517
Copper173,95487,20448-14,219507,01566
Palladium9,25312-2,73143,03697-30527
Platinum65,134306,06211-12,138926,07647
Natural Gas1,205,62620-132,4433999,3726233,07163
Brent211,25448-20,4468417,107173,33955
Heating Oil298,99708,59755-21,3514912,75443
Soybeans672,1161559,65445-22,74460-36,91010
Corn1,430,4019410,81483-367,87320-42,94118
Coffee265,0463362,34494-65,59683,25211
Sugar857,6218191,23976-221,2892630,05045
Wheat359,1861215,66760-8,38633-7,28167


Gold Comex Futures:

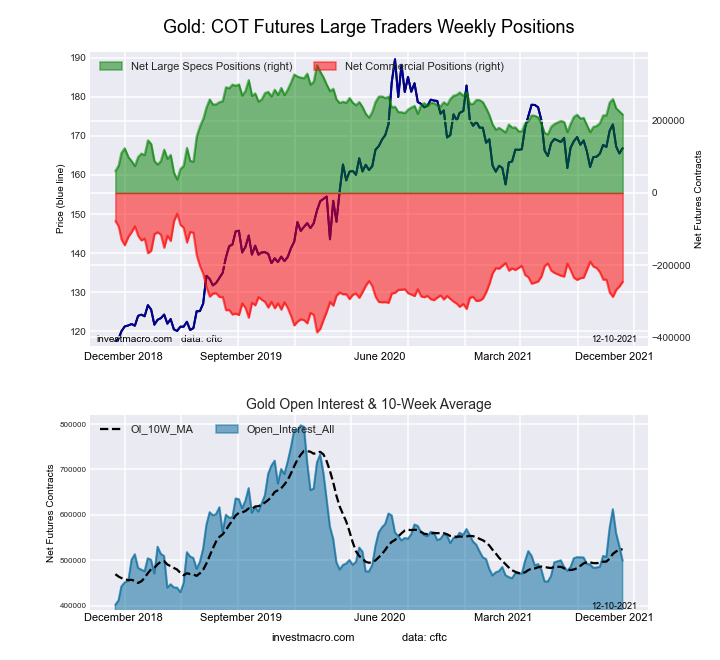
Federal Funds 30-Day Bonds Futures COT ChartThe Gold Comex Futures large speculator standing this week totaled a net position of 217,185 contracts in the data reported through Tuesday. This was a weekly lowering of -8,675 contracts from the previous week which had a total of 225,860 net contracts.

This week’s current strength score (the trader positioning range over the past three years, measured from 0 to 100) shows the speculators are currently Bullish with a score of 56.8 percent. The commercials are Bearish with a score of 42.7 percent and the small traders (not shown in chart) are Bearish with a score of 44.9 percent.

Gold Futures StatisticsSPECULATORSCOMMERCIALSSMALL TRADERS
– Percent of Open Interest Longs:60.220.89.5
– Percent of Open Interest Shorts:16.770.03.8
– Net Position:217,185-245,62328,438
– Gross Longs:300,518103,94247,358
– Gross Shorts:83,333349,56518,920
– Long to Short Ratio:3.6 to 10.3 to 12.5 to 1
NET POSITION TREND:
– Strength Index Score (3 Year Range Pct):56.842.744.9
– Strength Index Reading (3 Year Range):BullishBearishBearish
NET POSITION MOVEMENT INDEX:
– 6-Week Change in Strength Index:0.8-1.89.5


Silver Comex Futures:

2-Year Treasury Bonds Futures COT ChartThe Silver Comex Futures large speculator standing this week totaled a net position of 29,833 contracts in the data reported through Tuesday. This was a weekly reduction of -8,601 contracts from the previous week which had a total of 38,434 net contracts.

This week’s current strength score (the trader positioning range over the past three years, measured from 0 to 100) shows the speculators are currently Bullish with a score of 52.1 percent. The commercials are Bullish with a score of 56.6 percent and the small traders (not shown in chart) are Bearish-Extreme with a score of 17.5 percent.

Silver Futures StatisticsSPECULATORSCOMMERCIALSSMALL TRADERS
– Percent of Open Interest Longs:46.128.819.3
– Percent of Open Interest Shorts:24.260.49.5
– Net Position:29,833-43,14813,315
– Gross Longs:62,93039,36926,328
– Gross Shorts:33,09782,51713,013
– Long to Short Ratio:1.9 to 10.5 to 12.0 to 1
NET POSITION TREND:
– Strength Index Score (3 Year Range Pct):52.156.617.5
– Strength Index Reading (3 Year Range):BullishBullishBearish-Extreme
NET POSITION MOVEMENT INDEX:
– 6-Week Change in Strength Index:-7.78.2-4.0


Copper Grade #1 Futures:

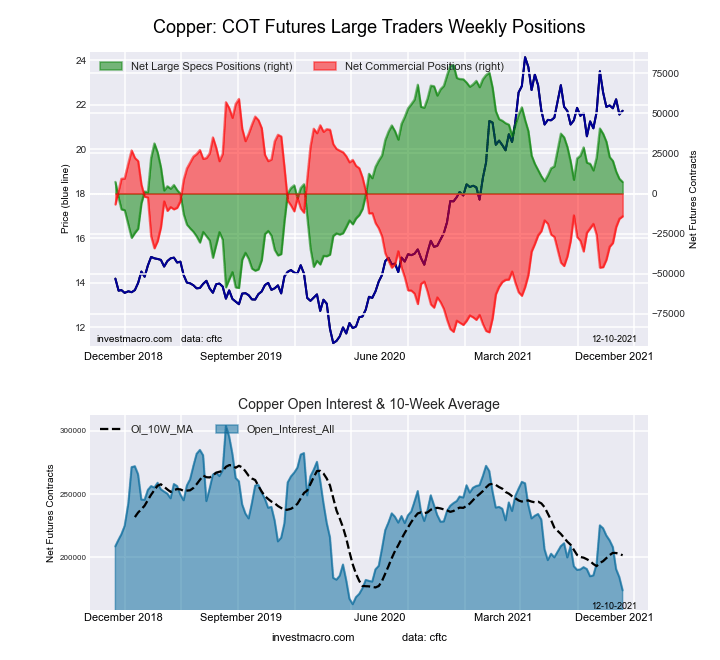
5-Year Treasury Bonds Futures COT ChartThe Copper Grade #1 Futures large speculator standing this week totaled a net position of 7,204 contracts in the data reported through Tuesday. This was a weekly fall of -1,987 contracts from the previous week which had a total of 9,191 net contracts.

This week’s current strength score (the trader positioning range over the past three years, measured from 0 to 100) shows the speculators are currently Bearish with a score of 47.6 percent. The commercials are Bearish with a score of 49.7 percent and the small traders (not shown in chart) are Bullish with a score of 65.9 percent.

Copper Futures StatisticsSPECULATORSCOMMERCIALSSMALL TRADERS
– Percent of Open Interest Longs:36.443.99.7
– Percent of Open Interest Shorts:32.352.15.6
– Net Position:7,204-14,2197,015
– Gross Longs:63,40376,37016,787
– Gross Shorts:56,19990,5899,772
– Long to Short Ratio:1.1 to 10.8 to 11.7 to 1
NET POSITION TREND:
– Strength Index Score (3 Year Range Pct):47.649.765.9
– Strength Index Reading (3 Year Range):BearishBearishBullish
NET POSITION MOVEMENT INDEX:
– 6-Week Change in Strength Index:-21.721.8-9.1


Platinum Futures:

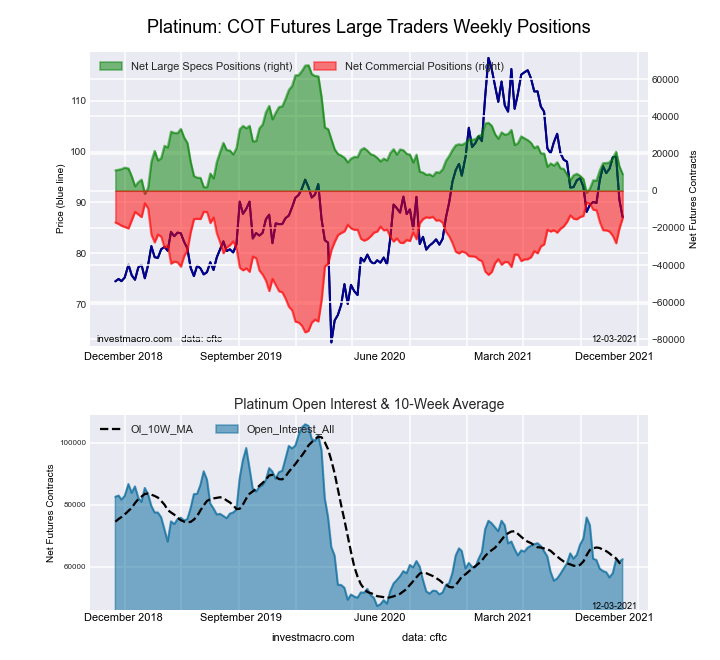
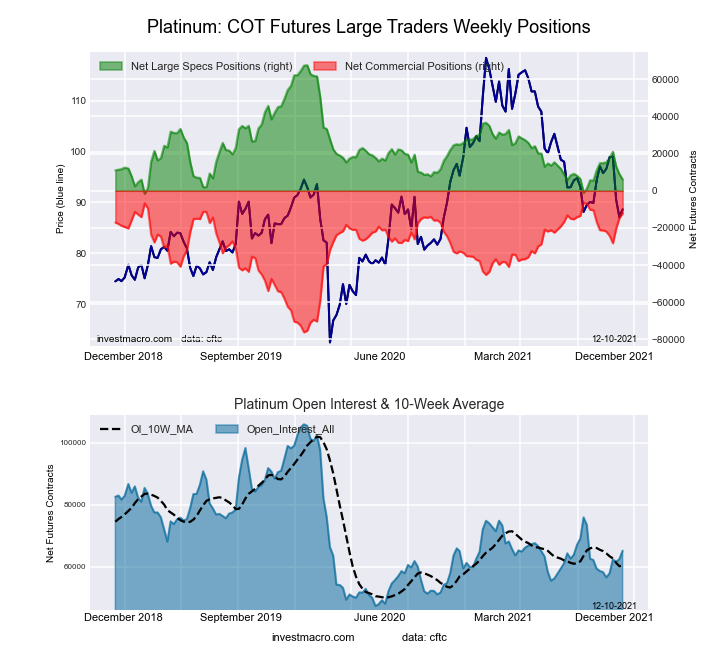
10-Year Treasury Notes Bonds Futures COT ChartThe Platinum Futures large speculator standing this week totaled a net position of 6,062 contracts in the data reported through Tuesday. This was a weekly lowering of -2,886 contracts from the previous week which had a total of 8,948 net contracts.

This week’s current strength score (the trader positioning range over the past three years, measured from 0 to 100) shows the speculators are currently Bearish-Extreme with a score of 11.1 percent. The commercials are Bullish-Extreme with a score of 91.7 percent and the small traders (not shown in chart) are Bearish with a score of 46.8 percent.

Platinum Futures StatisticsSPECULATORSCOMMERCIALSSMALL TRADERS
– Percent of Open Interest Longs:41.538.014.7
– Percent of Open Interest Shorts:32.256.75.4
– Net Position:6,062-12,1386,076
– Gross Longs:27,05624,7809,598
– Gross Shorts:20,99436,9183,522
– Long to Short Ratio:1.3 to 10.7 to 12.7 to 1
NET POSITION TREND:
– Strength Index Score (3 Year Range Pct):11.191.746.8
– Strength Index Reading (3 Year Range):Bearish-ExtremeBullish-ExtremeBearish
NET POSITION MOVEMENT INDEX:
– 6-Week Change in Strength Index:-12.813.1-4.2


Palladium Futures:

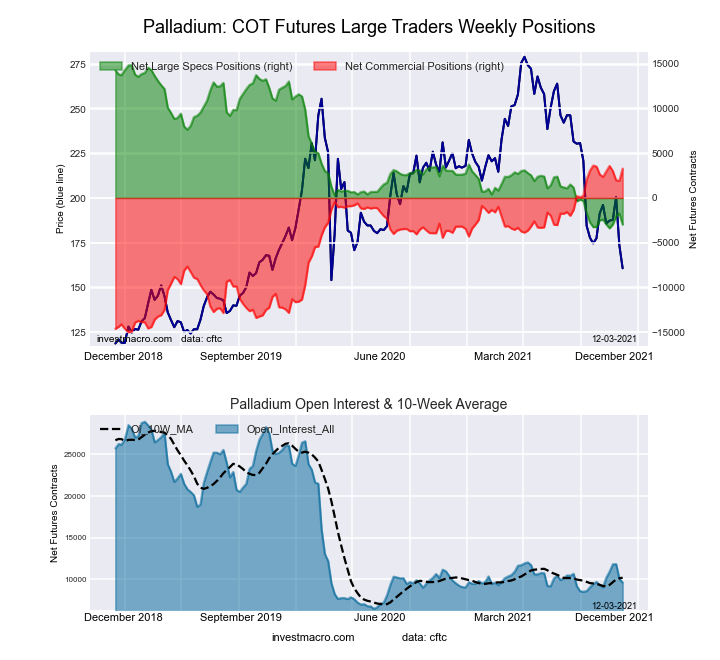
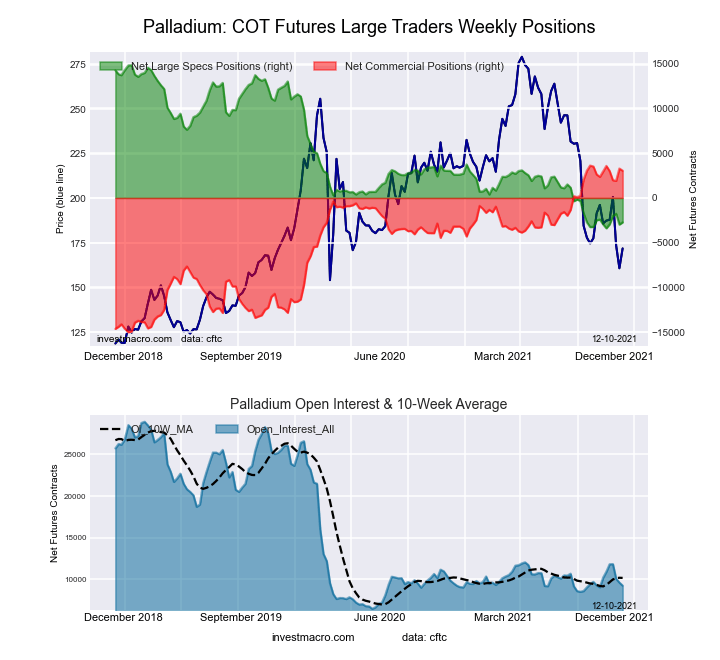
Ultra 10-Year Treasury Notes Bonds Futures COT ChartThe Palladium Futures large speculator standing this week totaled a net position of -2,731 contracts in the data reported through Tuesday. This was a weekly boost of 242 contracts from the previous week which had a total of -2,973 net contracts.

This week’s current strength score (the trader positioning range over the past three years, measured from 0 to 100) shows the speculators are currently Bearish-Extreme with a score of 3.6 percent. The commercials are Bullish-Extreme with a score of 96.9 percent and the small traders (not shown in chart) are Bearish with a score of 26.7 percent.

Palladium Futures StatisticsSPECULATORSCOMMERCIALSSMALL TRADERS
– Percent of Open Interest Longs:30.954.312.7
– Percent of Open Interest Shorts:60.421.516.0
– Net Position:-2,7313,036-305
– Gross Longs:2,8625,0241,175
– Gross Shorts:5,5931,9881,480
– Long to Short Ratio:0.5 to 12.5 to 10.8 to 1
NET POSITION TREND:
– Strength Index Score (3 Year Range Pct):3.696.926.7
– Strength Index Reading (3 Year Range):Bearish-ExtremeBullish-ExtremeBearish
NET POSITION MOVEMENT INDEX:
– 6-Week Change in Strength Index:1.20.4-17.5


Article By InvestMacroReceive our weekly COT Reports by Email

*COT Report: The COT data, released weekly to the public each Friday, is updated through the most recent Tuesday (data is 3 days old) and shows a quick view of how large speculators or non-commercials (for-profit traders) were positioned in the futures markets.

The CFTC categorizes trader positions according to commercial hedgers (traders who use futures contracts for hedging as part of the business), non-commercials (large traders who speculate to realize trading profits) and nonreportable traders (usually small traders/speculators) as well as their open interest (contracts open in the market at time of reporting).See CFTC criteria here.
COT Energy Speculators cut back on WTI Crude Oil bullish bets for 4th straight week

By InvestMacro | COT | Data Tables | COT Leaders | Downloads | COT Newsletter

Here are the latest charts and statistics for the Commitment of Traders (COT) data published by the Commodities Futures Trading Commission (CFTC).

The latest COT data is updated through Tuesday December 7th 2021 and shows a quick view of how large traders (for-profit speculators and commercial entities) were positioned in the futures markets.

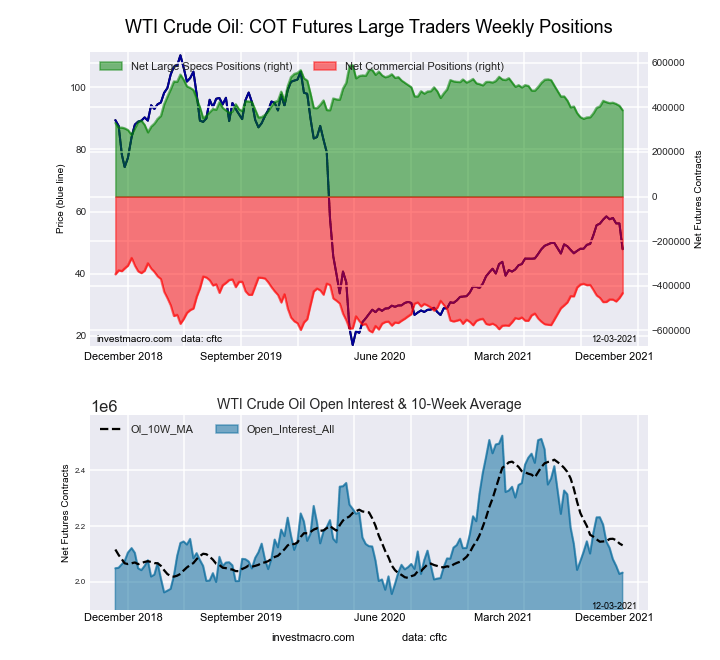
Highlighting this week’s COT energy data is the recent decline in the WTI Crude Oil futures bets. The speculative net position in the WTI Crude Oil futures has now fallen for four consecutive weeks and in six out of the past seven weeks. The spec crude position has dropped by a total of -62,362 contracts over these past seven weeks and speculators have now pushed their current net positioning to the lowest level since September 21st, a span of eleven weeks.

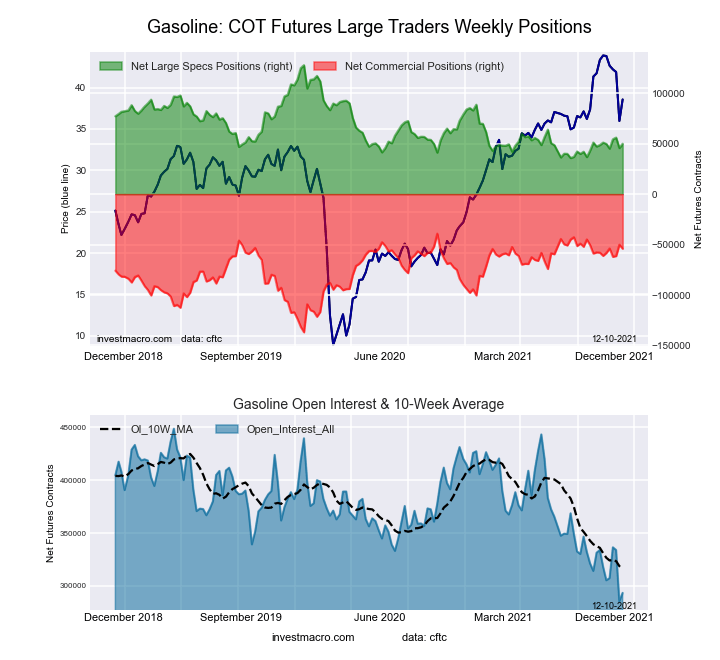
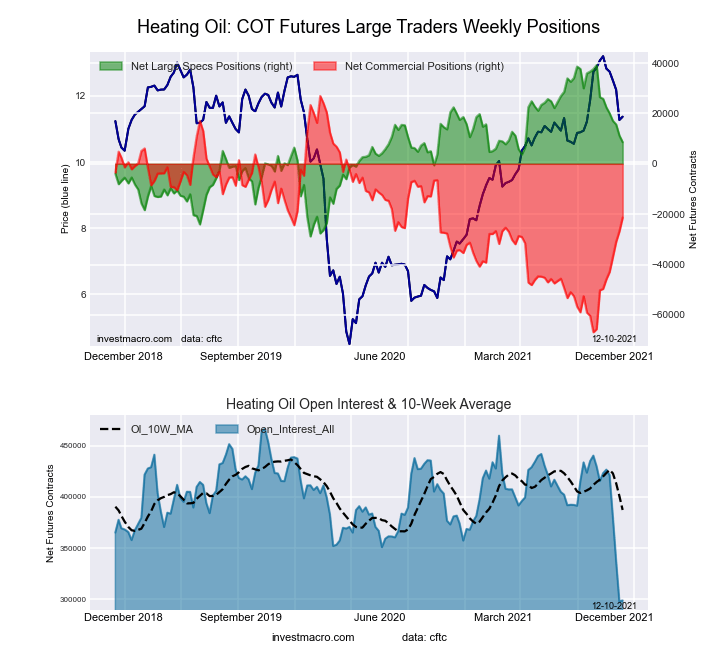
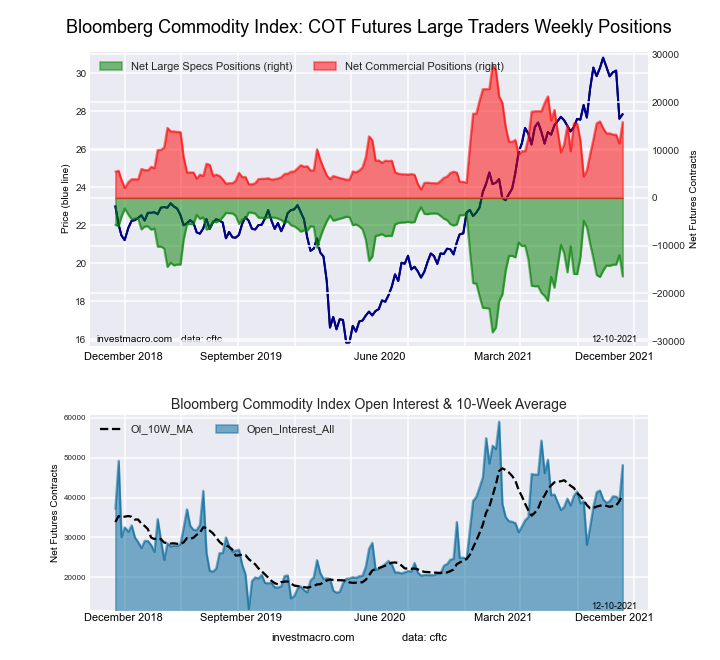
Joining WTI Crude Oil (-20,002 contracts) with decreasing bets this week are Brent Crude Oil (-4,952 contracts), Heating Oil (-2,628 contracts) and the Bloomberg Commodity Index (-4,473 contracts). The energy markets with gaining positions this week were Natural Gas (235 contracts) and Gasoline (4,269 contracts).


Data Snapshot of Commodity Market Traders | Columns Legend
Dec-07-2021OIOI-IndexSpec-NetSpec-IndexCom-NetCOM-IndexSmalls-NetSmalls-Index
WTI Crude1,972,5363367,23229-400,4316233,19962
Gold499,30723217,18557-245,6234328,43845
Silver136,572429,83352-43,1485713,31517
Copper173,95487,20448-14,219507,01566
Palladium9,25312-2,73143,03697-30527
Platinum65,134306,06211-12,138926,07647
Natural Gas1,205,62620-132,4433999,3726233,07163
Brent211,25448-20,4468417,107173,33955
Heating Oil298,99708,59755-21,3514912,75443
Soybeans672,1161559,65445-22,74460-36,91010
Corn1,430,4019410,81483-367,87320-42,94118
Coffee265,0463362,34494-65,59683,25211
Sugar857,6218191,23976-221,2892630,05045
Wheat359,1861215,66760-8,38633-7,28167


WTI Crude Oil Futures:

WTI Crude Oil Futures COT ChartThe WTI Crude Oil Futures large speculator standing this week was a net position of 367,232 contracts in the data reported through Tuesday. This was a weekly decrease of -20,002 contracts from the previous week which had a total of 387,234 net contracts.

This week’s current strength score (the trader positioning range over the past three years, measured from 0 to 100) shows the speculators are currently Bearish with a score of 28.8 percent. The commercials are Bullish with a score of 62.4 percent and the small traders (not shown in chart) are Bullish with a score of 61.8 percent.

WTI Crude Oil Futures StatisticsSPECULATORSCOMMERCIALSSMALL TRADERS
– Percent of Open Interest Longs:25.036.74.2
– Percent of Open Interest Shorts:6.457.02.5
– Net Position:367,232-400,43133,199
– Gross Longs:492,585724,62682,580
– Gross Shorts:125,3531,125,05749,381
– Long to Short Ratio:3.9 to 10.6 to 11.7 to 1
NET POSITION TREND:
– Strength Index Score (3 Year Range Pct):28.862.461.8
– Strength Index Reading (3 Year Range):BearishBullishBullish
NET POSITION MOVEMENT INDEX:
– 6-Week Change in Strength Index:-18.121.6-21.9


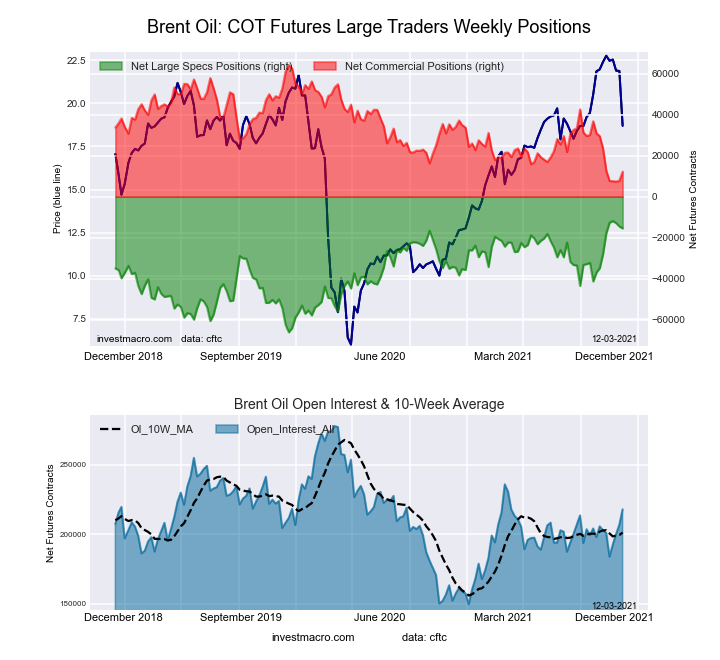
Brent Crude Oil Futures:

Brent Last Day Crude Oil Futures COT ChartThe Brent Crude Oil Futures large speculator standing this week was a net position of -20,446 contracts in the data reported through Tuesday. This was a weekly reduction of -4,952 contracts from the previous week which had a total of -15,494 net contracts.

This week’s current strength score (the trader positioning range over the past three years, measured from 0 to 100) shows the speculators are currently Bullish-Extreme with a score of 84.2 percent. The commercials are Bearish-Extreme with a score of 17.1 percent and the small traders (not shown in chart) are Bullish with a score of 54.5 percent.

Brent Crude Oil Futures StatisticsSPECULATORSCOMMERCIALSSMALL TRADERS
– Percent of Open Interest Longs:21.644.23.6
– Percent of Open Interest Shorts:31.336.12.0
– Net Position:-20,44617,1073,339
– Gross Longs:45,57393,3487,669
– Gross Shorts:66,01976,2414,330
– Long to Short Ratio:0.7 to 11.2 to 11.8 to 1
NET POSITION TREND:
– Strength Index Score (3 Year Range Pct):84.217.154.5
– Strength Index Reading (3 Year Range):Bullish-ExtremeBearish-ExtremeBullish
NET POSITION MOVEMENT INDEX:
– 6-Week Change in Strength Index:-4.87.8-24.6


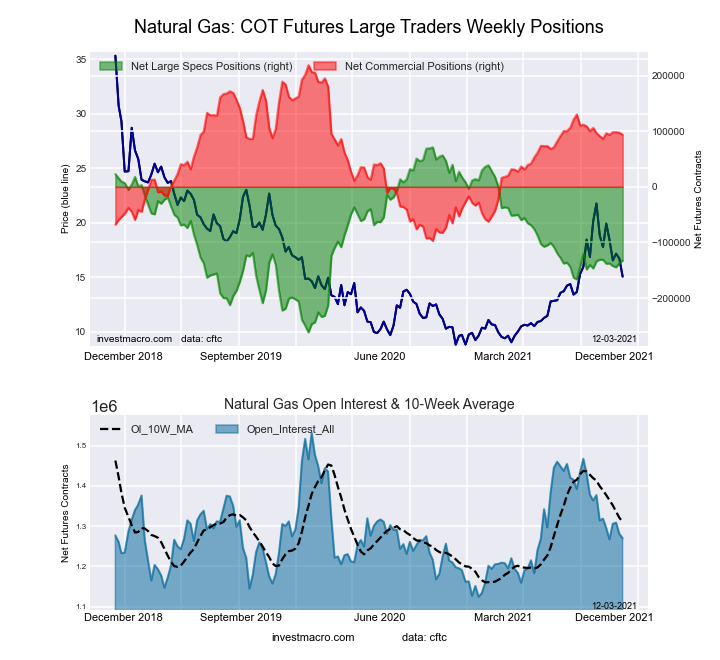
Natural Gas Futures:

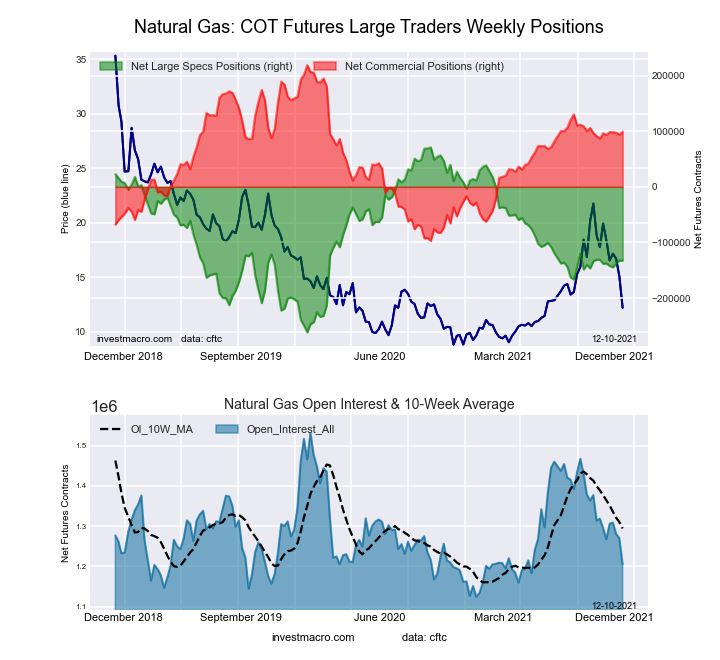
Natural Gas Futures COT ChartThe Natural Gas Futures large speculator standing this week was a net position of -132,443 contracts in the data reported through Tuesday. This was a weekly lift of 235 contracts from the previous week which had a total of -132,678 net contracts.

This week’s current strength score (the trader positioning range over the past three years, measured from 0 to 100) shows the speculators are currently Bearish with a score of 38.8 percent. The commercials are Bullish with a score of 62.2 percent and the small traders (not shown in chart) are Bullish with a score of 62.7 percent.

Natural Gas Futures StatisticsSPECULATORSCOMMERCIALSSMALL TRADERS
– Percent of Open Interest Longs:19.343.54.6
– Percent of Open Interest Shorts:30.335.21.9
– Net Position:-132,44399,37233,071
– Gross Longs:233,007524,22955,682
– Gross Shorts:365,450424,85722,611
– Long to Short Ratio:0.6 to 11.2 to 12.5 to 1
NET POSITION TREND:
– Strength Index Score (3 Year Range Pct):38.862.262.7
– Strength Index Reading (3 Year Range):BearishBullishBullish
NET POSITION MOVEMENT INDEX:
– 6-Week Change in Strength Index:1.71.0-22.1


Gasoline Blendstock Futures:

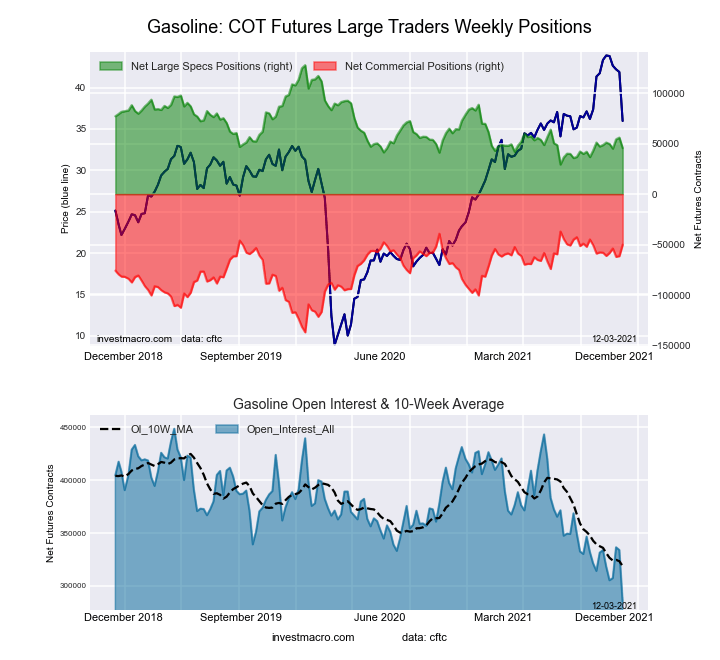
RBOB Gasoline Energy Futures COT ChartThe Gasoline Blendstock Futures large speculator standing this week was a net position of 49,883 contracts in the data reported through Tuesday. This was a weekly increase of 4,269 contracts from the previous week which had a total of 45,614 net contracts.

This week’s current strength score (the trader positioning range over the past three years, measured from 0 to 100) shows the speculators are currently Bearish with a score of 20.9 percent. The commercials are Bullish-Extreme with a score of 82.9 percent and the small traders (not shown in chart) are Bearish with a score of 36.7 percent.

Nasdaq Mini Futures StatisticsSPECULATORSCOMMERCIALSSMALL TRADERS
– Percent of Open Interest Longs:30.448.55.7
– Percent of Open Interest Shorts:13.466.94.3
– Net Position:49,883-54,0934,210
– Gross Longs:89,156142,16916,850
– Gross Shorts:39,273196,26212,640
– Long to Short Ratio:2.3 to 10.7 to 11.3 to 1
NET POSITION TREND:
– Strength Index Score (3 Year Range Pct):20.982.936.7
– Strength Index Reading (3 Year Range):BearishBullish-ExtremeBearish
NET POSITION MOVEMENT INDEX:
– 6-Week Change in Strength Index:-1.27.1-35.4


#2 Heating Oil NY-Harbor Futures:

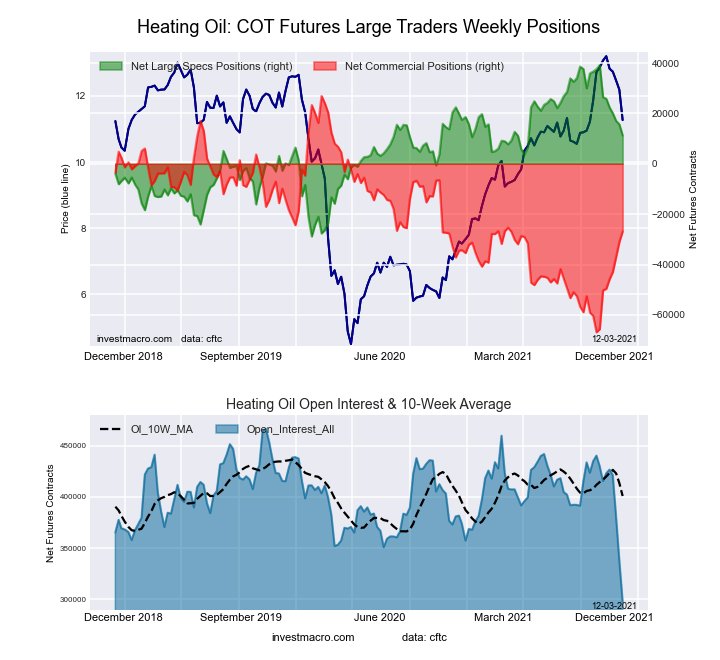
NY Harbor Heating Oil Energy Futures COT ChartThe #2 Heating Oil NY-Harbor Futures large speculator standing this week was a net position of 8,597 contracts in the data reported through Tuesday. This was a weekly decline of -2,628 contracts from the previous week which had a total of 11,225 net contracts.

This week’s current strength score (the trader positioning range over the past three years, measured from 0 to 100) shows the speculators are currently Bullish with a score of 55.1 percent. The commercials are Bearish with a score of 48.5 percent and the small traders (not shown in chart) are Bearish with a score of 42.5 percent.

Heating Oil Futures StatisticsSPECULATORSCOMMERCIALSSMALL TRADERS
– Percent of Open Interest Longs:13.353.412.9
– Percent of Open Interest Shorts:10.560.68.7
– Net Position:8,597-21,35112,754
– Gross Longs:39,877159,78338,689
– Gross Shorts:31,280181,13425,935
– Long to Short Ratio:1.3 to 10.9 to 11.5 to 1
NET POSITION TREND:
– Strength Index Score (3 Year Range Pct):55.148.542.5
– Strength Index Reading (3 Year Range):BullishBearishBearish
NET POSITION MOVEMENT INDEX:
– 6-Week Change in Strength Index:-25.330.2-38.4


Bloomberg Commodity Index Futures:

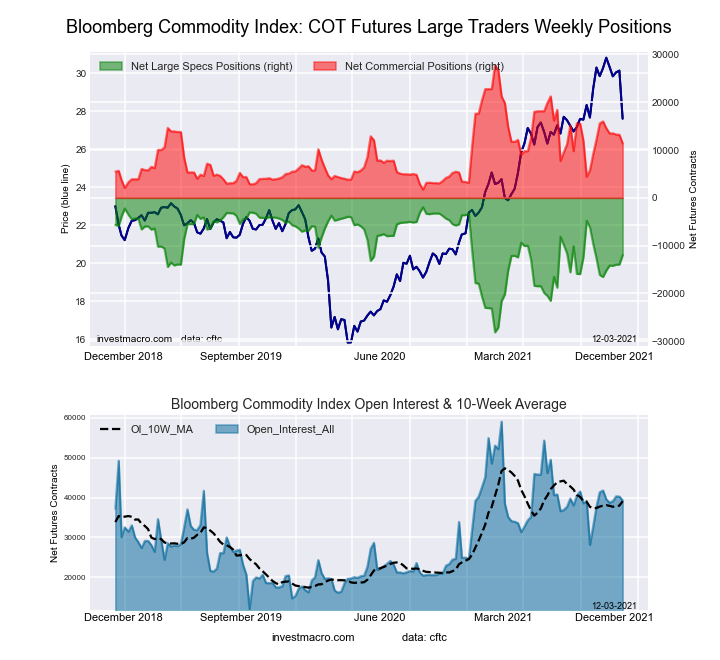
Bloomberg Commodity Index Futures COT ChartThe Bloomberg Commodity Index Futures large speculator standing this week was a net position of -16,421 contracts in the data reported through Tuesday. This was a weekly fall of -4,473 contracts from the previous week which had a total of -11,948 net contracts.

This week’s current strength score (the trader positioning range over the past three years, measured from 0 to 100) shows the speculators are currently Bearish with a score of 44.7 percent. The commercials are Bullish with a score of 54.3 percent and the small traders (not shown in chart) are Bearish with a score of 48.7 percent.

Bloomberg Index Futures StatisticsSPECULATORSCOMMERCIALSSMALL TRADERS
– Percent of Open Interest Longs:59.037.11.2
– Percent of Open Interest Shorts:93.04.20.1
– Net Position:-16,42115,865556
– Gross Longs:28,42117,881597
– Gross Shorts:44,8422,01641
– Long to Short Ratio:0.6 to 18.9 to 114.6 to 1
NET POSITION TREND:
– Strength Index Score (3 Year Range Pct):44.754.348.7
– Strength Index Reading (3 Year Range):BearishBullishBearish
NET POSITION MOVEMENT INDEX:
– 6-Week Change in Strength Index:-4.85.0-2.6


Article By InvestMacroReceive our weekly COT Reports by Email

*COT Report: The COT data, released weekly to the public each Friday, is updated through the most recent Tuesday (data is 3 days old) and shows a quick view of how large speculators or non-commercials (for-profit traders) were positioned in the futures markets.

The CFTC categorizes trader positions according to commercial hedgers (traders who use futures contracts for hedging as part of the business), non-commercials (large traders who speculate to realize trading profits) and nonreportable traders (usually small traders/speculators) as well as their open interest (contracts open in the market at time of reporting).See CFTC criteria here.
COT Stock Market Speculators dropped their VIX bearish bets to 80-week low

By InvestMacro | COT | Data Tables | COT Leaders | Downloads | COT Newsletter

Here are the latest charts and statistics for the Commitment of Traders (COT) data published by the Commodities Futures Trading Commission (CFTC).

The latest COT data is updated through Tuesday December 7th 2021 and shows a quick view of how large traders (for-profit speculators and commercial entities) were positioned in the futures markets.

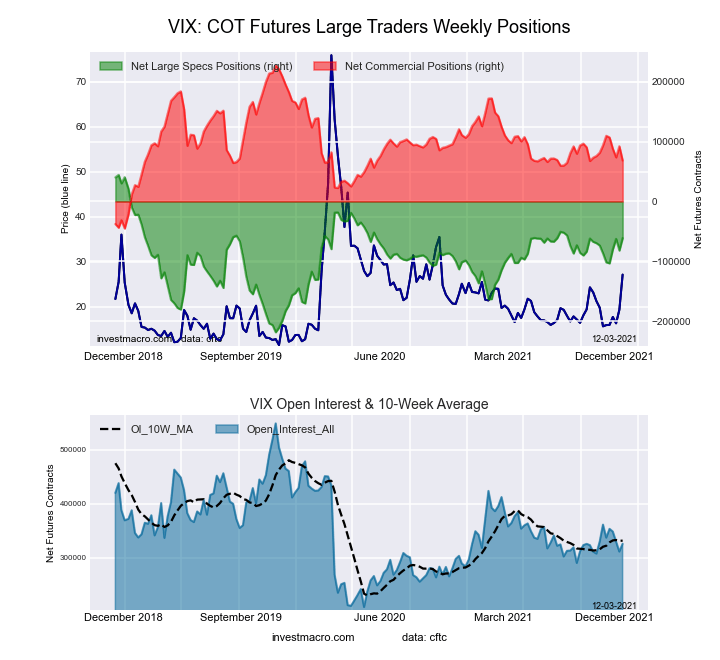
Highlighting this week’s COT stock market data is the continued cool off in the VIX Volatility futures bearish bets. The speculative net position in the VIX futures saw bearish bets fall by 13,751 contracts this week following a 20,782 contract improvement in positions last week.

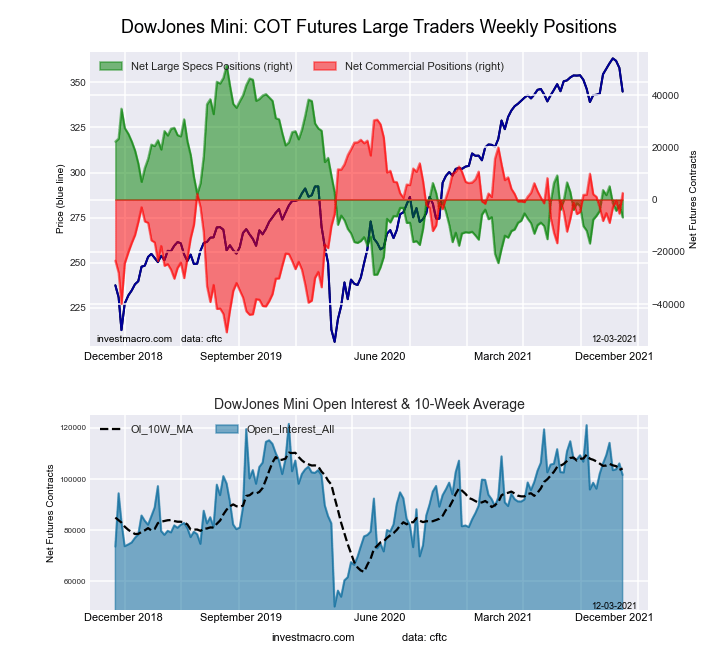
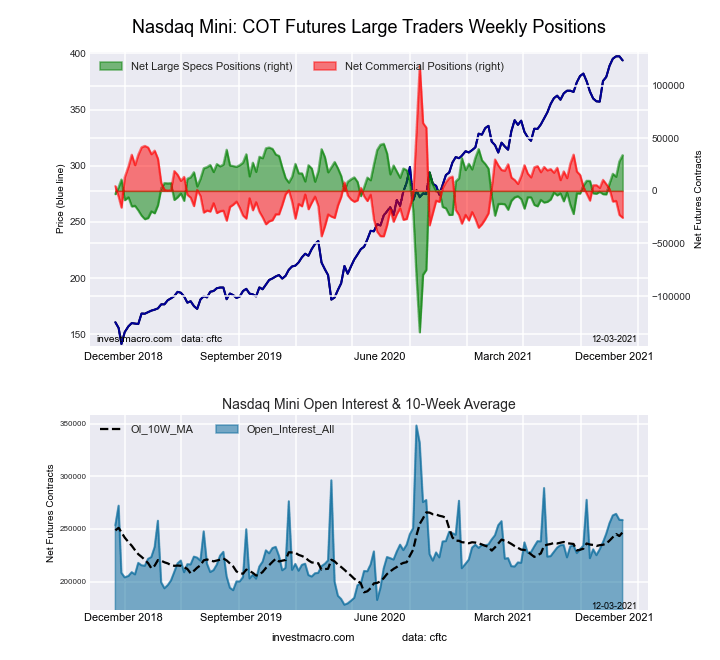
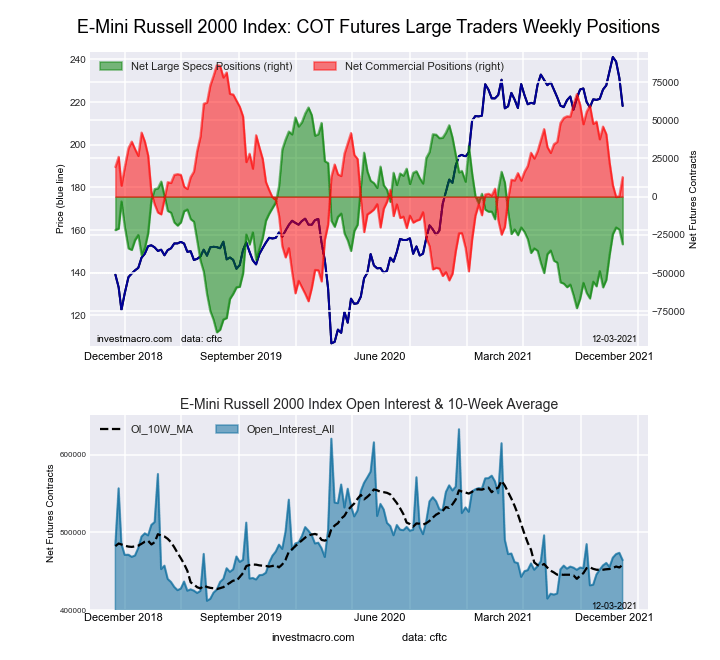
The stock markets that saw higher speculator bets this week were VIX (13,751 contracts), Dow Jones Industrial Average Mini (2,283 contracts) and the Russell 2000 Mini (4,140 contracts).

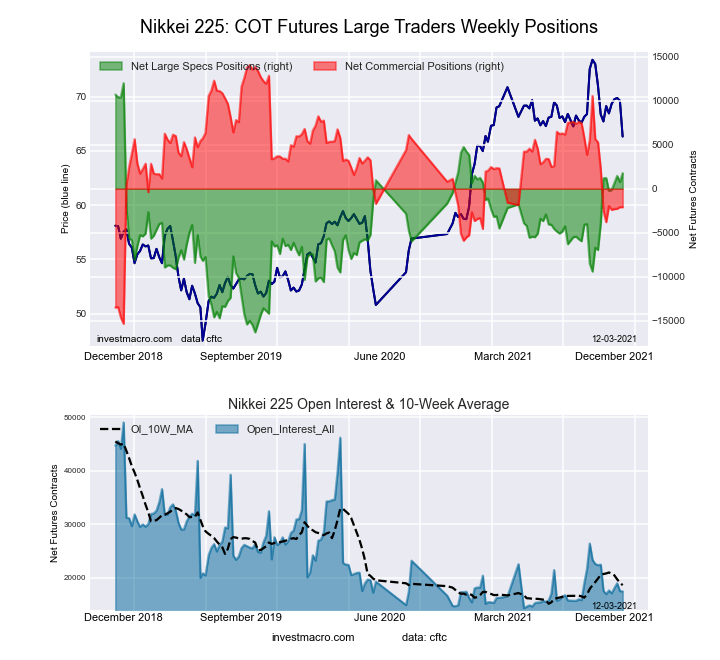
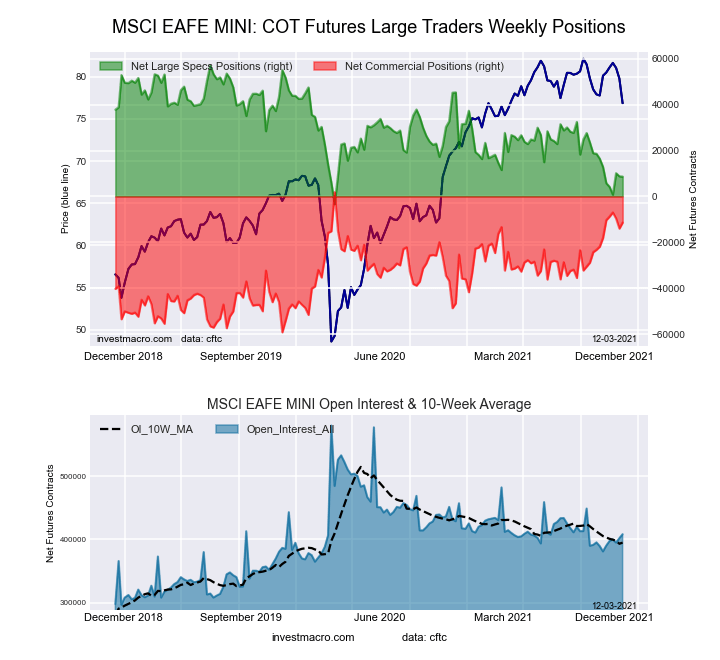
The markets with lower speculator bets this week were S&P500 Mini (-14,329 contracts), Nasdaq Mini (-8,155 contracts), Nikkei 225 USD (-557 contracts), MSCI EAFE Min (-2,227 contracts), MSCI Emerging Markets Mini (-2,219 contracts).


Data Snapshot of Stock Market Traders | Columns Legend
Dec-07-2021OIOI-IndexSpec-NetSpec-IndexCom-NetCOM-IndexSmalls-NetSmalls-Index
S&P500-Mini2,514,3836165,39691-182,9263317,53030
Nikkei 22525,848331,21162-3,259412,04853
Nasdaq-Mini251,8804325,77889-24,88511-89342
DowJones-Mini103,05974-4,553303,180661,37346
VIX300,08227-47,4036555,69937-8,29625
Nikkei 225 Yen61,96846-2,4321625,71994-23,28734


VIX Volatility Futures:

Federal Funds 30-Day Bonds Futures COT ChartThe VIX Volatility large speculator standing this week equaled a net position of -47,403 contracts in the data reported through Tuesday. This was a weekly gain of 13,751 contracts from the previous week which had a total of -61,154 net contracts.

This week’s current strength score (the trader positioning range over the past three years, measured from 0 to 100) shows the speculators are currently Bullish with a score of 65.1 percent. The commercials are Bearish with a score of 37.0 percent and the small traders (not shown in chart) are Bearish with a score of 24.9 percent.

VIX Volatility Futures StatisticsSPECULATORSCOMMERCIALSSMALL TRADERS
– Percent of Open Interest Longs:24.346.66.5
– Percent of Open Interest Shorts:40.128.19.3
– Net Position:-47,40355,699-8,296
– Gross Longs:72,815139,91119,632
– Gross Shorts:120,21884,21227,928
– Long to Short Ratio:0.6 to 11.7 to 10.7 to 1
NET POSITION TREND:
– Strength Index Score (3 Year Range Pct):65.137.024.9
– Strength Index Reading (3 Year Range):BullishBearishBearish
NET POSITION MOVEMENT INDEX:
– 6-Week Change in Strength Index:20.6-19.7-1.4


S&P500 Mini Futures:

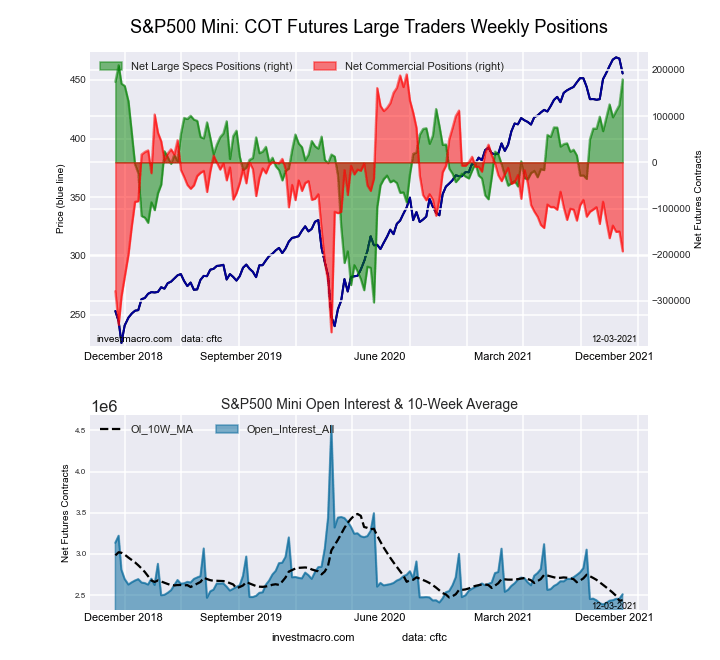
2-Year Treasury Bonds Futures COT ChartThe S&P500 Mini large speculator standing this week equaled a net position of 165,396 contracts in the data reported through Tuesday. This was a weekly reduction of -14,329 contracts from the previous week which had a total of 179,725 net contracts.

This week’s current strength score (the trader positioning range over the past three years, measured from 0 to 100) shows the speculators are currently Bullish-Extreme with a score of 91.3 percent. The commercials are Bearish with a score of 33.1 percent and the small traders (not shown in chart) are Bearish with a score of 30.0 percent.

S&P500 Mini Futures StatisticsSPECULATORSCOMMERCIALSSMALL TRADERS
– Percent of Open Interest Longs:17.469.010.5
– Percent of Open Interest Shorts:10.876.39.8
– Net Position:165,396-182,92617,530
– Gross Longs:437,9391,734,746263,698
– Gross Shorts:272,5431,917,672246,168
– Long to Short Ratio:1.6 to 10.9 to 11.1 to 1
NET POSITION TREND:
– Strength Index Score (3 Year Range Pct):91.333.130.0
– Strength Index Reading (3 Year Range):Bullish-ExtremeBearishBearish
NET POSITION MOVEMENT INDEX:
– 6-Week Change in Strength Index:13.4-10.1-2.6


Dow Jones Mini Futures:

5-Year Treasury Bonds Futures COT ChartThe Dow Jones Mini large speculator standing this week equaled a net position of -4,553 contracts in the data reported through Tuesday. This was a weekly rise of 2,283 contracts from the previous week which had a total of -6,836 net contracts.

This week’s current strength score (the trader positioning range over the past three years, measured from 0 to 100) shows the speculators are currently Bearish with a score of 30.2 percent. The commercials are Bullish with a score of 66.3 percent and the small traders (not shown in chart) are Bearish with a score of 45.8 percent.

Dow Jones Mini Futures StatisticsSPECULATORSCOMMERCIALSSMALL TRADERS
– Percent of Open Interest Longs:36.647.215.8
– Percent of Open Interest Shorts:41.044.114.5
– Net Position:-4,5533,1801,373
– Gross Longs:37,72848,61216,285
– Gross Shorts:42,28145,43214,912
– Long to Short Ratio:0.9 to 11.1 to 11.1 to 1
NET POSITION TREND:
– Strength Index Score (3 Year Range Pct):30.266.345.8
– Strength Index Reading (3 Year Range):BearishBullishBearish
NET POSITION MOVEMENT INDEX:
– 6-Week Change in Strength Index:-7.810.3-11.1


Nasdaq Mini Futures:

10-Year Treasury Notes Bonds Futures COT ChartThe Nasdaq Mini large speculator standing this week equaled a net position of 25,778 contracts in the data reported through Tuesday. This was a weekly fall of -8,155 contracts from the previous week which had a total of 33,933 net contracts.

This week’s current strength score (the trader positioning range over the past three years, measured from 0 to 100) shows the speculators are currently Bullish-Extreme with a score of 89.4 percent. The commercials are Bearish-Extreme with a score of 11.2 percent and the small traders (not shown in chart) are Bearish with a score of 42.0 percent.

Nasdaq Mini Futures StatisticsSPECULATORSCOMMERCIALSSMALL TRADERS
– Percent of Open Interest Longs:32.049.416.1
– Percent of Open Interest Shorts:21.859.316.4
– Net Position:25,778-24,885-893
– Gross Longs:80,716124,38640,430
– Gross Shorts:54,938149,27141,323
– Long to Short Ratio:1.5 to 10.8 to 11.0 to 1
NET POSITION TREND:
– Strength Index Score (3 Year Range Pct):89.411.242.0
– Strength Index Reading (3 Year Range):Bullish-ExtremeBearish-ExtremeBearish
NET POSITION MOVEMENT INDEX:
– 6-Week Change in Strength Index:16.2-19.35.1


Russell 2000 Mini Futures:

Ultra 10-Year Treasury Notes Bonds Futures COT ChartThe Russell 2000 Mini large speculator standing this week equaled a net position of -27,001 contracts in the data reported through Tuesday. This was a weekly advance of 4,140 contracts from the previous week which had a total of -31,141 net contracts.

This week’s current strength score (the trader positioning range over the past three years, measured from 0 to 100) shows the speculators are currently Bearish with a score of 42.0 percent. The commercials are Bullish with a score of 52.5 percent and the small traders (not shown in chart) are Bullish with a score of 73.4 percent.

Russell 2000 Mini Futures StatisticsSPECULATORSCOMMERCIALSSMALL TRADERS
– Percent of Open Interest Longs:12.977.97.5
– Percent of Open Interest Shorts:18.875.24.4
– Net Position:-27,00112,68314,318
– Gross Longs:59,732359,57134,544
– Gross Shorts:86,733346,88820,226
– Long to Short Ratio:0.7 to 11.0 to 11.7 to 1
NET POSITION TREND:
– Strength Index Score (3 Year Range Pct):42.052.573.4
– Strength Index Reading (3 Year Range):BearishBullishBullish
NET POSITION MOVEMENT INDEX:
– 6-Week Change in Strength Index:18.7-18.32.2


Nikkei Stock Average (USD) Futures:

US Year Treasury Notes Long Bonds Futures COT ChartThe Nikkei Stock Average (USD) large speculator standing this week equaled a net position of 1,211 contracts in the data reported through Tuesday. This was a weekly decrease of -557 contracts from the previous week which had a total of 1,768 net contracts.

This week’s current strength score (the trader positioning range over the past three years, measured from 0 to 100) shows the speculators are currently Bullish with a score of 61.9 percent. The commercials are Bearish with a score of 41.1 percent and the small traders (not shown in chart) are Bullish with a score of 53.1 percent.

Nikkei Stock Average Futures StatisticsSPECULATORSCOMMERCIALSSMALL TRADERS
– Percent of Open Interest Longs:15.337.923.2
– Percent of Open Interest Shorts:10.650.515.2
– Net Position:1,211-3,2592,048
– Gross Longs:3,9599,7915,984
– Gross Shorts:2,74813,0503,936
– Long to Short Ratio:1.4 to 10.8 to 11.5 to 1
NET POSITION TREND:
– Strength Index Score (3 Year Range Pct):61.941.153.1
– Strength Index Reading (3 Year Range):BullishBearishBullish
NET POSITION MOVEMENT INDEX:
– 6-Week Change in Strength Index:5.2-4.4-2.2


MSCI EAFE Mini Futures:

Ultra US Year Treasury Notes Long Bonds Futures COT ChartThe MSCI EAFE Mini large speculator standing this week equaled a net position of 6,409 contracts in the data reported through Tuesday. This was a weekly lowering of -2,227 contracts from the previous week which had a total of 8,636 net contracts.

This week’s current strength score (the trader positioning range over the past three years, measured from 0 to 100) shows the speculators are currently Bearish-Extreme with a score of 16.2 percent. The commercials are Bullish with a score of 79.4 percent and the small traders (not shown in chart) are Bullish with a score of 54.9 percent.

MSCI EAFE Mini Futures StatisticsSPECULATORSCOMMERCIALSSMALL TRADERS
– Percent of Open Interest Longs:6.690.52.5
– Percent of Open Interest Shorts:5.093.21.4
– Net Position:6,409-10,7094,300
– Gross Longs:26,370362,58210,038
– Gross Shorts:19,961373,2915,738
– Long to Short Ratio:1.3 to 11.0 to 11.7 to 1
NET POSITION TREND:
– Strength Index Score (3 Year Range Pct):16.279.454.9
– Strength Index Reading (3 Year Range):Bearish-ExtremeBullishBullish
NET POSITION MOVEMENT INDEX:
– 6-Week Change in Strength Index:1.0-0.6-2.4


Article By InvestMacroReceive our weekly COT Reports by Email

*COT Report: The COT data, released weekly to the public each Friday, is updated through the most recent Tuesday (data is 3 days old) and shows a quick view of how large speculators or non-commercials (for-profit traders) were positioned in the futures markets.

The CFTC categorizes trader positions according to commercial hedgers (traders who use futures contracts for hedging as part of the business), non-commercials (large traders who speculate to realize trading profits) and nonreportable traders (usually small traders/speculators) as well as their open interest (contracts open in the market at time of reporting).See CFTC criteria here.
COT Currency Speculators boost Japanese Yen bets by most in 89 weeks in risk off trading

Here are the latest charts and statistics for the Commitment of Traders (COT) data published by the Commodities Futures Trading Commission (CFTC).

The latest COT data is updated through Tuesday November 30th 2021 and shows a quick view of how large traders (for-profit speculators and commercial entities) were positioned in the futures markets. All currency positions are in direct relation to the US dollar where, for example, a bet for the euro is a bet that the euro will rise versus the dollar while a bet against the euro will be a bet that the euro will decline versus the dollar.

Highlighting this week’s COT currency data is the Japanese yen speculator bets that rebounded in a risk-off environment. This week’s improvement (or reduction of bearish positioning) in yen positions marked the best one-week gain since March 17th of 2020, a span of eighty-nine weeks. Yen speculator positioning has been very negative since contracts fell onto the bearish side in March of 2021. The bearish sentiment hit a short-term high point just five weeks ago on November 2nd when net positions dropped to a total of -107,624 net contracts. Since that week, bearish bets have improved by a total of +28,758 contracts to level at this week’s -78,866 current contract standing.

Overall, this week’s risk-off tone helped the yen positions while taking a bite out of the bets for the usual risk-on currencies. The Australian dollar bets fell by -16,920 contracts, the Canadian dollar dropped by -10,940 contracts and the New Zealand dollar slipped by -3,309 contracts as well this week. Currently, only the US Dollar Index, the Russian Ruble and the New Zealand dollar have net positive speculator positioning.


Data Snapshot of Forex Market Traders | Columns Legend
Nov-30-2021OIOI-IndexSpec-NetSpec-IndexCom-NetCOM-IndexSmalls-NetSmalls-Index
USD Index52,1727235,87988-40,44274,56366
EUR705,40985-23,24028-10,8717334,11131
GBP230,42358-38,8994653,77261-14,87325
JPY216,69266-78,8661892,03382-13,16721
CHF50,54329-14,1824521,17555-6,99343
CAD148,37529-14,075439,851584,22453
AUD201,98184-80,185994,70990-14,52417
NZD49,4834310,63089-9,30316-1,32737
MXN195,71946-59,747061,120100-1,37337
RUB49,8705313,63746-15,633501,99689
BRL41,10146-13,8425015,06553-1,22352
Bitcoin13,19775-1,69164697099436


US Dollar Index Futures:

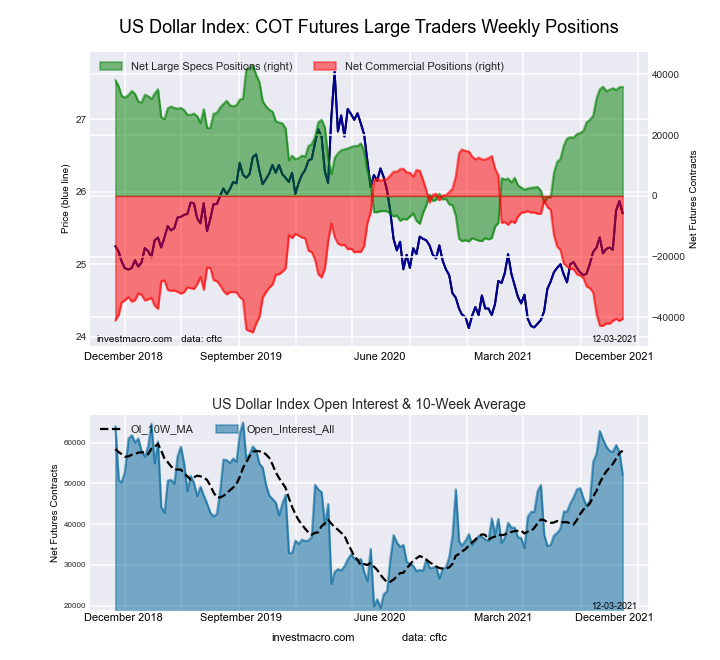
Federal Funds 30-Day Bonds Futures COT ChartThe US Dollar Index large speculator standing this week reached a net position of 35,879 contracts in the data reported through Tuesday. This was a weekly rise of 104 contracts from the previous week which had a total of 35,775 net contracts.

This week’s current strength score (the trader positioning range over the past three years, measured from 0 to 100) shows the speculators are currently Bullish-Extreme with a score of 87.7 percent. The commercials are Bearish-Extreme with a score of 7.4 percent and the small traders (not shown in chart) are Bullish with a score of 66.4 percent.

US DOLLAR INDEX StatisticsSPECULATORSCOMMERCIALSSMALL TRADERS
– Percent of Open Interest Longs:80.53.112.6
– Percent of Open Interest Shorts:11.880.63.9
– Net Position:35,879-40,4424,563
– Gross Longs:42,0101,6346,581
– Gross Shorts:6,13142,0762,018
– Long to Short Ratio:6.9 to 10.0 to 13.3 to 1
NET POSITION TREND:
– COT Index Score (3 Year Range Pct):87.77.466.4
– COT Index Reading (3 Year Range):Bullish-ExtremeBearish-ExtremeBullish
NET POSITION MOVEMENT INDEX:
– 6-Week Change in Strength Index:-0.13.8-24.4


Euro Currency Futures:

2-Year Treasury Bonds Futures COT ChartThe Euro Currency large speculator standing this week reached a net position of -23,240 contracts in the data reported through Tuesday. This was a weekly reduction of -6,788 contracts from the previous week which had a total of -16,452 net contracts.

This week’s current strength score (the trader positioning range over the past three years, measured from 0 to 100) shows the speculators are currently Bearish with a score of 27.9 percent. The commercials are Bullish with a score of 72.6 percent and the small traders (not shown in chart) are Bearish with a score of 30.9 percent.

EURO Currency StatisticsSPECULATORSCOMMERCIALSSMALL TRADERS
– Percent of Open Interest Longs:27.157.813.1
– Percent of Open Interest Shorts:30.459.38.3
– Net Position:-23,240-10,87134,111
– Gross Longs:191,048407,77492,665
– Gross Shorts:214,288418,64558,554
– Long to Short Ratio:0.9 to 11.0 to 11.6 to 1
NET POSITION TREND:
– COT Index Score (3 Year Range Pct):27.972.630.9
– COT Index Reading (3 Year Range):BearishBullishBearish
NET POSITION MOVEMENT INDEX:
– 6-Week Change in Strength Index:-3.41.97.3


British Pound Sterling Futures:

5-Year Treasury Bonds Futures COT ChartThe British Pound Sterling large speculator standing this week reached a net position of -38,899 contracts in the data reported through Tuesday. This was a weekly decrease of -4,320 contracts from the previous week which had a total of -34,579 net contracts.

This week’s current strength score (the trader positioning range over the past three years, measured from 0 to 100) shows the speculators are currently Bearish with a score of 46.0 percent. The commercials are Bullish with a score of 61.5 percent and the small traders (not shown in chart) are Bearish with a score of 24.8 percent.

BRITISH POUND StatisticsSPECULATORSCOMMERCIALSSMALL TRADERS
– Percent of Open Interest Longs:22.664.79.7
– Percent of Open Interest Shorts:39.541.416.2
– Net Position:-38,89953,772-14,873
– Gross Longs:52,099149,16822,364
– Gross Shorts:90,99895,39637,237
– Long to Short Ratio:0.6 to 11.6 to 10.6 to 1
NET POSITION TREND:
– COT Index Score (3 Year Range Pct):46.061.524.8
– COT Index Reading (3 Year Range):BearishBullishBearish
NET POSITION MOVEMENT INDEX:
– 6-Week Change in Strength Index:-29.233.2-32.4


Japanese Yen Futures:

10-Year Treasury Notes Bonds Futures COT ChartThe Japanese Yen large speculator standing this week reached a net position of -78,866 contracts in the data reported through Tuesday. This was a weekly increase of 18,387 contracts from the previous week which had a total of -97,253 net contracts.

This week’s current strength score (the trader positioning range over the past three years, measured from 0 to 100) shows the speculators are currently Bearish-Extreme with a score of 18.2 percent. The commercials are Bullish-Extreme with a score of 81.9 percent and the small traders (not shown in chart) are Bearish with a score of 21.4 percent.

JAPANESE YEN StatisticsSPECULATORSCOMMERCIALSSMALL TRADERS
– Percent of Open Interest Longs:6.781.89.5
– Percent of Open Interest Shorts:43.139.315.6
– Net Position:-78,86692,033-13,167
– Gross Longs:14,585177,28520,644
– Gross Shorts:93,45185,25233,811
– Long to Short Ratio:0.2 to 12.1 to 10.6 to 1
NET POSITION TREND:
– COT Index Score (3 Year Range Pct):18.281.921.4
– COT Index Reading (3 Year Range):Bearish-ExtremeBullish-ExtremeBearish
NET POSITION MOVEMENT INDEX:
– 6-Week Change in Strength Index:15.1-15.214.7


Swiss Franc Futures:

Ultra 10-Year Treasury Notes Bonds Futures COT ChartThe Swiss Franc large speculator standing this week reached a net position of -14,182 contracts in the data reported through Tuesday. This was a weekly decline of -2,806 contracts from the previous week which had a total of -11,376 net contracts.

This week’s current strength score (the trader positioning range over the past three years, measured from 0 to 100) shows the speculators are currently Bearish with a score of 45.2 percent. The commercials are Bullish with a score of 54.7 percent and the small traders (not shown in chart) are Bearish with a score of 42.8 percent.

SWISS FRANC StatisticsSPECULATORSCOMMERCIALSSMALL TRADERS
– Percent of Open Interest Longs:7.866.024.5
– Percent of Open Interest Shorts:35.824.138.3
– Net Position:-14,18221,175-6,993
– Gross Longs:3,92733,37712,363
– Gross Shorts:18,10912,20219,356
– Long to Short Ratio:0.2 to 12.7 to 10.6 to 1
NET POSITION TREND:
– COT Index Score (3 Year Range Pct):45.254.742.8
– COT Index Reading (3 Year Range):BearishBullishBearish
NET POSITION MOVEMENT INDEX:
– 6-Week Change in Strength Index:6.0-13.725.7


Canadian Dollar Futures:

US Year Treasury Notes Long Bonds Futures COT ChartThe Canadian Dollar large speculator standing this week reached a net position of -14,075 contracts in the data reported through Tuesday. This was a weekly decrease of -10,940 contracts from the previous week which had a total of -3,135 net contracts.

This week’s current strength score (the trader positioning range over the past three years, measured from 0 to 100) shows the speculators are currently Bearish with a score of 43.3 percent. The commercials are Bullish with a score of 57.8 percent and the small traders (not shown in chart) are Bullish with a score of 53.2 percent.

CANADIAN DOLLAR StatisticsSPECULATORSCOMMERCIALSSMALL TRADERS
– Percent of Open Interest Longs:27.848.521.0
– Percent of Open Interest Shorts:37.341.918.1
– Net Position:-14,0759,8514,224
– Gross Longs:41,24272,02031,117
– Gross Shorts:55,31762,16926,893
– Long to Short Ratio:0.7 to 11.2 to 11.2 to 1
NET POSITION TREND:
– COT Index Score (3 Year Range Pct):43.357.853.2
– COT Index Reading (3 Year Range):BearishBullishBullish
NET POSITION MOVEMENT INDEX:
– 6-Week Change in Strength Index:-2.611.1-21.9


Australian Dollar Futures:

Ultra US Year Treasury Notes Long Bonds Futures COT ChartThe Australian Dollar large speculator standing this week reached a net position of -80,185 contracts in the data reported through Tuesday. This was a weekly decline of -16,920 contracts from the previous week which had a total of -63,265 net contracts.

This week’s current strength score (the trader positioning range over the past three years, measured from 0 to 100) shows the speculators are currently Bearish-Extreme with a score of 9.2 percent. The commercials are Bullish-Extreme with a score of 89.6 percent and the small traders (not shown in chart) are Bearish-Extreme with a score of 17.0 percent.

AUSTRALIAN DOLLAR StatisticsSPECULATORSCOMMERCIALSSMALL TRADERS
– Percent of Open Interest Longs:16.471.69.0
– Percent of Open Interest Shorts:56.124.716.2
– Net Position:-80,18594,709-14,524
– Gross Longs:33,217144,53918,206
– Gross Shorts:113,40249,83032,730
– Long to Short Ratio:0.3 to 12.9 to 10.6 to 1
NET POSITION TREND:
– COT Index Score (3 Year Range Pct):9.289.617.0
– COT Index Reading (3 Year Range):Bearish-ExtremeBullish-ExtremeBearish-Extreme
NET POSITION MOVEMENT INDEX:
– 6-Week Change in Strength Index:-3.910.0-22.6


New Zealand Dollar Futures:

Eurodollar Bonds Futures COT ChartThe New Zealand Dollar large speculator standing this week reached a net position of 10,630 contracts in the data reported through Tuesday. This was a weekly decline of -3,309 contracts from the previous week which had a total of 13,939 net contracts.

This week’s current strength score (the trader positioning range over the past three years, measured from 0 to 100) shows the speculators are currently Bullish-Extreme with a score of 89.1 percent. The commercials are Bearish-Extreme with a score of 16.1 percent and the small traders (not shown in chart) are Bearish with a score of 36.6 percent.

NEW ZEALAND DOLLAR StatisticsSPECULATORSCOMMERCIALSSMALL TRADERS
– Percent of Open Interest Longs:61.629.16.3
– Percent of Open Interest Shorts:40.147.98.9
– Net Position:10,630-9,303-1,327
– Gross Longs:30,46514,3873,098
– Gross Shorts:19,83523,6904,425
– Long to Short Ratio:1.5 to 10.6 to 10.7 to 1
NET POSITION TREND:
– COT Index Score (3 Year Range Pct):89.116.136.6
– COT Index Reading (3 Year Range):Bullish-ExtremeBearish-ExtremeBearish
NET POSITION MOVEMENT INDEX:
– 6-Week Change in Strength Index:7.0-2.6-28.5


Mexican Peso Futures:

Ultra 10-Year Treasury Notes Bonds Futures COT ChartThe Mexican Peso large speculator standing this week reached a net position of -59,747 contracts in the data reported through Tuesday. This was a weekly decrease of -10,286 contracts from the previous week which had a total of -49,461 net contracts.

This week’s current strength score (the trader positioning range over the past three years, measured from 0 to 100) shows the speculators are currently Bearish-Extreme with a score of 0.0 percent. The commercials are Bullish-Extreme with a score of 100.0 percent and the small traders (not shown in chart) are Bearish with a score of 37.2 percent.

MEXICAN PESO StatisticsSPECULATORSCOMMERCIALSSMALL TRADERS
– Percent of Open Interest Longs:43.953.52.2
– Percent of Open Interest Shorts:74.422.22.9
– Net Position:-59,74761,120-1,373
– Gross Longs:85,840104,6134,237
– Gross Shorts:145,58743,4935,610
– Long to Short Ratio:0.6 to 12.4 to 10.8 to 1
NET POSITION TREND:
– COT Index Score (3 Year Range Pct):0.0100.037.2
– COT Index Reading (3 Year Range):Bearish-ExtremeBullish-ExtremeBearish
NET POSITION MOVEMENT INDEX:
– 6-Week Change in Strength Index:-9.210.5-14.8


Brazilian Real Futures:

US Year Treasury Notes Long Bonds Futures COT ChartThe Brazilian Real large speculator standing this week reached a net position of -13,842 contracts in the data reported through Tuesday. This was a weekly boost of 962 contracts from the previous week which had a total of -14,804 net contracts.

This week’s current strength score (the trader positioning range over the past three years, measured from 0 to 100) shows the speculators are currently Bullish with a score of 50.1 percent. The commercials are Bullish with a score of 53.5 percent and the small traders (not shown in chart) are Bullish with a score of 52.0 percent.

BRAZIL REAL StatisticsSPECULATORSCOMMERCIALSSMALL TRADERS
– Percent of Open Interest Longs:25.668.65.0
– Percent of Open Interest Shorts:59.332.08.0
– Net Position:-13,84215,065-1,223
– Gross Longs:10,53128,2052,060
– Gross Shorts:24,37313,1403,283
– Long to Short Ratio:0.4 to 12.1 to 10.6 to 1
NET POSITION TREND:
– COT Index Score (3 Year Range Pct):50.153.552.0
– COT Index Reading (3 Year Range):BullishBullishBullish
NET POSITION MOVEMENT INDEX:
– 6-Week Change in Strength Index:-17.620.2-24.1


Russian Ruble Futures:

Ultra US Year Treasury Notes Long Bonds Futures COT ChartThe Russian Ruble large speculator standing this week reached a net position of 13,637 contracts in the data reported through Tuesday. This was a weekly decline of -4,427 contracts from the previous week which had a total of 18,064 net contracts.

This week’s current strength score (the trader positioning range over the past three years, measured from 0 to 100) shows the speculators are currently Bearish with a score of 45.7 percent. The commercials are Bearish with a score of 49.7 percent and the small traders (not shown in chart) are Bullish-Extreme with a score of 88.8 percent.

RUSSIAN RUBLE StatisticsSPECULATORSCOMMERCIALSSMALL TRADERS
– Percent of Open Interest Longs:41.752.16.1
– Percent of Open Interest Shorts:14.483.52.1
– Net Position:13,637-15,6331,996
– Gross Longs:20,81425,9983,042
– Gross Shorts:7,17741,6311,046
– Long to Short Ratio:2.9 to 10.6 to 12.9 to 1
NET POSITION TREND:
– COT Index Score (3 Year Range Pct):45.749.788.8
– COT Index Reading (3 Year Range):BearishBearishBullish-Extreme
NET POSITION MOVEMENT INDEX:
– 6-Week Change in Strength Index:-20.220.0-4.7


Bitcoin Futures:

Eurodollar Bonds Futures COT ChartThe Bitcoin large speculator standing this week reached a net position of -1,691 contracts in the data reported through Tuesday. This was a weekly decline of -1,531 contracts from the previous week which had a total of -160 net contracts.

This week’s current strength score (the trader positioning range over the past three years, measured from 0 to 100) shows the speculators are currently Bullish with a score of 63.7 percent. The commercials are Bullish-Extreme with a score of 97.0 percent and the small traders (not shown in chart) are Bearish with a score of 35.5 percent.

BITCOIN StatisticsSPECULATORSCOMMERCIALSSMALL TRADERS
– Percent of Open Interest Longs:72.26.213.7
– Percent of Open Interest Shorts:85.01.06.2
– Net Position:-1,691697994
– Gross Longs:9,5268231,811
– Gross Shorts:11,217126817
– Long to Short Ratio:0.8 to 16.5 to 12.2 to 1
NET POSITION TREND:
– COT Index Score (3 Year Range Pct):63.797.035.5
– COT Index Reading (3 Year Range):BullishBullish-ExtremeBearish
NET POSITION MOVEMENT INDEX:
– 6-Week Change in Strength Index:27.043.0-36.5


Article By InvestMacroReceive our weekly COT Reports by Email

*COT Report: The COT data, released weekly to the public each Friday, is updated through the most recent Tuesday (data is 3 days old) and shows a quick view of how large speculators or non-commercials (for-profit traders) were positioned in the futures markets.

The CFTC categorizes trader positions according to commercial hedgers (traders who use futures contracts for hedging as part of the business), non-commercials (large traders who speculate to realize trading profits) and nonreportable traders (usually small traders/speculators) as well as their open interest (contracts open in the market at time of reporting).See CFTC criteria here.
COT Speculators push 2-Year Bonds bets into bullish level for 1st time since August

Here are the latest charts and statistics for the Commitment of Traders (COT) data published by the Commodities Futures Trading Commission (CFTC).

The latest COT data is updated through Tuesday November 30th 2021 and shows a quick view of how large traders (for-profit speculators and commercial entities) were positioned in the futures markets.

Highlighting this week’s COT bonds data is the 2-Year Bond speculators bets that rose for the fifth time in the past six weeks. Bond speculators have been improving their bets for the 2-Year steadily and have also pushed their bets higher for seven out of the past nine weeks and by a total of +78,499 contracts over that period. This improving sentiment has brought the current net position standing into a bullish level for the first time since August 17th, a span of fifteen weeks. The 2-Year Treasury Note is now one of the only two bond instruments (the other is the Ultra 10-Year U.S. T-Note) in our tracking that have bullish net positions at the moment.


Data Snapshot of Bond Market Traders | Columns Legend
Nov-30-2021OIOI-IndexSpec-NetSpec-IndexCom-NetCOM-IndexSmalls-NetSmalls-Index
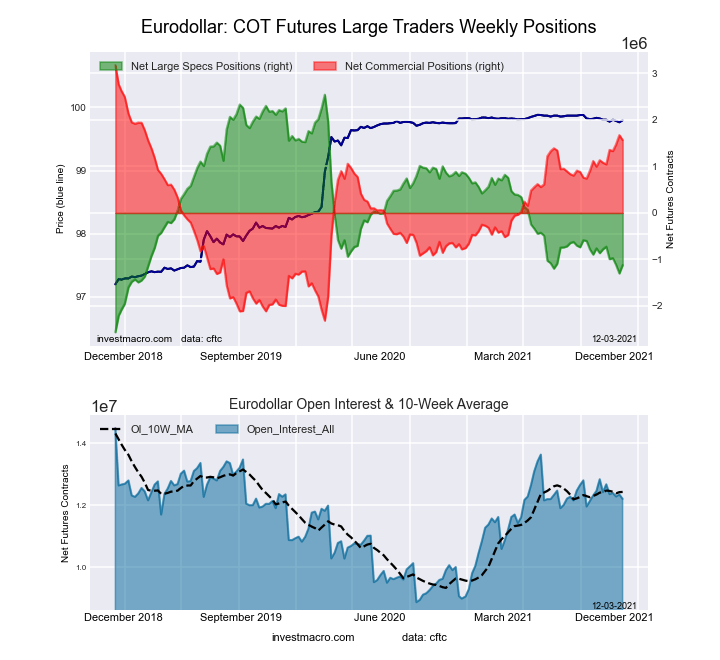
Eurodollar12,207,54159-1,121,656281,568,22271-446,56628
FedFunds1,426,03833-98,47827114,39674-15,91831
2-Year1,789,196115,6709635,09524-50,7654
Long T-Bond1,219,18152-49,6407629,5883020,05268
10-Year3,803,12551-313,37124567,63893-254,26719
5-Year3,486,53821-367,83216614,45397-246,62113


3-Month Eurodollars Futures:

Eurodollar Bonds Futures COT ChartThe 3-Month Eurodollars large speculator standing this week equaled a net position of -1,121,656 contracts in the data reported through Tuesday. This was a weekly rise of 178,825 contracts from the previous week which had a total of -1,300,481 net contracts.

This week’s current strength score (the trader positioning range over the past three years, measured from 0 to 100) shows the speculators are currently Bearish with a score of 28.3 percent. The commercials are Bullish with a score of 70.7 percent and the small traders (not shown in chart) are Bearish with a score of 27.9 percent.

3-Month Eurodollars StatisticsSPECULATORSCOMMERCIALSSMALL TRADERS
– Percent of Open Interest Longs:12.466.33.7
– Percent of Open Interest Shorts:21.653.47.4
– Net Position:-1,121,6561,568,222-446,566
– Gross Longs:1,515,2478,091,297451,347
– Gross Shorts:2,636,9036,523,075897,913
– Long to Short Ratio:0.6 to 11.2 to 10.5 to 1
NET POSITION TREND:
– COT Index Score (3 Year Range Pct):28.370.727.9
– COT Index Reading (3 Year Range):BearishBullishBearish
NET POSITION MOVEMENT INDEX:
– 6-Week Change in Strength Index:-6.78.9-24.9


30-Day Federal Funds Futures:

Federal Funds 30-Day Bonds Futures COT ChartThe 30-Day Federal Funds large speculator standing this week equaled a net position of -98,478 contracts in the data reported through Tuesday. This was a weekly decline of -16,473 contracts from the previous week which had a total of -82,005 net contracts.

This week’s current strength score (the trader positioning range over the past three years, measured from 0 to 100) shows the speculators are currently Bearish with a score of 27.5 percent. The commercials are Bullish with a score of 73.8 percent and the small traders (not shown in chart) are Bearish with a score of 30.8 percent.

30-Day Federal Funds StatisticsSPECULATORSCOMMERCIALSSMALL TRADERS
– Percent of Open Interest Longs:3.781.61.3
– Percent of Open Interest Shorts:10.673.62.4
– Net Position:-98,478114,396-15,918
– Gross Longs:52,4311,163,98918,288
– Gross Shorts:150,9091,049,59334,206
– Long to Short Ratio:0.3 to 11.1 to 10.5 to 1
NET POSITION TREND:
– COT Index Score (3 Year Range Pct):27.573.830.8
– COT Index Reading (3 Year Range):BearishBullishBearish
NET POSITION MOVEMENT INDEX:
– 6-Week Change in Strength Index:-5.45.9-10.7


2-Year Treasury Note Futures:

2-Year Treasury Bonds Futures COT ChartThe 2-Year Treasury Note large speculator standing this week equaled a net position of 15,670 contracts in the data reported through Tuesday. This was a weekly increase of 62,290 contracts from the previous week which had a total of -46,620 net contracts.

This week’s current strength score (the trader positioning range over the past three years, measured from 0 to 100) shows the speculators are currently Bullish-Extreme with a score of 95.8 percent. The commercials are Bearish with a score of 24.2 percent and the small traders (not shown in chart) are Bearish-Extreme with a score of 4.0 percent.

2-Year Treasury Note StatisticsSPECULATORSCOMMERCIALSSMALL TRADERS
– Percent of Open Interest Longs:16.273.07.0
– Percent of Open Interest Shorts:15.371.09.9
– Net Position:15,67035,095-50,765
– Gross Longs:289,3881,306,141125,667
– Gross Shorts:273,7181,271,046176,432
– Long to Short Ratio:1.1 to 11.0 to 10.7 to 1
NET POSITION TREND:
– COT Index Score (3 Year Range Pct):95.824.24.0
– COT Index Reading (3 Year Range):Bullish-ExtremeBearishBearish-Extreme
NET POSITION MOVEMENT INDEX:
– 6-Week Change in Strength Index:32.9-26.4-6.1


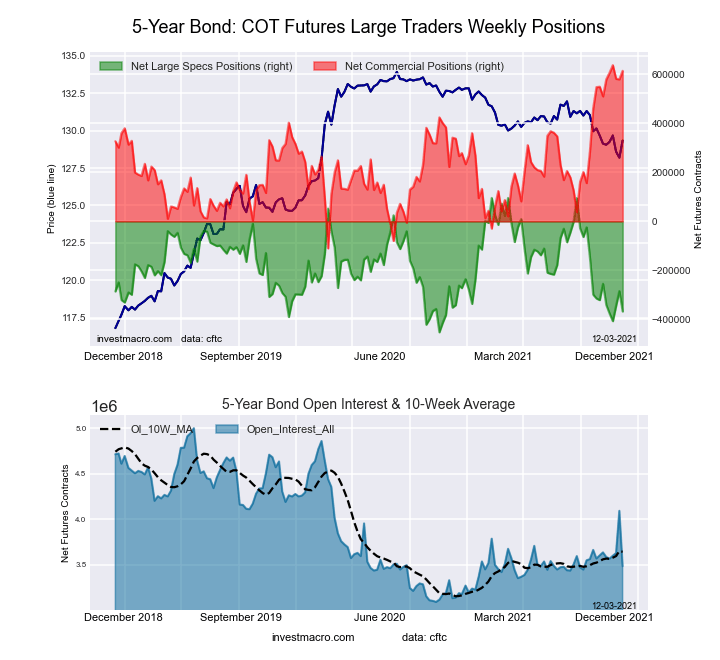
5-Year Treasury Note Futures:

5-Year Treasury Bonds Futures COT ChartThe 5-Year Treasury Note large speculator standing this week equaled a net position of -367,832 contracts in the data reported through Tuesday. This was a weekly reduction of -82,949 contracts from the previous week which had a total of -284,883 net contracts.

This week’s current strength score (the trader positioning range over the past three years, measured from 0 to 100) shows the speculators are currently Bearish-Extreme with a score of 15.5 percent. The commercials are Bullish-Extreme with a score of 96.9 percent and the small traders (not shown in chart) are Bearish-Extreme with a score of 13.3 percent.

5-Year Treasury Note StatisticsSPECULATORSCOMMERCIALSSMALL TRADERS
– Percent of Open Interest Longs:7.082.07.4
– Percent of Open Interest Shorts:17.664.414.5
– Net Position:-367,832614,453-246,621
– Gross Longs:244,8952,859,429258,648
– Gross Shorts:612,7272,244,976505,269
– Long to Short Ratio:0.4 to 11.3 to 10.5 to 1
NET POSITION TREND:
– COT Index Score (3 Year Range Pct):15.596.913.3
– COT Index Reading (3 Year Range):Bearish-ExtremeBullish-ExtremeBearish-Extreme
NET POSITION MOVEMENT INDEX:
– 6-Week Change in Strength Index:-20.513.92.3


10-Year Treasury Note Futures:

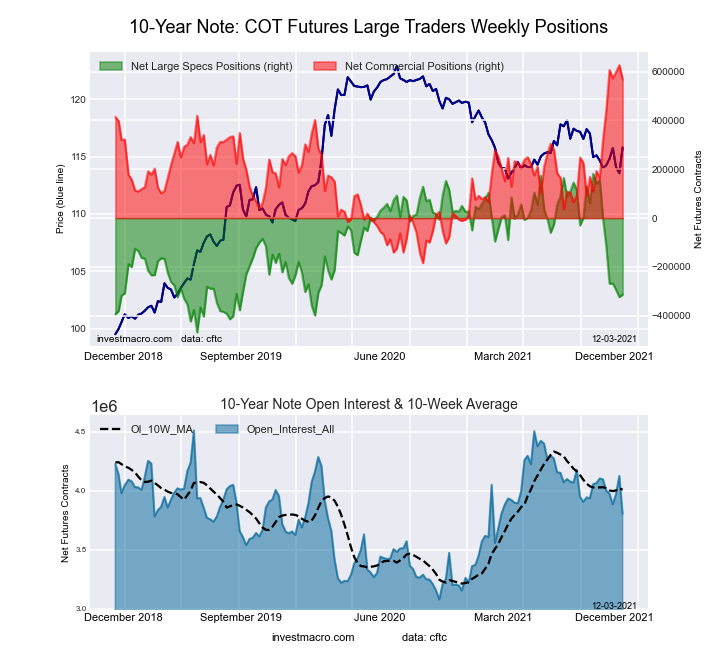
10-Year Treasury Notes Bonds Futures COT ChartThe 10-Year Treasury Note large speculator standing this week equaled a net position of -313,371 contracts in the data reported through Tuesday. This was a weekly rise of 10,044 contracts from the previous week which had a total of -323,415 net contracts.

This week’s current strength score (the trader positioning range over the past three years, measured from 0 to 100) shows the speculators are currently Bearish with a score of 23.8 percent. The commercials are Bullish-Extreme with a score of 92.8 percent and the small traders (not shown in chart) are Bearish-Extreme with a score of 19.5 percent.

10-Year Treasury Note StatisticsSPECULATORSCOMMERCIALSSMALL TRADERS
– Percent of Open Interest Longs:11.178.47.8
– Percent of Open Interest Shorts:19.363.514.5
– Net Position:-313,371567,638-254,267
– Gross Longs:420,6942,982,808297,942
– Gross Shorts:734,0652,415,170552,209
– Long to Short Ratio:0.6 to 11.2 to 10.5 to 1
NET POSITION TREND:
– COT Index Score (3 Year Range Pct):23.892.819.5
– COT Index Reading (3 Year Range):BearishBullish-ExtremeBearish-Extreme
NET POSITION MOVEMENT INDEX:
– 6-Week Change in Strength Index:-48.230.615.0


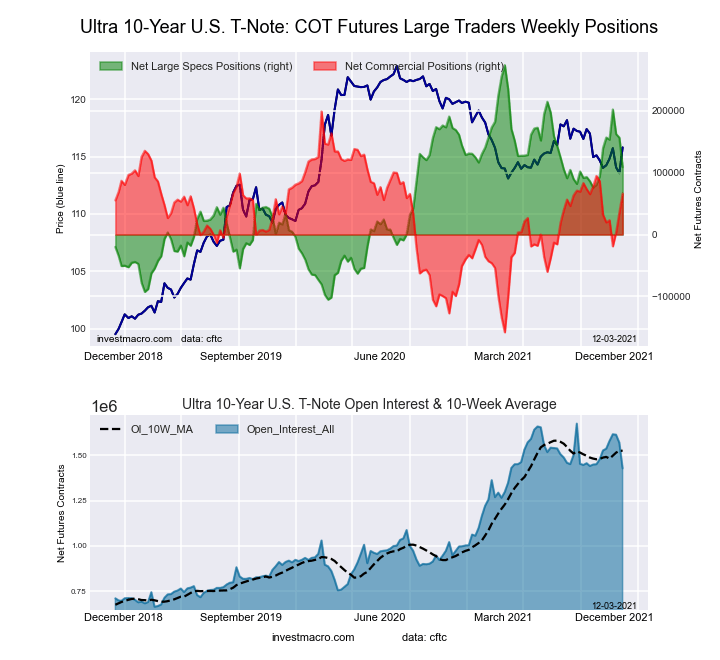
Ultra 10-Year Notes Futures:

Ultra 10-Year Treasury Notes Bonds Futures COT ChartThe Ultra 10-Year Notes large speculator standing this week equaled a net position of 108,880 contracts in the data reported through Tuesday. This was a weekly decline of -47,706 contracts from the previous week which had a total of 156,586 net contracts.

This week’s current strength score (the trader positioning range over the past three years, measured from 0 to 100) shows the speculators are currently Bullish with a score of 56.5 percent. The commercials are Bullish with a score of 62.8 percent and the small traders (not shown in chart) are Bearish-Extreme with a score of 10.2 percent.

Ultra 10-Year Notes StatisticsSPECULATORSCOMMERCIALSSMALL TRADERS
– Percent of Open Interest Longs:17.572.17.3
– Percent of Open Interest Shorts:9.967.519.5
– Net Position:108,88066,179-175,059
– Gross Longs:250,4361,030,621104,031
– Gross Shorts:141,556964,442279,090
– Long to Short Ratio:1.8 to 11.1 to 10.4 to 1
NET POSITION TREND:
– COT Index Score (3 Year Range Pct):56.562.810.2
– COT Index Reading (3 Year Range):BullishBullishBearish-Extreme
NET POSITION MOVEMENT INDEX:
– 6-Week Change in Strength Index:-8.19.5-2.0


US Treasury Bonds Futures:

US Year Treasury Notes Long Bonds Futures COT ChartThe US Treasury Bonds large speculator standing this week equaled a net position of -49,640 contracts in the data reported through Tuesday. This was a weekly decline of -38,615 contracts from the previous week which had a total of -11,025 net contracts.

This week’s current strength score (the trader positioning range over the past three years, measured from 0 to 100) shows the speculators are currently Bullish with a score of 75.6 percent. The commercials are Bearish with a score of 29.6 percent and the small traders (not shown in chart) are Bullish with a score of 68.5 percent.

US Treasury Bonds StatisticsSPECULATORSCOMMERCIALSSMALL TRADERS
– Percent of Open Interest Longs:10.572.614.9
– Percent of Open Interest Shorts:14.670.213.2
– Net Position:-49,64029,58820,052
– Gross Longs:127,915885,731181,245
– Gross Shorts:177,555856,143161,193
– Long to Short Ratio:0.7 to 11.0 to 11.1 to 1
NET POSITION TREND:
– COT Index Score (3 Year Range Pct):75.629.668.5
– COT Index Reading (3 Year Range):BullishBearishBullish
NET POSITION MOVEMENT INDEX:
– 6-Week Change in Strength Index:2.9-17.336.7


Ultra US Treasury Bonds Futures:

Ultra US Year Treasury Notes Long Bonds Futures COT ChartThe Ultra US Treasury Bonds large speculator standing this week equaled a net position of -310,496 contracts in the data reported through Tuesday. This was a weekly fall of -18,776 contracts from the previous week which had a total of -291,720 net contracts.

This week’s current strength score (the trader positioning range over the past three years, measured from 0 to 100) shows the speculators are currently Bullish with a score of 58.5 percent. The commercials are Bullish with a score of 60.1 percent and the small traders (not shown in chart) are Bearish with a score of 38.2 percent.

Ultra US Treasury Bonds StatisticsSPECULATORSCOMMERCIALSSMALL TRADERS
– Percent of Open Interest Longs:5.680.512.0
– Percent of Open Interest Shorts:30.656.610.9
– Net Position:-310,496296,67013,826
– Gross Longs:69,3051,000,175149,596
– Gross Shorts:379,801703,505135,770
– Long to Short Ratio:0.2 to 11.4 to 11.1 to 1
NET POSITION TREND:
– COT Index Score (3 Year Range Pct):58.560.138.2
– COT Index Reading (3 Year Range):BullishBullishBearish
NET POSITION MOVEMENT INDEX:
– 6-Week Change in Strength Index:0.5-8.411.4


Article By InvestMacroReceive our weekly COT Reports by Email

*COT Report: The COT data, released weekly to the public each Friday, is updated through the most recent Tuesday (data is 3 days old) and shows a quick view of how large speculators or non-commercials (for-profit traders) were positioned in the futures markets.

The CFTC categorizes trader positions according to commercial hedgers (traders who use futures contracts for hedging as part of the business), non-commercials (large traders who speculate to realize trading profits) and nonreportable traders (usually small traders/speculators) as well as their open interest (contracts open in the market at time of reporting).See CFTC criteria here.
COT Speculators cut back on Copper bets for a sixth straight week

Here are the latest charts and statistics for the Commitment of Traders (COT) data published by the Commodities Futures Trading Commission (CFTC).

The latest COT data is updated through Tuesday November 30th 2021 and shows a quick view of how large traders (for-profit speculators and commercial entities) were positioned in the futures markets.

Highlighting this week’s COT Metals data is the decline across the board in the metals speculator positioning. This week saw speculators pull back on bets for Gold (-8,551 contracts), Silver (-1,671 contracts), Copper (-4,531 contracts), Palladium (-1,207 contracts) and Platinum (-4,187 contracts).

Silver and Gold are in relatively strong speculator positioning at the moment with both right around their 60 percent strength score which measures the current level against the last three years. Copper positioning, on the other hand, has fallen quite a bit over the past year. Bullish net positions reached as high as +75,000 contracts in February before cooling off and trending lower over the year. Currently, Copper bets declined for a sixth straight week and dipped to a total bullish position of just 9,191 contracts this week.

Platinum continues to have a small bullish contract level while Palladium, the high flyer before the pandemic, has continued to have very low open interest and has been in a bearish position since August.


Data Snapshot of Commodity Market Traders | Columns Legend
Nov-30-2021OIOI-IndexSpec-NetSpec-IndexCom-NetCOM-IndexSmalls-NetSmalls-Index
WTI Crude2,033,28614387,23435-432,8855345,65179
Gold531,86833225,86060-258,6033932,74357
Silver138,003538,43461-52,0094813,57519
Copper184,214159,19149-15,763496,57263
Palladium9,62114-2,97323,27798-30427
Platinum62,385268,94815-14,696885,74842
Natural Gas1,269,87936-132,6783993,5606039,11878
Brent217,78153-15,4949312,21283,28254
Heating Oil298,300011,22559-26,8344315,60952
Soybeans671,4331555,31744-16,98062-38,3378
Corn1,405,1055394,91280-341,09423-53,81812
Coffee266,0013366,02597-69,14463,11910
Sugar882,19915214,99581-242,9272227,93242
Wheat371,5751918,29463-10,43031-7,86464


Gold Comex Futures:

Federal Funds 30-Day Bonds Futures COT ChartThe Gold Comex Futures large speculator standing this week equaled a net position of 225,860 contracts in the data reported through Tuesday. This was a weekly decline of -8,551 contracts from the previous week which had a total of 234,411 net contracts.

This week’s current strength score (the trader positioning range over the past three years, measured from 0 to 100) shows the speculators are currently Bullish with a score of 59.6 percent. The commercials are Bearish with a score of 38.7 percent and the small traders (not shown in chart) are Bullish with a score of 57.1 percent.

Gold Futures StatisticsSPECULATORSCOMMERCIALSSMALL TRADERS
– Percent of Open Interest Longs:58.322.59.7
– Percent of Open Interest Shorts:15.971.13.6
– Net Position:225,860-258,60332,743
– Gross Longs:310,253119,56251,657
– Gross Shorts:84,393378,16518,914
– Long to Short Ratio:3.7 to 10.3 to 12.7 to 1
NET POSITION TREND:
– COT Index Score (3 Year Range Pct):59.638.757.1
– COT Index Reading (3 Year Range):BullishBearishBullish
NET POSITION MOVEMENT INDEX:
– 6-Week Change in Strength Index:10.3-12.019.6


Silver Comex Futures:

2-Year Treasury Bonds Futures COT ChartThe Silver Comex Futures large speculator standing this week equaled a net position of 38,434 contracts in the data reported through Tuesday. This was a weekly decrease of -1,671 contracts from the previous week which had a total of 40,105 net contracts.

This week’s current strength score (the trader positioning range over the past three years, measured from 0 to 100) shows the speculators are currently Bullish with a score of 60.7 percent. The commercials are Bearish with a score of 47.9 percent and the small traders (not shown in chart) are Bearish-Extreme with a score of 19.0 percent.

Silver Futures StatisticsSPECULATORSCOMMERCIALSSMALL TRADERS
– Percent of Open Interest Longs:45.429.119.0
– Percent of Open Interest Shorts:17.666.79.1
– Net Position:38,434-52,00913,575
– Gross Longs:62,67840,10726,184
– Gross Shorts:24,24492,11612,609
– Long to Short Ratio:2.6 to 10.4 to 12.1 to 1
NET POSITION TREND:
– COT Index Score (3 Year Range Pct):60.747.919.0
– COT Index Reading (3 Year Range):BullishBearishBearish-Extreme
NET POSITION MOVEMENT INDEX:
– 6-Week Change in Strength Index:8.1-7.3-3.9


Copper Grade #1 Futures:

5-Year Treasury Bonds Futures COT ChartThe Copper Grade #1 Futures large speculator standing this week equaled a net position of 9,191 contracts in the data reported through Tuesday. This was a weekly decline of -4,531 contracts from the previous week which had a total of 13,722 net contracts.

This week’s current strength score (the trader positioning range over the past three years, measured from 0 to 100) shows the speculators are currently Bearish with a score of 49.0 percent. The commercials are Bearish with a score of 48.6 percent and the small traders (not shown in chart) are Bullish with a score of 63.3 percent.

Copper Futures StatisticsSPECULATORSCOMMERCIALSSMALL TRADERS
– Percent of Open Interest Longs:37.142.89.2
– Percent of Open Interest Shorts:32.151.35.6
– Net Position:9,191-15,7636,572
– Gross Longs:68,31078,77316,876
– Gross Shorts:59,11994,53610,304
– Long to Short Ratio:1.2 to 10.8 to 11.6 to 1
NET POSITION TREND:
– COT Index Score (3 Year Range Pct):49.048.663.3
– COT Index Reading (3 Year Range):BearishBearishBullish
NET POSITION MOVEMENT INDEX:
– 6-Week Change in Strength Index:-22.620.95.5


Platinum Futures:

10-Year Treasury Notes Bonds Futures COT ChartThe Platinum Futures large speculator standing this week equaled a net position of 8,948 contracts in the data reported through Tuesday. This was a weekly decline of -4,187 contracts from the previous week which had a total of 13,135 net contracts.

This week’s current strength score (the trader positioning range over the past three years, measured from 0 to 100) shows the speculators are currently Bearish-Extreme with a score of 15.3 percent. The commercials are Bullish-Extreme with a score of 88.0 percent and the small traders (not shown in chart) are Bearish with a score of 42.2 percent.

Platinum Futures StatisticsSPECULATORSCOMMERCIALSSMALL TRADERS
– Percent of Open Interest Longs:45.534.514.9
– Percent of Open Interest Shorts:31.258.15.7
– Net Position:8,948-14,6965,748
– Gross Longs:28,40821,5289,297
– Gross Shorts:19,46036,2243,549
– Long to Short Ratio:1.5 to 10.6 to 12.6 to 1
NET POSITION TREND:
– COT Index Score (3 Year Range Pct):15.388.042.2
– COT Index Reading (3 Year Range):Bearish-ExtremeBullish-ExtremeBearish
NET POSITION MOVEMENT INDEX:
– 6-Week Change in Strength Index:-8.59.3-8.2


Palladium Futures:

Ultra 10-Year Treasury Notes Bonds Futures COT ChartThe Palladium Futures large speculator standing this week equaled a net position of -2,973 contracts in the data reported through Tuesday. This was a weekly lowering of -1,207 contracts from the previous week which had a total of -1,766 net contracts.

This week’s current strength score (the trader positioning range over the past three years, measured from 0 to 100) shows the speculators are currently Bearish-Extreme with a score of 2.3 percent. The commercials are Bullish-Extreme with a score of 98.2 percent and the small traders (not shown in chart) are Bearish with a score of 26.7 percent.

Palladium Futures StatisticsSPECULATORSCOMMERCIALSSMALL TRADERS
– Percent of Open Interest Longs:30.853.413.7
– Percent of Open Interest Shorts:61.819.316.8
– Net Position:-2,9733,277-304
– Gross Longs:2,9685,1361,317
– Gross Shorts:5,9411,8591,621
– Long to Short Ratio:0.5 to 12.8 to 10.8 to 1
NET POSITION TREND:
– COT Index Score (3 Year Range Pct):2.398.226.7
– COT Index Reading (3 Year Range):Bearish-ExtremeBullish-ExtremeBearish
NET POSITION MOVEMENT INDEX:
– 6-Week Change in Strength Index:-3.15.0-21.5


Article By InvestMacroReceive our weekly COT Reports by Email

*COT Report: The COT data, released weekly to the public each Friday, is updated through the most recent Tuesday (data is 3 days old) and shows a quick view of how large speculators or non-commercials (for-profit traders) were positioned in the futures markets.

The CFTC categorizes trader positions according to commercial hedgers (traders who use futures contracts for hedging as part of the business), non-commercials (large traders who speculate to realize trading profits) and nonreportable traders (usually small traders/speculators) as well as their open interest (contracts open in the market at time of reporting).See CFTC criteria here.

COT Stock Market Speculators drop VIX bearish bets for 3rd time in 4 weeks

Here are the latest charts and statistics for the Commitment of Traders (COT) data published by the Commodities Futures Trading Commission (CFTC).

The latest COT data is updated through Tuesday November 30th 2021 and shows a quick view of how large traders (for-profit speculators and commercial entities) were positioned in the futures markets.

Highlighting this week’s COT stock market data is the VIX speculators sharply trimming their bearish bets. Stocks speculators pulled back on their VIX bearish bets for the third time in the past four weeks and by a total of 42,132 net contracts over that period. This reduction in bearish sentiment has brought the current net standing of -61,154 contracts to the least bearish level since August 3rd, a span of seventeen weeks. VIX speculators have been betting on lower volatility and positions have been as bearish as -103,286 contracts as recently as November 2nd before those positions cooled off and volatility has started to rise.


Data Snapshot of Stock Market Traders | Columns Legend
Nov-30-2021OIOI-IndexSpec-NetSpec-IndexCom-NetCOM-IndexSmalls-NetSmalls-Index
S&P500-Mini2,510,7146179,72594-192,6833112,95829
Nikkei 22517,46391,76864-2,0994533131
Nasdaq-Mini258,4764733,93394-25,45111-8,48225
DowJones-Mini101,60372-6,836272,518664,31862
VIX325,86934-61,1546068,34742-7,19329
Nikkei 225 Yen52,19832-1,0501923,96690-22,91634


VIX Volatility Futures:

Federal Funds 30-Day Bonds Futures COT ChartThe VIX Volatility large speculator standing this week recorded a net position of -61,154 contracts in the data reported through Tuesday. This was a weekly boost of 20,782 contracts from the previous week which had a total of -81,936 net contracts.

This week’s current strength score (the trader positioning range over the past three years, measured from 0 to 100) shows the speculators are currently Bullish with a score of 59.9 percent. The commercials are Bearish with a score of 41.6 percent and the small traders (not shown in chart) are Bearish with a score of 29.1 percent.

VIX Volatility Futures StatisticsSPECULATORSCOMMERCIALSSMALL TRADERS
– Percent of Open Interest Longs:20.952.56.5
– Percent of Open Interest Shorts:39.631.58.7
– Net Position:-61,15468,347-7,193
– Gross Longs:68,020171,05021,128
– Gross Shorts:129,174102,70328,321
– Long to Short Ratio:0.5 to 11.7 to 10.7 to 1
NET POSITION TREND:
– COT Index Score (3 Year Range Pct):59.941.629.1
– COT Index Reading (3 Year Range):BullishBearishBearish
NET POSITION MOVEMENT INDEX:
– 6-Week Change in Strength Index:9.8-9.3-1.3


S&P500 Mini Futures:

2-Year Treasury Bonds Futures COT ChartThe S&P500 Mini large speculator standing this week recorded a net position of 179,725 contracts in the data reported through Tuesday. This was a weekly gain of 55,911 contracts from the previous week which had a total of 123,814 net contracts.

This week’s current strength score (the trader positioning range over the past three years, measured from 0 to 100) shows the speculators are currently Bullish-Extreme with a score of 94.1 percent. The commercials are Bearish with a score of 31.4 percent and the small traders (not shown in chart) are Bearish with a score of 29.1 percent.

S&P500 Mini Futures StatisticsSPECULATORSCOMMERCIALSSMALL TRADERS
– Percent of Open Interest Longs:17.068.911.0
– Percent of Open Interest Shorts:9.876.510.5
– Net Position:179,725-192,68312,958
– Gross Longs:425,7001,729,147277,390
– Gross Shorts:245,9751,921,830264,432
– Long to Short Ratio:1.7 to 10.9 to 11.0 to 1
NET POSITION TREND:
– COT Index Score (3 Year Range Pct):94.131.429.1
– COT Index Reading (3 Year Range):Bullish-ExtremeBearishBearish
NET POSITION MOVEMENT INDEX:
– 6-Week Change in Strength Index:21.8-19.2-1.0


Dow Jones Mini Futures:

5-Year Treasury Bonds Futures COT ChartThe Dow Jones Mini large speculator standing this week recorded a net position of -6,836 contracts in the data reported through Tuesday. This was a weekly decrease of -4,685 contracts from the previous week which had a total of -2,151 net contracts.

This week’s current strength score (the trader positioning range over the past three years, measured from 0 to 100) shows the speculators are currently Bearish with a score of 27.3 percent. The commercials are Bullish with a score of 65.5 percent and the small traders (not shown in chart) are Bullish with a score of 61.6 percent.

Dow Jones Mini Futures StatisticsSPECULATORSCOMMERCIALSSMALL TRADERS
– Percent of Open Interest Longs:33.548.017.4
– Percent of Open Interest Shorts:40.345.513.1
– Net Position:-6,8362,5184,318
– Gross Longs:34,08348,77817,643
– Gross Shorts:40,91946,26013,325
– Long to Short Ratio:0.8 to 11.1 to 11.3 to 1
NET POSITION TREND:
– COT Index Score (3 Year Range Pct):27.365.561.6
– COT Index Reading (3 Year Range):BearishBullishBullish
NET POSITION MOVEMENT INDEX:
– 6-Week Change in Strength Index:-13.113.1-1.2


Nasdaq Mini Futures:

10-Year Treasury Notes Bonds Futures COT ChartThe Nasdaq Mini large speculator standing this week recorded a net position of 33,933 contracts in the data reported through Tuesday. This was a weekly rise of 5,919 contracts from the previous week which had a total of 28,014 net contracts.

This week’s current strength score (the trader positioning range over the past three years, measured from 0 to 100) shows the speculators are currently Bullish-Extreme with a score of 94.0 percent. The commercials are Bearish-Extreme with a score of 10.8 percent and the small traders (not shown in chart) are Bearish with a score of 25.0 percent.

Nasdaq Mini Futures StatisticsSPECULATORSCOMMERCIALSSMALL TRADERS
– Percent of Open Interest Longs:33.550.514.2
– Percent of Open Interest Shorts:20.460.317.5
– Net Position:33,933-25,451-8,482
– Gross Longs:86,716130,52336,787
– Gross Shorts:52,783155,97445,269
– Long to Short Ratio:1.6 to 10.8 to 10.8 to 1
NET POSITION TREND:
– COT Index Score (3 Year Range Pct):94.010.825.0
– COT Index Reading (3 Year Range):Bullish-ExtremeBearish-ExtremeBearish
NET POSITION MOVEMENT INDEX:
– 6-Week Change in Strength Index:20.7-22.1-2.5


Russell 2000 Mini Futures:

Ultra 10-Year Treasury Notes Bonds Futures COT ChartThe Russell 2000 Mini large speculator standing this week recorded a net position of -31,141 contracts in the data reported through Tuesday. This was a weekly decrease of -9,603 contracts from the previous week which had a total of -21,538 net contracts.

This week’s current strength score (the trader positioning range over the past three years, measured from 0 to 100) shows the speculators are currently Bearish with a score of 39.2 percent. The commercials are Bullish with a score of 52.6 percent and the small traders (not shown in chart) are Bullish-Extreme with a score of 84.8 percent.

Russell 2000 Mini Futures StatisticsSPECULATORSCOMMERCIALSSMALL TRADERS
– Percent of Open Interest Longs:13.077.48.5
– Percent of Open Interest Shorts:19.774.74.6
– Net Position:-31,14112,78818,353
– Gross Longs:60,401359,47839,571
– Gross Shorts:91,542346,69021,218
– Long to Short Ratio:0.7 to 11.0 to 11.9 to 1
NET POSITION TREND:
– COT Index Score (3 Year Range Pct):39.252.684.8
– COT Index Reading (3 Year Range):BearishBullishBullish-Extreme
NET POSITION MOVEMENT INDEX:
– 6-Week Change in Strength Index:19.2-21.413.7


Nikkei Stock Average (USD) Futures:

US Year Treasury Notes Long Bonds Futures COT ChartThe Nikkei Stock Average (USD) large speculator standing this week recorded a net position of 1,768 contracts in the data reported through Tuesday. This was a weekly lift of 1,012 contracts from the previous week which had a total of 756 net contracts.

This week’s current strength score (the trader positioning range over the past three years, measured from 0 to 100) shows the speculators are currently Bullish with a score of 63.9 percent. The commercials are Bearish with a score of 45.1 percent and the small traders (not shown in chart) are Bearish with a score of 31.0 percent.

Nikkei Stock Average Futures StatisticsSPECULATORSCOMMERCIALSSMALL TRADERS
– Percent of Open Interest Longs:14.658.226.8
– Percent of Open Interest Shorts:4.470.224.9
– Net Position:1,768-2,099331
– Gross Longs:2,54510,1664,686
– Gross Shorts:77712,2654,355
– Long to Short Ratio:3.3 to 10.8 to 11.1 to 1
NET POSITION TREND:
– COT Index Score (3 Year Range Pct):63.945.131.0
– COT Index Reading (3 Year Range):BullishBearishBearish
NET POSITION MOVEMENT INDEX:
– 6-Week Change in Strength Index:2.05.8-28.8


MSCI EAFE Mini Futures:

Ultra US Year Treasury Notes Long Bonds Futures COT ChartThe MSCI EAFE Mini large speculator standing this week recorded a net position of 8,636 contracts in the data reported through Tuesday. This was a weekly lowering of -138 contracts from the previous week which had a total of 8,774 net contracts.

This week’s current strength score (the trader positioning range over the past three years, measured from 0 to 100) shows the speculators are currently Bearish-Extreme with a score of 19.9 percent. The commercials are Bullish with a score of 78.3 percent and the small traders (not shown in chart) are Bearish with a score of 40.8 percent.

MSCI EAFE Mini Futures StatisticsSPECULATORSCOMMERCIALSSMALL TRADERS
– Percent of Open Interest Longs:6.890.22.4
– Percent of Open Interest Shorts:4.793.01.7
– Net Position:8,636-11,3892,753
– Gross Longs:27,744368,3389,731
– Gross Shorts:19,108379,7276,978
– Long to Short Ratio:1.5 to 11.0 to 11.4 to 1
NET POSITION TREND:
– COT Index Score (3 Year Range Pct):19.978.340.8
– COT Index Reading (3 Year Range):Bearish-ExtremeBullishBearish
NET POSITION MOVEMENT INDEX:
– 6-Week Change in Strength Index:-6.911.0-22.7


Article By InvestMacroReceive our weekly COT Reports by Email

*COT Report: The COT data, released weekly to the public each Friday, is updated through the most recent Tuesday (data is 3 days old) and shows a quick view of how large speculators or non-commercials (for-profit traders) were positioned in the futures markets.

The CFTC categorizes trader positions according to commercial hedgers (traders who use futures contracts for hedging as part of the business), non-commercials (large traders who speculate to realize trading profits) and nonreportable traders (usually small traders/speculators) as well as their open interest (contracts open in the market at time of reporting).See CFTC criteria here.
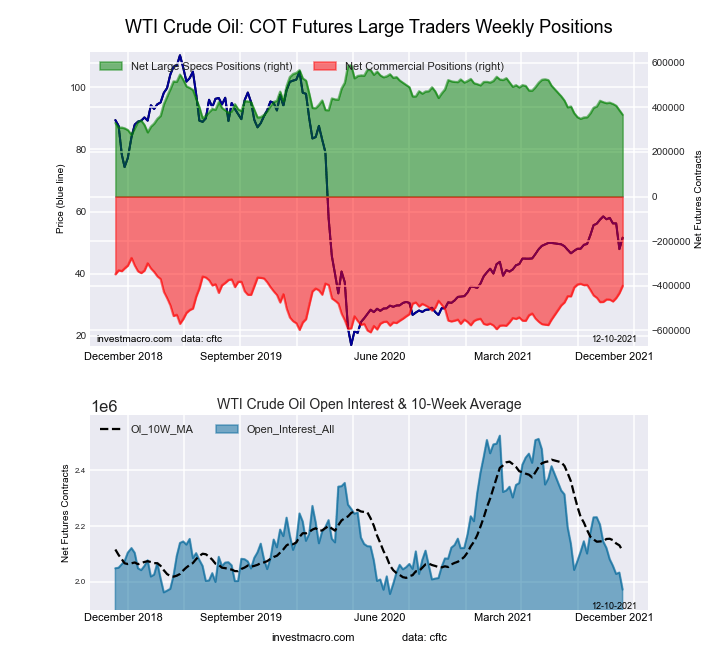
COT Energy Speculators trim Heating Oil’s bullish bets to lowest level since May

Here are the latest charts and statistics for the Commitment of Traders (COT) data published by the Commodities Futures Trading Commission (CFTC).

The latest COT data is updated through Tuesday November 30th 2021 and shows a quick view of how large traders (for-profit speculators and commercial entities) were positioned in the futures markets.

Highlighting this week’s COT energy data is the heating oil speculator bets that fell for a seventh consecutive week. Speculator positions in heating oil have fallen by a total of -27,912 contracts over these past seven weeks and have declined sharply since reaching a multi-year bullish high in October. The heating oil speculator positioning has been bullish throughout the year and climbed to the multi-year high on October 12th with a total of 39,137 contracts. This was the most bullish standing in the past one hundred and fifty-six weeks, dating back all the way to October 16th of 2018. Since then, heating oil bets have streaked lower to the least bullish speculative level since May 11th at a total of just 11,225 contracts.


Data Snapshot of Commodity Market Traders | Columns Legend
Nov-30-2021OIOI-IndexSpec-NetSpec-IndexCom-NetCOM-IndexSmalls-NetSmalls-Index
WTI Crude2,033,28614387,23435-432,8855345,65179
Gold531,86833225,86060-258,6033932,74357
Silver138,003538,43461-52,0094813,57519
Copper184,214159,19149-15,763496,57263
Palladium9,62114-2,97323,27798-30427
Platinum62,385268,94815-14,696885,74842
Natural Gas1,269,87936-132,6783993,5606039,11878
Brent217,78153-15,4949312,21283,28254
Heating Oil298,300011,22559-26,8344315,60952
Soybeans671,4331555,31744-16,98062-38,3378
Corn1,405,1055394,91280-341,09423-53,81812
Coffee266,0013366,02597-69,14463,11910
Sugar882,19915214,99581-242,9272227,93242
Wheat371,5751918,29463-10,43031-7,86464


WTI Crude Oil Futures:

WTI Crude Oil Futures COT ChartThe WTI Crude Oil Futures large speculator standing this week totaled a net position of 387,234 contracts in the data reported through Tuesday. This was a weekly fall of -20,423 contracts from the previous week which had a total of 407,657 net contracts.

This week’s current strength score (the trader positioning range over the past three years, measured from 0 to 100) shows the speculators are currently Bearish with a score of 35.2 percent. The commercials are Bullish with a score of 52.7 percent and the small traders (not shown in chart) are Bullish with a score of 79.4 percent.

WTI Crude Oil Futures StatisticsSPECULATORSCOMMERCIALSSMALL TRADERS
– Percent of Open Interest Longs:25.234.95.6
– Percent of Open Interest Shorts:6.156.23.4
– Net Position:387,234-432,88545,651
– Gross Longs:511,862710,000114,548
– Gross Shorts:124,6281,142,88568,897
– Long to Short Ratio:4.1 to 10.6 to 11.7 to 1
NET POSITION TREND:
– COT Index Score (3 Year Range Pct):35.252.779.4
– COT Index Reading (3 Year Range):BearishBullishBullish
NET POSITION MOVEMENT INDEX:
– 6-Week Change in Strength Index:-13.612.12.9


Brent Crude Oil Futures:

Brent Last Day Crude Oil Futures COT ChartThe Brent Crude Oil Futures large speculator standing this week totaled a net position of -15,494 contracts in the data reported through Tuesday. This was a weekly fall of -972 contracts from the previous week which had a total of -14,522 net contracts.

This week’s current strength score (the trader positioning range over the past three years, measured from 0 to 100) shows the speculators are currently Bullish-Extreme with a score of 93.3 percent. The commercials are Bearish-Extreme with a score of 8.5 percent and the small traders (not shown in chart) are Bullish with a score of 53.7 percent.

Brent Crude Oil Futures StatisticsSPECULATORSCOMMERCIALSSMALL TRADERS
– Percent of Open Interest Longs:20.343.33.5
– Percent of Open Interest Shorts:27.437.72.0
– Net Position:-15,49412,2123,282
– Gross Longs:44,18394,3927,626
– Gross Shorts:59,67782,1804,344
– Long to Short Ratio:0.7 to 11.1 to 11.8 to 1
NET POSITION TREND:
– COT Index Score (3 Year Range Pct):93.38.553.7
– COT Index Reading (3 Year Range):Bullish-ExtremeBearish-ExtremeBullish
NET POSITION MOVEMENT INDEX:
– 6-Week Change in Strength Index:23.0-19.7-17.9


Natural Gas Futures:

Natural Gas Futures COT ChartThe Natural Gas Futures large speculator standing this week totaled a net position of -132,678 contracts in the data reported through Tuesday. This was a weekly rise of 4,577 contracts from the previous week which had a total of -137,255 net contracts.

This week’s current strength score (the trader positioning range over the past three years, measured from 0 to 100) shows the speculators are currently Bearish with a score of 38.8 percent. The commercials are Bullish with a score of 60.4 percent and the small traders (not shown in chart) are Bullish with a score of 78.0 percent.

Natural Gas Futures StatisticsSPECULATORSCOMMERCIALSSMALL TRADERS
– Percent of Open Interest Longs:19.443.24.8
– Percent of Open Interest Shorts:29.935.81.7
– Net Position:-132,67893,56039,118
– Gross Longs:246,559548,66160,357
– Gross Shorts:379,237455,10121,239
– Long to Short Ratio:0.7 to 11.2 to 12.8 to 1
NET POSITION TREND:
– COT Index Score (3 Year Range Pct):38.860.478.0
– COT Index Reading (3 Year Range):BearishBullishBullish
NET POSITION MOVEMENT INDEX:
– 6-Week Change in Strength Index:-0.52.2-13.6


Gasoline Blendstock Futures:

RBOB Gasoline Energy Futures COT ChartThe Gasoline Blendstock Futures large speculator standing this week totaled a net position of 45,614 contracts in the data reported through Tuesday. This was a weekly decrease of -10,380 contracts from the previous week which had a total of 55,994 net contracts.

This week’s current strength score (the trader positioning range over the past three years, measured from 0 to 100) shows the speculators are currently Bearish-Extreme with a score of 16.5 percent. The commercials are Bullish-Extreme with a score of 86.9 percent and the small traders (not shown in chart) are Bearish with a score of 38.7 percent.

Nasdaq Mini Futures StatisticsSPECULATORSCOMMERCIALSSMALL TRADERS
– Percent of Open Interest Longs:32.546.96.4
– Percent of Open Interest Shorts:16.564.54.8
– Net Position:45,614-50,1634,549
– Gross Longs:92,808133,85818,336
– Gross Shorts:47,194184,02113,787
– Long to Short Ratio:2.0 to 10.7 to 11.3 to 1
NET POSITION TREND:
– COT Index Score (3 Year Range Pct):16.586.938.7
– COT Index Reading (3 Year Range):Bearish-ExtremeBullish-ExtremeBearish
NET POSITION MOVEMENT INDEX:
– 6-Week Change in Strength Index:-3.17.9-28.9


#2 Heating Oil NY-Harbor Futures:

NY Harbor Heating Oil Energy Futures COT ChartThe #2 Heating Oil NY-Harbor Futures large speculator standing this week totaled a net position of 11,225 contracts in the data reported through Tuesday. This was a weekly decrease of -4,406 contracts from the previous week which had a total of 15,631 net contracts.

This week’s current strength score (the trader positioning range over the past three years, measured from 0 to 100) shows the speculators are currently Bullish with a score of 58.9 percent. The commercials are Bearish with a score of 42.7 percent and the small traders (not shown in chart) are Bullish with a score of 52.4 percent.

Heating Oil Futures StatisticsSPECULATORSCOMMERCIALSSMALL TRADERS
– Percent of Open Interest Longs:14.049.113.5
– Percent of Open Interest Shorts:10.358.18.3
– Net Position:11,225-26,83415,609
– Gross Longs:41,864146,39240,262
– Gross Shorts:30,639173,22624,653
– Long to Short Ratio:1.4 to 10.8 to 11.6 to 1
NET POSITION TREND:
– COT Index Score (3 Year Range Pct):58.942.752.4
– COT Index Reading (3 Year Range):BullishBearishBullish
NET POSITION MOVEMENT INDEX:
– 6-Week Change in Strength Index:-22.425.0-28.4


Bloomberg Commodity Index Futures:

Bloomberg Commodity Index Futures COT ChartThe Bloomberg Commodity Index Futures large speculator standing this week totaled a net position of -11,948 contracts in the data reported through Tuesday. This was a weekly increase of 1,979 contracts from the previous week which had a total of -13,927 net contracts.

This week’s current strength score (the trader positioning range over the past three years, measured from 0 to 100) shows the speculators are currently Bullish with a score of 61.8 percent. The commercials are Bearish with a score of 37.1 percent and the small traders (not shown in chart) are Bearish with a score of 49.3 percent.

Bloomberg Index Futures StatisticsSPECULATORSCOMMERCIALSSMALL TRADERS
– Percent of Open Interest Longs:60.934.11.6
– Percent of Open Interest Shorts:91.35.10.2
– Net Position:-11,94811,380568
– Gross Longs:23,94213,396627
– Gross Shorts:35,8902,01659
– Long to Short Ratio:0.7 to 16.6 to 110.6 to 1
NET POSITION TREND:
– COT Index Score (3 Year Range Pct):61.837.149.3
– COT Index Reading (3 Year Range):BullishBearishBearish
NET POSITION MOVEMENT INDEX:
– 6-Week Change in Strength Index:17.5-17.71.5


Article By InvestMacroReceive our weekly COT Reports by Email

*COT Report: The COT data, released weekly to the public each Friday, is updated through the most recent Tuesday (data is 3 days old) and shows a quick view of how large speculators or non-commercials (for-profit traders) were positioned in the futures markets.

The CFTC categorizes trader positions according to commercial hedgers (traders who use futures contracts for hedging as part of the business), non-commercials (large traders who speculate to realize trading profits) and nonreportable traders (usually small traders/speculators) as well as their open interest (contracts open in the market at time of reporting).See CFTC criteria here.
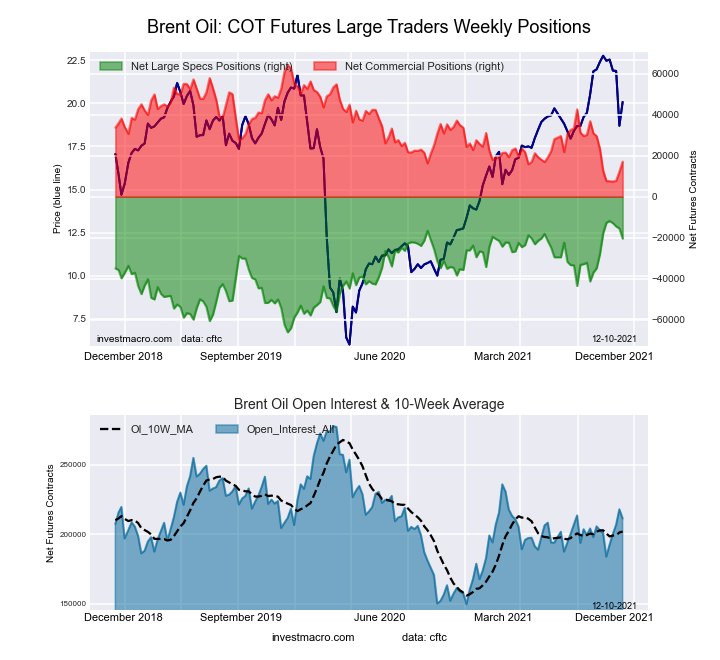
COT Speculators sharply decrease bullish bets in Corn, Sugar, Wheat & Soybeans

Here are the latest charts and statistics for the Commitment of Traders (COT) data published by the Commodities Futures Trading Commission (CFTC).

The latest COT data is updated through Tuesday November 30th 2021 and shows a quick view of how large traders (for-profit speculators and commercial entities) were positioned in the futures markets.

Highlighting this week’s COT soft commodities data was the strong decrease for many of the soft commodities speculator positions. This week saw speculators cut back on bets for Sugar (-34,631 contracts), Cocoa (-23,422 contracts), Wheat (-23,195 contracts), Corn (-22,177 contracts) and Soybean Meal (-21,150 contracts).

Most of the soft commodities have been seeing strong bullish sentiment on the part of the speculators and this week’s drop marked their largest declines in some time. Corn fell by largest amount in the past twelve weeks while Sugar saw the biggest shortfall of the past six weeks. Wheat speculator bets fell this week by most in the past one-hundred and forty-four weeks, dating back to March of 2019.
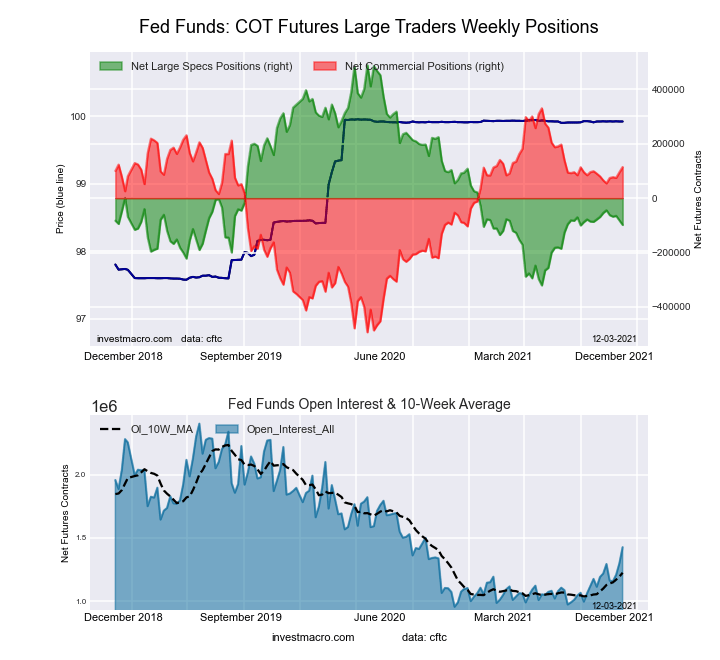
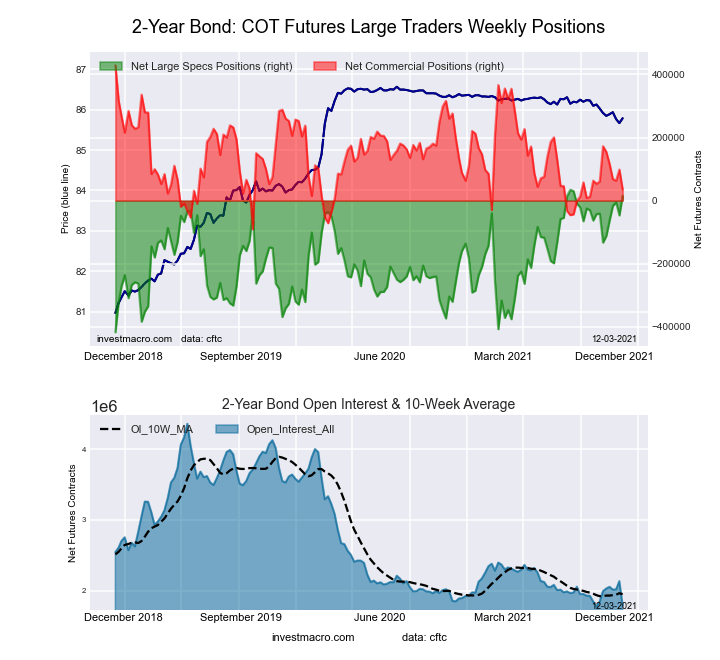
The only two soft commodities that saw higher speculator positions this week were live cattle and lean hogs.


Data Snapshot of Commodity Market Traders | Columns Legend
Nov-30-2021OIOI-IndexSpec-NetSpec-IndexCom-NetCOM-IndexSmalls-NetSmalls-Index
WTI Crude2,033,28614387,23435-432,8855345,65179
Gold531,86833225,86060-258,6033932,74357
Silver138,003538,43461-52,0094813,57519
Copper184,214159,19149-15,763496,57263
Palladium9,62114-2,97323,27798-30427
Platinum62,385268,94815-14,696885,74842
Natural Gas1,269,87936-132,6783993,5606039,11878
Brent217,78153-15,4949312,21283,28254
Heating Oil298,300011,22559-26,8344315,60952
Soybeans671,4331555,31744-16,98062-38,3378
Corn1,405,1055394,91280-341,09423-53,81812
Coffee266,0013366,02597-69,14463,11910
Sugar882,19915214,99581-242,9272227,93242
Wheat371,5751918,29463-10,43031-7,86464


CORN Futures:

Federal Funds 30-Day Bonds Futures COT ChartThe CORN large speculator standing this week resulted in a net position of 394,912 contracts in the data reported through Tuesday. This was a weekly fall of -22,177 contracts from the previous week which had a total of 417,089 net contracts.

This week’s current strength score (the trader positioning range over the past three years, measured from 0 to 100) shows the speculators are currently Bullish-Extreme with a score of 80.5 percent. The commercials are Bearish with a score of 23.3 percent and the small traders (not shown in chart) are Bearish-Extreme with a score of 12.1 percent.

CORN Futures StatisticsSPECULATORSCOMMERCIALSSMALL TRADERS
– Percent of Open Interest Longs:33.846.18.8
– Percent of Open Interest Shorts:5.770.412.6
– Net Position:394,912-341,094-53,818
– Gross Longs:474,354647,620123,204
– Gross Shorts:79,442988,714177,022
– Long to Short Ratio:6.0 to 10.7 to 10.7 to 1
NET POSITION TREND:
– COT Index Score (3 Year Range Pct):80.523.312.1
– COT Index Reading (3 Year Range):Bullish-ExtremeBearishBearish-Extreme
NET POSITION MOVEMENT INDEX:
– 6-Week Change in Strength Index:15.1-17.52.9


SUGAR Futures:

2-Year Treasury Bonds Futures COT ChartThe SUGAR large speculator standing this week resulted in a net position of 214,995 contracts in the data reported through Tuesday. This was a weekly decrease of -34,631 contracts from the previous week which had a total of 249,626 net contracts.

This week’s current strength score (the trader positioning range over the past three years, measured from 0 to 100) shows the speculators are currently Bullish-Extreme with a score of 80.8 percent. The commercials are Bearish with a score of 22.1 percent and the small traders (not shown in chart) are Bearish with a score of 42.4 percent.

SUGAR Futures StatisticsSPECULATORSCOMMERCIALSSMALL TRADERS
– Percent of Open Interest Longs:31.145.69.2
– Percent of Open Interest Shorts:6.773.16.0
– Net Position:214,995-242,92727,932
– Gross Longs:274,020402,37281,292
– Gross Shorts:59,025645,29953,360
– Long to Short Ratio:4.6 to 10.6 to 11.5 to 1
NET POSITION TREND:
– COT Index Score (3 Year Range Pct):80.822.142.4
– COT Index Reading (3 Year Range):Bullish-ExtremeBearishBearish
NET POSITION MOVEMENT INDEX:
– 6-Week Change in Strength Index:0.70.1-5.0


COFFEE Futures:

5-Year Treasury Bonds Futures COT ChartThe COFFEE large speculator standing this week resulted in a net position of 66,025 contracts in the data reported through Tuesday. This was a weekly lowering of -1,879 contracts from the previous week which had a total of 67,904 net contracts.

This week’s current strength score (the trader positioning range over the past three years, measured from 0 to 100) shows the speculators are currently Bullish-Extreme with a score of 96.6 percent. The commercials are Bearish-Extreme with a score of 5.6 percent and the small traders (not shown in chart) are Bearish-Extreme with a score of 9.9 percent.

COFFEE Futures StatisticsSPECULATORSCOMMERCIALSSMALL TRADERS
– Percent of Open Interest Longs:29.845.23.8
– Percent of Open Interest Shorts:5.071.22.6
– Net Position:66,025-69,1443,119
– Gross Longs:79,225120,2309,983
– Gross Shorts:13,200189,3746,864
– Long to Short Ratio:6.0 to 10.6 to 11.5 to 1
NET POSITION TREND:
– COT Index Score (3 Year Range Pct):96.65.69.9
– COT Index Reading (3 Year Range):Bullish-ExtremeBearish-ExtremeBearish-Extreme
NET POSITION MOVEMENT INDEX:
– 6-Week Change in Strength Index:-2.13.1-7.6


SOYBEANS Futures:

10-Year Treasury Notes Bonds Futures COT ChartThe SOYBEANS large speculator standing this week resulted in a net position of 55,317 contracts in the data reported through Tuesday. This was a weekly fall of -10,897 contracts from the previous week which had a total of 66,214 net contracts.

This week’s current strength score (the trader positioning range over the past three years, measured from 0 to 100) shows the speculators are currently Bearish with a score of 44.1 percent. The commercials are Bullish with a score of 61.8 percent and the small traders (not shown in chart) are Bearish-Extreme with a score of 8.1 percent.

SOYBEANS Futures StatisticsSPECULATORSCOMMERCIALSSMALL TRADERS
– Percent of Open Interest Longs:19.358.56.8
– Percent of Open Interest Shorts:11.161.012.5
– Net Position:55,317-16,980-38,337
– Gross Longs:129,653392,77845,663
– Gross Shorts:74,336409,75884,000
– Long to Short Ratio:1.7 to 11.0 to 10.5 to 1
NET POSITION TREND:
– COT Index Score (3 Year Range Pct):44.161.88.1
– COT Index Reading (3 Year Range):BearishBullishBearish-Extreme
NET POSITION MOVEMENT INDEX:
– 6-Week Change in Strength Index:2.9-1.7-7.3


SOYBEAN MEAL Futures:

US Year Treasury Notes Long Bonds Futures COT ChartThe SOYBEAN MEAL large speculator standing this week resulted in a net position of 61,121 contracts in the data reported through Tuesday. This was a weekly lowering of -21,150 contracts from the previous week which had a total of 82,271 net contracts.

This week’s current strength score (the trader positioning range over the past three years, measured from 0 to 100) shows the speculators are currently Bullish with a score of 64.6 percent. The commercials are Bearish with a score of 34.1 percent and the small traders (not shown in chart) are Bullish with a score of 63.9 percent.

SOYBEAN MEAL Futures StatisticsSPECULATORSCOMMERCIALSSMALL TRADERS
– Percent of Open Interest Longs:22.348.712.1
– Percent of Open Interest Shorts:6.970.06.2
– Net Position:61,121-84,38623,265
– Gross Longs:88,336192,66547,820
– Gross Shorts:27,215277,05124,555
– Long to Short Ratio:3.2 to 10.7 to 11.9 to 1
NET POSITION TREND:
– COT Index Score (3 Year Range Pct):64.634.163.9
– COT Index Reading (3 Year Range):BullishBearishBullish
NET POSITION MOVEMENT INDEX:
– 6-Week Change in Strength Index:30.4-29.40.8


LIVE CATTLE Futures:

Ultra US Year Treasury Notes Long Bonds Futures COT ChartThe LIVE CATTLE large speculator standing this week resulted in a net position of 74,654 contracts in the data reported through Tuesday. This was a weekly increase of 9,193 contracts from the previous week which had a total of 65,461 net contracts.

This week’s current strength score (the trader positioning range over the past three years, measured from 0 to 100) shows the speculators are currently Bearish with a score of 39.1 percent. The commercials are Bullish with a score of 57.0 percent and the small traders (not shown in chart) are Bullish with a score of 55.8 percent.

LIVE CATTLE Futures StatisticsSPECULATORSCOMMERCIALSSMALL TRADERS
– Percent of Open Interest Longs:39.138.09.0
– Percent of Open Interest Shorts:15.057.913.1
– Net Position:74,654-61,828-12,826
– Gross Longs:121,310117,80927,865
– Gross Shorts:46,656179,63740,691
– Long to Short Ratio:2.6 to 10.7 to 10.7 to 1
NET POSITION TREND:
– COT Index Score (3 Year Range Pct):39.157.055.8
– COT Index Reading (3 Year Range):BearishBullishBullish
NET POSITION MOVEMENT INDEX:
– 6-Week Change in Strength Index:17.6-18.2-10.2


LEAN HOGS Futures:

Eurodollar Bonds Futures COT ChartThe LEAN HOGS large speculator standing this week resulted in a net position of 59,949 contracts in the data reported through Tuesday. This was a weekly boost of 4,756 contracts from the previous week which had a total of 55,193 net contracts.

This week’s current strength score (the trader positioning range over the past three years, measured from 0 to 100) shows the speculators are currently Bullish with a score of 73.1 percent. The commercials are Bearish with a score of 39.9 percent and the small traders (not shown in chart) are Bearish-Extreme with a score of 0.0 percent.

LEAN HOGS Futures StatisticsSPECULATORSCOMMERCIALSSMALL TRADERS
– Percent of Open Interest Longs:42.932.86.7
– Percent of Open Interest Shorts:16.750.914.8
– Net Position:59,949-41,359-18,590
– Gross Longs:98,14975,04815,217
– Gross Shorts:38,200116,40733,807
– Long to Short Ratio:2.6 to 10.6 to 10.5 to 1
NET POSITION TREND:
– COT Index Score (3 Year Range Pct):73.139.90.0
– COT Index Reading (3 Year Range):BullishBearishBearish-Extreme
NET POSITION MOVEMENT INDEX:
– 6-Week Change in Strength Index:-5.58.1-10.6


COTTON Futures:

Ultra 10-Year Treasury Notes Bonds Futures COT ChartThe COTTON large speculator standing this week resulted in a net position of 96,995 contracts in the data reported through Tuesday. This was a weekly fall of -10,116 contracts from the previous week which had a total of 107,111 net contracts.

This week’s current strength score (the trader positioning range over the past three years, measured from 0 to 100) shows the speculators are currently Bullish-Extreme with a score of 84.5 percent. The commercials are Bearish-Extreme with a score of 16.7 percent and the small traders (not shown in chart) are Bullish with a score of 62.8 percent.

COTTON Futures StatisticsSPECULATORSCOMMERCIALSSMALL TRADERS
– Percent of Open Interest Longs:45.436.66.5
– Percent of Open Interest Shorts:5.879.43.3
– Net Position:96,995-104,8837,888
– Gross Longs:111,08289,51315,879
– Gross Shorts:14,087194,3967,991
– Long to Short Ratio:7.9 to 10.5 to 12.0 to 1
NET POSITION TREND:
– COT Index Score (3 Year Range Pct):84.516.762.8
– COT Index Reading (3 Year Range):Bullish-ExtremeBearish-ExtremeBullish
NET POSITION MOVEMENT INDEX:
– 6-Week Change in Strength Index:-4.77.6-34.1


COCOA Futures:

US Year Treasury Notes Long Bonds Futures COT ChartThe COCOA large speculator standing this week resulted in a net position of -7,497 contracts in the data reported through Tuesday. This was a weekly fall of -23,422 contracts from the previous week which had a total of 15,925 net contracts.

This week’s current strength score (the trader positioning range over the past three years, measured from 0 to 100) shows the speculators are currently Bearish-Extreme with a score of 16.5 percent. The commercials are Bullish-Extreme with a score of 85.3 percent and the small traders (not shown in chart) are Bearish-Extreme with a score of 12.5 percent.

COCOA Futures StatisticsSPECULATORSCOMMERCIALSSMALL TRADERS
– Percent of Open Interest Longs:25.055.04.7
– Percent of Open Interest Shorts:28.152.14.5
– Net Position:-7,4977,141356
– Gross Longs:62,102136,42811,601
– Gross Shorts:69,599129,28711,245
– Long to Short Ratio:0.9 to 11.1 to 11.0 to 1
NET POSITION TREND:
– COT Index Score (3 Year Range Pct):16.585.312.5
– COT Index Reading (3 Year Range):Bearish-ExtremeBullish-ExtremeBearish-Extreme
NET POSITION MOVEMENT INDEX:
– 6-Week Change in Strength Index:-27.730.6-44.4


WHEAT Futures:

Ultra US Year Treasury Notes Long Bonds Futures COT ChartThe WHEAT large speculator standing this week resulted in a net position of 18,294 contracts in the data reported through Tuesday. This was a weekly fall of -23,195 contracts from the previous week which had a total of 41,489 net contracts.

This week’s current strength score (the trader positioning range over the past three years, measured from 0 to 100) shows the speculators are currently Bullish with a score of 62.6 percent. The commercials are Bearish with a score of 30.7 percent and the small traders (not shown in chart) are Bullish with a score of 64.0 percent.

WHEAT Futures StatisticsSPECULATORSCOMMERCIALSSMALL TRADERS
– Percent of Open Interest Longs:31.235.58.5
– Percent of Open Interest Shorts:26.338.310.6
– Net Position:18,294-10,430-7,864
– Gross Longs:115,857132,06131,535
– Gross Shorts:97,563142,49139,399
– Long to Short Ratio:1.2 to 10.9 to 10.8 to 1
NET POSITION TREND:
– COT Index Score (3 Year Range Pct):62.630.764.0
– COT Index Reading (3 Year Range):BullishBearishBullish
NET POSITION MOVEMENT INDEX:
– 6-Week Change in Strength Index:22.9-27.98.4


Article By InvestMacroReceive our weekly COT Reports by Email

*COT Report: The COT data, released weekly to the public each Friday, is updated through the most recent Tuesday (data is 3 days old) and shows a quick view of how large speculators or non-commercials (for-profit traders) were positioned in the futures markets.

The CFTC categorizes trader positions according to commercial hedgers (traders who use futures contracts for hedging as part of the business), non-commercials (large traders who speculate to realize trading profits) and nonreportable traders (usually small traders/speculators) as well as their open interest (contracts open in the market at time of reporting).See CFTC criteria here.