
Here are the latest charts and statistics for the Commitment of Traders (COT) data published by the Commodities Futures Trading Commission (CFTC).
The latest COT data is updated through Tuesday November 30th 2021 and shows a quick view of how large traders (for-profit speculators and commercial entities) were positioned in the futures markets.
Highlighting this week’s COT soft commodities data was the strong decrease for many of the soft commodities speculator positions. This week saw speculators cut back on bets for Sugar (-34,631 contracts), Cocoa (-23,422 contracts), Wheat (-23,195 contracts), Corn (-22,177 contracts) and Soybean Meal (-21,150 contracts).
Most of the soft commodities have been seeing strong bullish sentiment on the part of the speculators and this week’s drop marked their largest declines in some time. Corn fell by largest amount in the past twelve weeks while Sugar saw the biggest shortfall of the past six weeks. Wheat speculator bets fell this week by most in the past one-hundred and forty-four weeks, dating back to March of 2019.
The only two soft commodities that saw higher speculator positions this week were live cattle and lean hogs.
| Nov-30-2021 | OI | OI-Index | Spec-Net | Spec-Index | Com-Net | COM-Index | Smalls-Net | Smalls-Index |
|---|---|---|---|---|---|---|---|---|
| WTI Crude | 2,033,286 | 14 | 387,234 | 35 | -432,885 | 53 | 45,651 | 79 |
| Gold | 531,868 | 33 | 225,860 | 60 | -258,603 | 39 | 32,743 | 57 |
| Silver | 138,003 | 5 | 38,434 | 61 | -52,009 | 48 | 13,575 | 19 |
| Copper | 184,214 | 15 | 9,191 | 49 | -15,763 | 49 | 6,572 | 63 |
| Palladium | 9,621 | 14 | -2,973 | 2 | 3,277 | 98 | -304 | 27 |
| Platinum | 62,385 | 26 | 8,948 | 15 | -14,696 | 88 | 5,748 | 42 |
| Natural Gas | 1,269,879 | 36 | -132,678 | 39 | 93,560 | 60 | 39,118 | 78 |
| Brent | 217,781 | 53 | -15,494 | 93 | 12,212 | 8 | 3,282 | 54 |
| Heating Oil | 298,300 | 0 | 11,225 | 59 | -26,834 | 43 | 15,609 | 52 |
| Soybeans | 671,433 | 15 | 55,317 | 44 | -16,980 | 62 | -38,337 | 8 |
| Corn | 1,405,105 | 5 | 394,912 | 80 | -341,094 | 23 | -53,818 | 12 |
| Coffee | 266,001 | 33 | 66,025 | 97 | -69,144 | 6 | 3,119 | 10 |
| Sugar | 882,199 | 15 | 214,995 | 81 | -242,927 | 22 | 27,932 | 42 |
| Wheat | 371,575 | 19 | 18,294 | 63 | -10,430 | 31 | -7,864 | 64 |
Free Reports:
 Get our Weekly Commitment of Traders Reports - See where the biggest traders (Hedge Funds and Commercial Hedgers) are positioned in the futures markets on a weekly basis.
 Sign Up for Our Stock Market Newsletter – Get updated on News, Charts & Rankings of Public Companies when you join our Stocks Newsletter
CORN Futures:
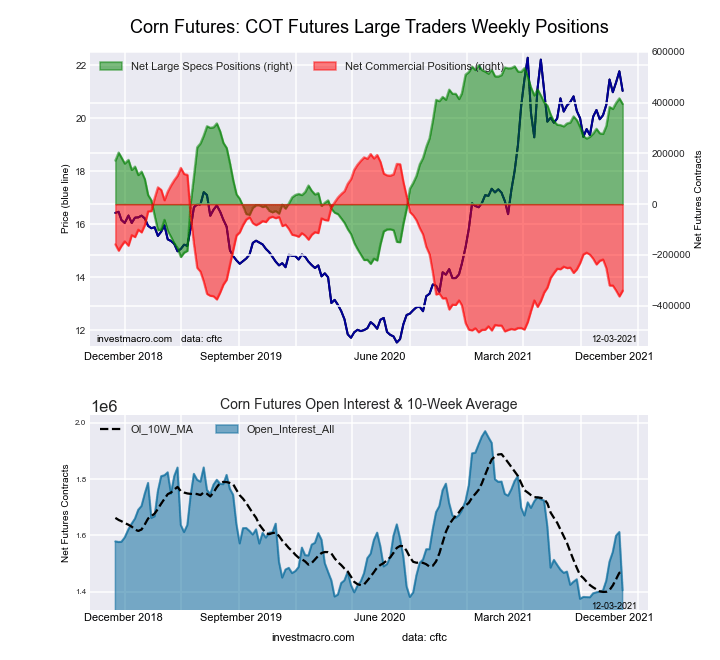 The CORN large speculator standing this week resulted in a net position of 394,912 contracts in the data reported through Tuesday. This was a weekly fall of -22,177 contracts from the previous week which had a total of 417,089 net contracts.
This week’s current strength score (the trader positioning range over the past three years, measured from 0 to 100) shows the speculators are currently Bullish-Extreme with a score of 80.5 percent. The commercials are Bearish with a score of 23.3 percent and the small traders (not shown in chart) are Bearish-Extreme with a score of 12.1 percent.
| CORN Futures Statistics | SPECULATORS | COMMERCIALS | SMALL TRADERS |
| – Percent of Open Interest Longs: | 33.8 | 46.1 | 8.8 |
| – Percent of Open Interest Shorts: | 5.7 | 70.4 | 12.6 |
| – Net Position: | 394,912 | -341,094 | -53,818 |
| – Gross Longs: | 474,354 | 647,620 | 123,204 |
| – Gross Shorts: | 79,442 | 988,714 | 177,022 |
| – Long to Short Ratio: | 6.0 to 1 | 0.7 to 1 | 0.7 to 1 |
| NET POSITION TREND: | |||
| – COT Index Score (3 Year Range Pct): | 80.5 | 23.3 | 12.1 |
| – COT Index Reading (3 Year Range): | Bullish-Extreme | Bearish | Bearish-Extreme |
| NET POSITION MOVEMENT INDEX: | |||
| – 6-Week Change in Strength Index: | 15.1 | -17.5 | 2.9 |
SUGAR Futures:
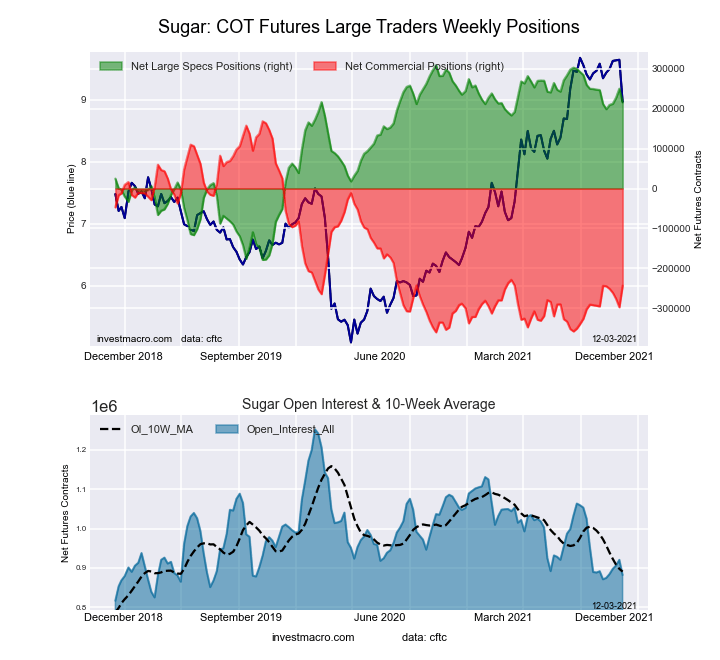 The SUGAR large speculator standing this week resulted in a net position of 214,995 contracts in the data reported through Tuesday. This was a weekly decrease of -34,631 contracts from the previous week which had a total of 249,626 net contracts.
This week’s current strength score (the trader positioning range over the past three years, measured from 0 to 100) shows the speculators are currently Bullish-Extreme with a score of 80.8 percent. The commercials are Bearish with a score of 22.1 percent and the small traders (not shown in chart) are Bearish with a score of 42.4 percent.
| SUGAR Futures Statistics | SPECULATORS | COMMERCIALS | SMALL TRADERS |
| – Percent of Open Interest Longs: | 31.1 | 45.6 | 9.2 |
| – Percent of Open Interest Shorts: | 6.7 | 73.1 | 6.0 |
| – Net Position: | 214,995 | -242,927 | 27,932 |
| – Gross Longs: | 274,020 | 402,372 | 81,292 |
| – Gross Shorts: | 59,025 | 645,299 | 53,360 |
| – Long to Short Ratio: | 4.6 to 1 | 0.6 to 1 | 1.5 to 1 |
| NET POSITION TREND: | |||
| – COT Index Score (3 Year Range Pct): | 80.8 | 22.1 | 42.4 |
| – COT Index Reading (3 Year Range): | Bullish-Extreme | Bearish | Bearish |
| NET POSITION MOVEMENT INDEX: | |||
| – 6-Week Change in Strength Index: | 0.7 | 0.1 | -5.0 |
COFFEE Futures:
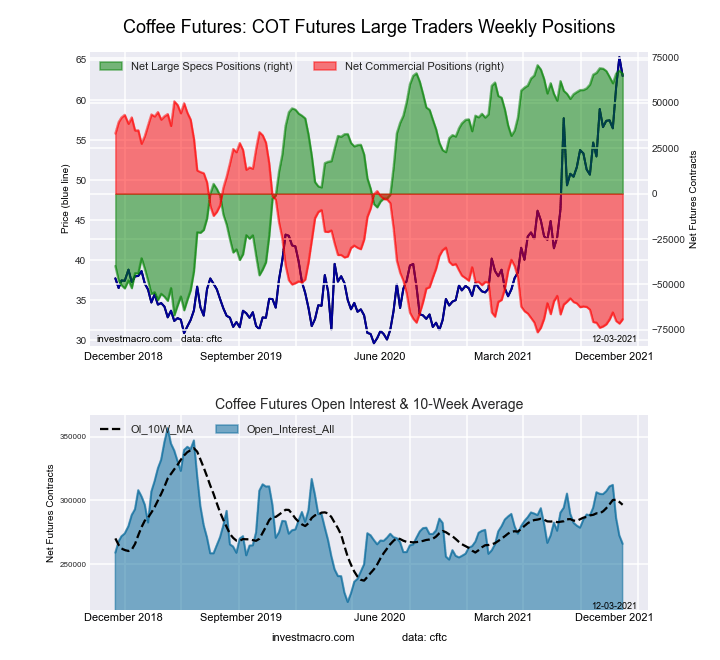 The COFFEE large speculator standing this week resulted in a net position of 66,025 contracts in the data reported through Tuesday. This was a weekly lowering of -1,879 contracts from the previous week which had a total of 67,904 net contracts.
This week’s current strength score (the trader positioning range over the past three years, measured from 0 to 100) shows the speculators are currently Bullish-Extreme with a score of 96.6 percent. The commercials are Bearish-Extreme with a score of 5.6 percent and the small traders (not shown in chart) are Bearish-Extreme with a score of 9.9 percent.
| COFFEE Futures Statistics | SPECULATORS | COMMERCIALS | SMALL TRADERS |
| – Percent of Open Interest Longs: | 29.8 | 45.2 | 3.8 |
| – Percent of Open Interest Shorts: | 5.0 | 71.2 | 2.6 |
| – Net Position: | 66,025 | -69,144 | 3,119 |
| – Gross Longs: | 79,225 | 120,230 | 9,983 |
| – Gross Shorts: | 13,200 | 189,374 | 6,864 |
| – Long to Short Ratio: | 6.0 to 1 | 0.6 to 1 | 1.5 to 1 |
| NET POSITION TREND: | |||
| – COT Index Score (3 Year Range Pct): | 96.6 | 5.6 | 9.9 |
| – COT Index Reading (3 Year Range): | Bullish-Extreme | Bearish-Extreme | Bearish-Extreme |
| NET POSITION MOVEMENT INDEX: | |||
| – 6-Week Change in Strength Index: | -2.1 | 3.1 | -7.6 |
SOYBEANS Futures:
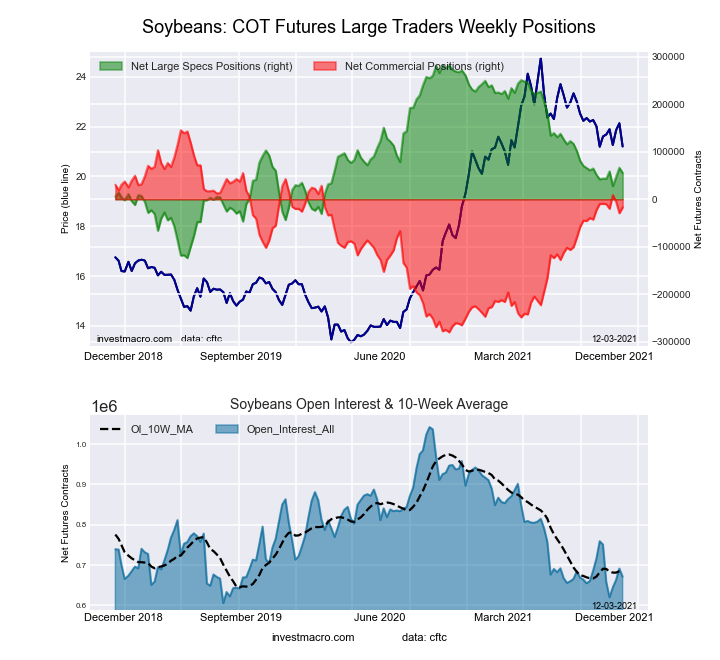 The SOYBEANS large speculator standing this week resulted in a net position of 55,317 contracts in the data reported through Tuesday. This was a weekly fall of -10,897 contracts from the previous week which had a total of 66,214 net contracts.
This week’s current strength score (the trader positioning range over the past three years, measured from 0 to 100) shows the speculators are currently Bearish with a score of 44.1 percent. The commercials are Bullish with a score of 61.8 percent and the small traders (not shown in chart) are Bearish-Extreme with a score of 8.1 percent.
| SOYBEANS Futures Statistics | SPECULATORS | COMMERCIALS | SMALL TRADERS |
| – Percent of Open Interest Longs: | 19.3 | 58.5 | 6.8 |
| – Percent of Open Interest Shorts: | 11.1 | 61.0 | 12.5 |
| – Net Position: | 55,317 | -16,980 | -38,337 |
| – Gross Longs: | 129,653 | 392,778 | 45,663 |
| – Gross Shorts: | 74,336 | 409,758 | 84,000 |
| – Long to Short Ratio: | 1.7 to 1 | 1.0 to 1 | 0.5 to 1 |
| NET POSITION TREND: | |||
| – COT Index Score (3 Year Range Pct): | 44.1 | 61.8 | 8.1 |
| – COT Index Reading (3 Year Range): | Bearish | Bullish | Bearish-Extreme |
| NET POSITION MOVEMENT INDEX: | |||
| – 6-Week Change in Strength Index: | 2.9 | -1.7 | -7.3 |
SOYBEAN MEAL Futures:
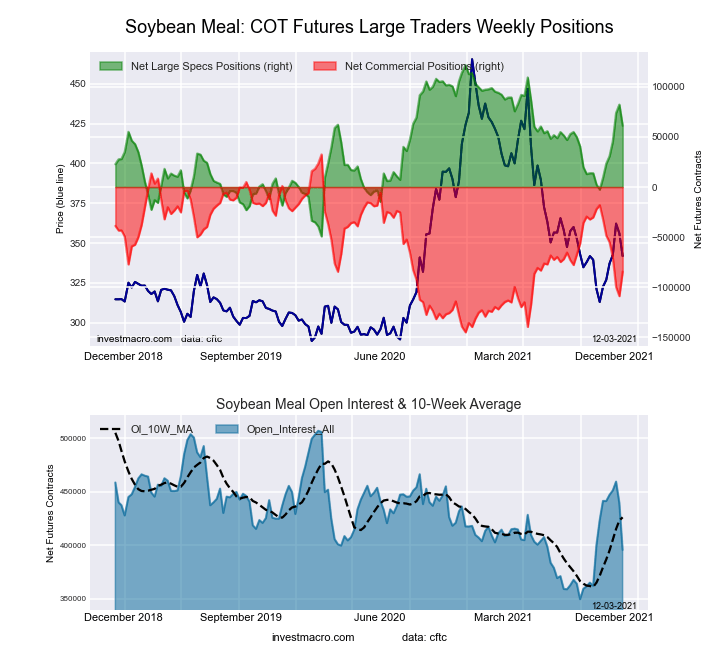 The SOYBEAN MEAL large speculator standing this week resulted in a net position of 61,121 contracts in the data reported through Tuesday. This was a weekly lowering of -21,150 contracts from the previous week which had a total of 82,271 net contracts.
This week’s current strength score (the trader positioning range over the past three years, measured from 0 to 100) shows the speculators are currently Bullish with a score of 64.6 percent. The commercials are Bearish with a score of 34.1 percent and the small traders (not shown in chart) are Bullish with a score of 63.9 percent.
| SOYBEAN MEAL Futures Statistics | SPECULATORS | COMMERCIALS | SMALL TRADERS |
| – Percent of Open Interest Longs: | 22.3 | 48.7 | 12.1 |
| – Percent of Open Interest Shorts: | 6.9 | 70.0 | 6.2 |
| – Net Position: | 61,121 | -84,386 | 23,265 |
| – Gross Longs: | 88,336 | 192,665 | 47,820 |
| – Gross Shorts: | 27,215 | 277,051 | 24,555 |
| – Long to Short Ratio: | 3.2 to 1 | 0.7 to 1 | 1.9 to 1 |
| NET POSITION TREND: | |||
| – COT Index Score (3 Year Range Pct): | 64.6 | 34.1 | 63.9 |
| – COT Index Reading (3 Year Range): | Bullish | Bearish | Bullish |
| NET POSITION MOVEMENT INDEX: | |||
| – 6-Week Change in Strength Index: | 30.4 | -29.4 | 0.8 |
LIVE CATTLE Futures:
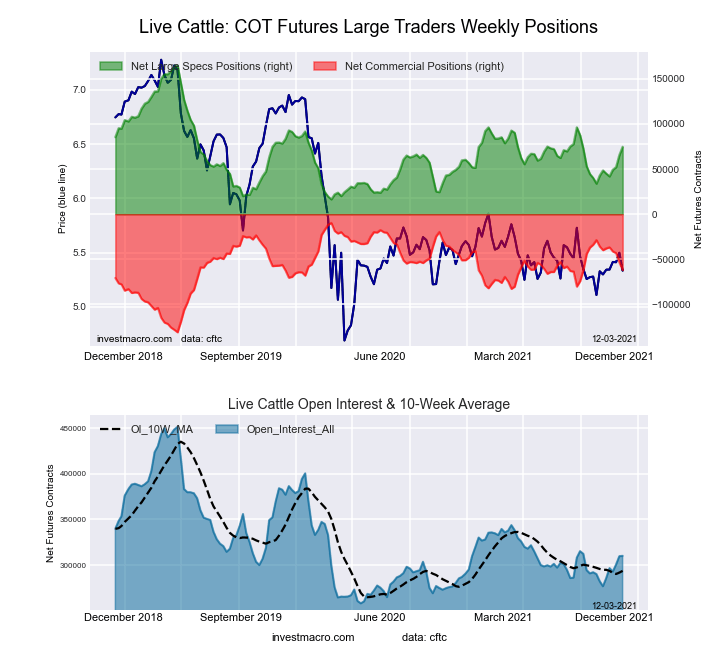 The LIVE CATTLE large speculator standing this week resulted in a net position of 74,654 contracts in the data reported through Tuesday. This was a weekly increase of 9,193 contracts from the previous week which had a total of 65,461 net contracts.
This week’s current strength score (the trader positioning range over the past three years, measured from 0 to 100) shows the speculators are currently Bearish with a score of 39.1 percent. The commercials are Bullish with a score of 57.0 percent and the small traders (not shown in chart) are Bullish with a score of 55.8 percent.
| LIVE CATTLE Futures Statistics | SPECULATORS | COMMERCIALS | SMALL TRADERS |
| – Percent of Open Interest Longs: | 39.1 | 38.0 | 9.0 |
| – Percent of Open Interest Shorts: | 15.0 | 57.9 | 13.1 |
| – Net Position: | 74,654 | -61,828 | -12,826 |
| – Gross Longs: | 121,310 | 117,809 | 27,865 |
| – Gross Shorts: | 46,656 | 179,637 | 40,691 |
| – Long to Short Ratio: | 2.6 to 1 | 0.7 to 1 | 0.7 to 1 |
| NET POSITION TREND: | |||
| – COT Index Score (3 Year Range Pct): | 39.1 | 57.0 | 55.8 |
| – COT Index Reading (3 Year Range): | Bearish | Bullish | Bullish |
| NET POSITION MOVEMENT INDEX: | |||
| – 6-Week Change in Strength Index: | 17.6 | -18.2 | -10.2 |
LEAN HOGS Futures:
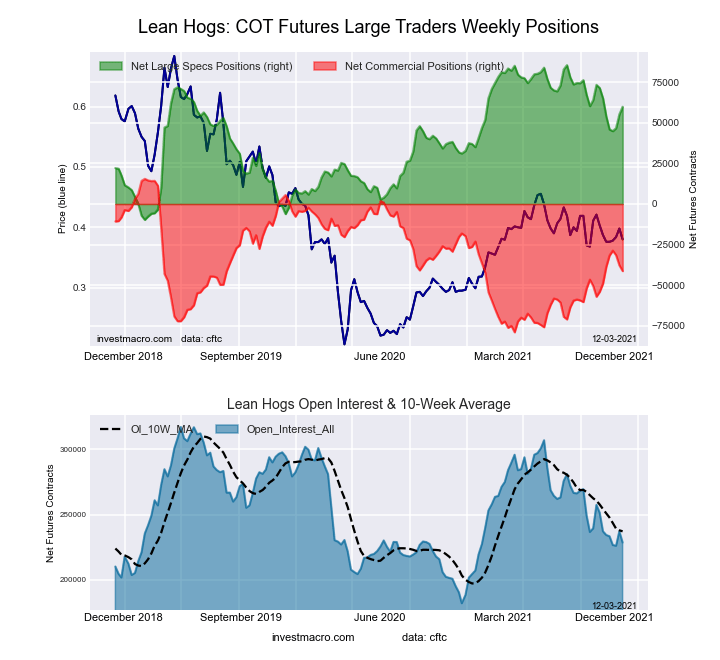 The LEAN HOGS large speculator standing this week resulted in a net position of 59,949 contracts in the data reported through Tuesday. This was a weekly boost of 4,756 contracts from the previous week which had a total of 55,193 net contracts.
This week’s current strength score (the trader positioning range over the past three years, measured from 0 to 100) shows the speculators are currently Bullish with a score of 73.1 percent. The commercials are Bearish with a score of 39.9 percent and the small traders (not shown in chart) are Bearish-Extreme with a score of 0.0 percent.
| LEAN HOGS Futures Statistics | SPECULATORS | COMMERCIALS | SMALL TRADERS |
| – Percent of Open Interest Longs: | 42.9 | 32.8 | 6.7 |
| – Percent of Open Interest Shorts: | 16.7 | 50.9 | 14.8 |
| – Net Position: | 59,949 | -41,359 | -18,590 |
| – Gross Longs: | 98,149 | 75,048 | 15,217 |
| – Gross Shorts: | 38,200 | 116,407 | 33,807 |
| – Long to Short Ratio: | 2.6 to 1 | 0.6 to 1 | 0.5 to 1 |
| NET POSITION TREND: | |||
| – COT Index Score (3 Year Range Pct): | 73.1 | 39.9 | 0.0 |
| – COT Index Reading (3 Year Range): | Bullish | Bearish | Bearish-Extreme |
| NET POSITION MOVEMENT INDEX: | |||
| – 6-Week Change in Strength Index: | -5.5 | 8.1 | -10.6 |
COTTON Futures:
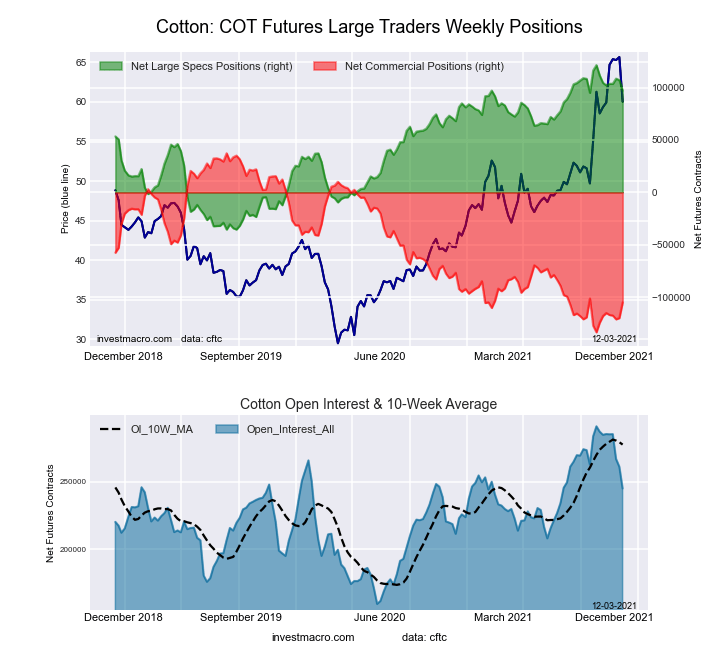 The COTTON large speculator standing this week resulted in a net position of 96,995 contracts in the data reported through Tuesday. This was a weekly fall of -10,116 contracts from the previous week which had a total of 107,111 net contracts.
This week’s current strength score (the trader positioning range over the past three years, measured from 0 to 100) shows the speculators are currently Bullish-Extreme with a score of 84.5 percent. The commercials are Bearish-Extreme with a score of 16.7 percent and the small traders (not shown in chart) are Bullish with a score of 62.8 percent.
| COTTON Futures Statistics | SPECULATORS | COMMERCIALS | SMALL TRADERS |
| – Percent of Open Interest Longs: | 45.4 | 36.6 | 6.5 |
| – Percent of Open Interest Shorts: | 5.8 | 79.4 | 3.3 |
| – Net Position: | 96,995 | -104,883 | 7,888 |
| – Gross Longs: | 111,082 | 89,513 | 15,879 |
| – Gross Shorts: | 14,087 | 194,396 | 7,991 |
| – Long to Short Ratio: | 7.9 to 1 | 0.5 to 1 | 2.0 to 1 |
| NET POSITION TREND: | |||
| – COT Index Score (3 Year Range Pct): | 84.5 | 16.7 | 62.8 |
| – COT Index Reading (3 Year Range): | Bullish-Extreme | Bearish-Extreme | Bullish |
| NET POSITION MOVEMENT INDEX: | |||
| – 6-Week Change in Strength Index: | -4.7 | 7.6 | -34.1 |
COCOA Futures:
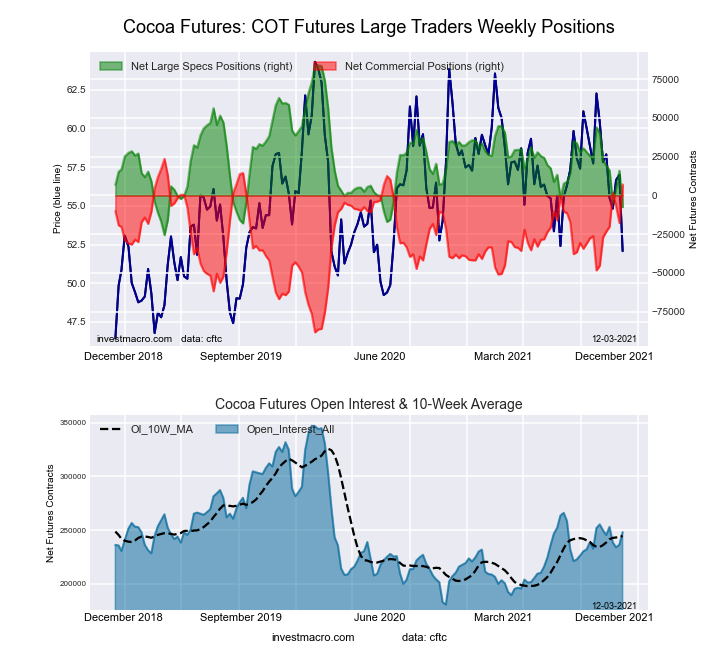 The COCOA large speculator standing this week resulted in a net position of -7,497 contracts in the data reported through Tuesday. This was a weekly fall of -23,422 contracts from the previous week which had a total of 15,925 net contracts.
This week’s current strength score (the trader positioning range over the past three years, measured from 0 to 100) shows the speculators are currently Bearish-Extreme with a score of 16.5 percent. The commercials are Bullish-Extreme with a score of 85.3 percent and the small traders (not shown in chart) are Bearish-Extreme with a score of 12.5 percent.
| COCOA Futures Statistics | SPECULATORS | COMMERCIALS | SMALL TRADERS |
| – Percent of Open Interest Longs: | 25.0 | 55.0 | 4.7 |
| – Percent of Open Interest Shorts: | 28.1 | 52.1 | 4.5 |
| – Net Position: | -7,497 | 7,141 | 356 |
| – Gross Longs: | 62,102 | 136,428 | 11,601 |
| – Gross Shorts: | 69,599 | 129,287 | 11,245 |
| – Long to Short Ratio: | 0.9 to 1 | 1.1 to 1 | 1.0 to 1 |
| NET POSITION TREND: | |||
| – COT Index Score (3 Year Range Pct): | 16.5 | 85.3 | 12.5 |
| – COT Index Reading (3 Year Range): | Bearish-Extreme | Bullish-Extreme | Bearish-Extreme |
| NET POSITION MOVEMENT INDEX: | |||
| – 6-Week Change in Strength Index: | -27.7 | 30.6 | -44.4 |
WHEAT Futures:
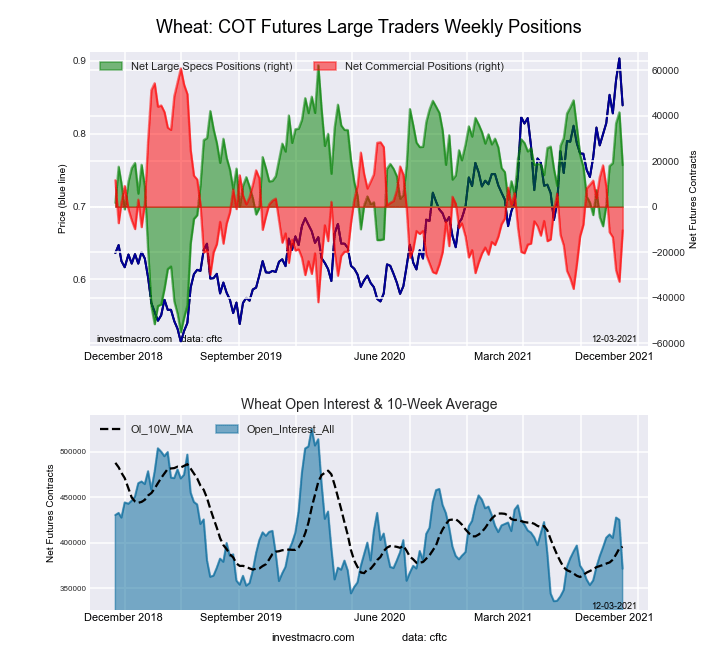 The WHEAT large speculator standing this week resulted in a net position of 18,294 contracts in the data reported through Tuesday. This was a weekly fall of -23,195 contracts from the previous week which had a total of 41,489 net contracts.
This week’s current strength score (the trader positioning range over the past three years, measured from 0 to 100) shows the speculators are currently Bullish with a score of 62.6 percent. The commercials are Bearish with a score of 30.7 percent and the small traders (not shown in chart) are Bullish with a score of 64.0 percent.
| WHEAT Futures Statistics | SPECULATORS | COMMERCIALS | SMALL TRADERS |
| – Percent of Open Interest Longs: | 31.2 | 35.5 | 8.5 |
| – Percent of Open Interest Shorts: | 26.3 | 38.3 | 10.6 |
| – Net Position: | 18,294 | -10,430 | -7,864 |
| – Gross Longs: | 115,857 | 132,061 | 31,535 |
| – Gross Shorts: | 97,563 | 142,491 | 39,399 |
| – Long to Short Ratio: | 1.2 to 1 | 0.9 to 1 | 0.8 to 1 |
| NET POSITION TREND: | |||
| – COT Index Score (3 Year Range Pct): | 62.6 | 30.7 | 64.0 |
| – COT Index Reading (3 Year Range): | Bullish | Bearish | Bullish |
| NET POSITION MOVEMENT INDEX: | |||
| – 6-Week Change in Strength Index: | 22.9 | -27.9 | 8.4 |
Article By InvestMacro – Receive our weekly COT Reports by Email
*COT Report: The COT data, released weekly to the public each Friday, is updated through the most recent Tuesday (data is 3 days old) and shows a quick view of how large speculators or non-commercials (for-profit traders) were positioned in the futures markets.
The CFTC categorizes trader positions according to commercial hedgers (traders who use futures contracts for hedging as part of the business), non-commercials (large traders who speculate to realize trading profits) and nonreportable traders (usually small traders/speculators) as well as their open interest (contracts open in the market at time of reporting).See CFTC criteria here.

- COT Metals Charts: Weekly Speculator Bets see small gains for Silver & Gold Jul 12, 2026
- COT Bonds Charts: Speculator Bets led by SOFR 3-Months & 2-Year Bonds Jul 12, 2026
- COT Energy Charts: Weekly Speculator Changes led by Brent Oil Jul 12, 2026
- COT Soft Commodities Charts: Weekly Speculator Changes led by Sugar, Corn & Soybeans Jul 12, 2026
- The US and European stock indices are rising again amid renewed investor interest in the AI industry. Jul 10, 2026
- USD/JPY Falls as Yen Recovers Weekly Losses Jul 10, 2026
- Crude oil prices surged sharply by 7% in reaction to the rapid escalation of the conflict in the Middle East Jul 9, 2026
- Middle East Tensions Weigh on Gold Jul 9, 2026
- Pound Awaits Tighter Policy from Bank of England Jul 8, 2026
- The United States carried out airstrikes on Iran after Iran’s attacked tankers in the Strait of Hormuz. The RBNZ raised the interest rate to 2.5% Jul 8, 2026