
By InvestMacro | COT | Data Tables | COT Leaders | Downloads | COT Newsletter
Here are the latest charts and statistics for the Commitment of Traders (COT) data published by the Commodities Futures Trading Commission (CFTC).
The latest COT data is updated through Tuesday December 7th 2021 and shows a quick view of how large traders (for-profit speculators and commercial entities) were positioned in the futures markets.
Highlighting this week’s COT soft commodities data is the recent rises in Corn futures bets. The speculative net position in the Corn futures has gained in three out of the past four weeks with the total rise of +35,516 contracts over that four-week time-frame. The current net standing is now over +400,000 net contracts for just the second time in the past twenty-five weeks as Corn continues to hold an extreme bullish strength score at 82.5 percent (current speculator standing compared to past three years, above 80 is bullish extreme, below 20 is bearish extreme).
The soft commodities that saw higher bets this week were Corn (15,902 contracts), Soybeans (4,337 contracts) and Live Cattle (2,869 contracts).
The markets that saw lower bets this week were Sugar (-23,756 contracts), Coffee (-3,681 contracts), Soybean Oil (-2,602 contracts), Soybean Meal (-8,478 contracts), Lean Hogs (-7,652 contracts), Cotton (-6,981 contracts), Cocoa (-1,598 contracts), and Wheat (-2,627 contracts).
Free Reports:
 Sign Up for Our Stock Market Newsletter – Get updated on News, Charts & Rankings of Public Companies when you join our Stocks Newsletter
 Get our Weekly Commitment of Traders Reports - See where the biggest traders (Hedge Funds and Commercial Hedgers) are positioned in the futures markets on a weekly basis.
| Dec-07-2021 | OI | OI-Index | Spec-Net | Spec-Index | Com-Net | COM-Index | Smalls-Net | Smalls-Index |
|---|---|---|---|---|---|---|---|---|
| WTI Crude | 1,972,536 | 3 | 367,232 | 29 | -400,431 | 62 | 33,199 | 62 |
| Gold | 499,307 | 23 | 217,185 | 57 | -245,623 | 43 | 28,438 | 45 |
| Silver | 136,572 | 4 | 29,833 | 52 | -43,148 | 57 | 13,315 | 17 |
| Copper | 173,954 | 8 | 7,204 | 48 | -14,219 | 50 | 7,015 | 66 |
| Palladium | 9,253 | 12 | -2,731 | 4 | 3,036 | 97 | -305 | 27 |
| Platinum | 65,134 | 30 | 6,062 | 11 | -12,138 | 92 | 6,076 | 47 |
| Natural Gas | 1,205,626 | 20 | -132,443 | 39 | 99,372 | 62 | 33,071 | 63 |
| Brent | 211,254 | 48 | -20,446 | 84 | 17,107 | 17 | 3,339 | 55 |
| Heating Oil | 298,997 | 0 | 8,597 | 55 | -21,351 | 49 | 12,754 | 43 |
| Soybeans | 672,116 | 15 | 59,654 | 45 | -22,744 | 60 | -36,910 | 10 |
| Corn | 1,430,401 | 9 | 410,814 | 83 | -367,873 | 20 | -42,941 | 18 |
| Coffee | 265,046 | 33 | 62,344 | 94 | -65,596 | 8 | 3,252 | 11 |
| Sugar | 857,621 | 8 | 191,239 | 76 | -221,289 | 26 | 30,050 | 45 |
| Wheat | 359,186 | 12 | 15,667 | 60 | -8,386 | 33 | -7,281 | 67 |
CORN Futures:
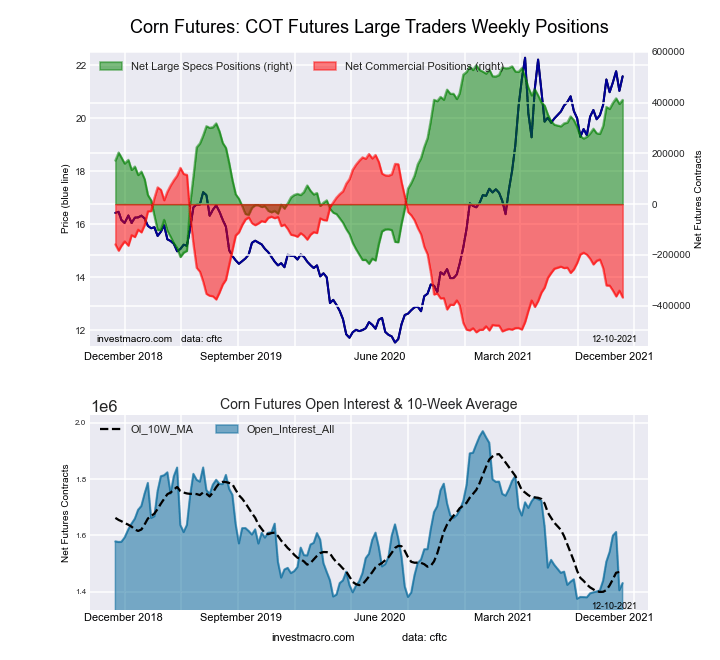 The CORN large speculator standing this week reached a net position of 410,814 contracts in the data reported through Tuesday. This was a weekly rise of 15,902 contracts from the previous week which had a total of 394,912 net contracts.
This week’s current strength score (the trader positioning range over the past three years, measured from 0 to 100) shows the speculators are currently Bullish-Extreme with a score of 82.5 percent. The commercials are Bearish-Extreme with a score of 19.5 percent and the small traders (not shown in chart) are Bearish-Extreme with a score of 18.3 percent.
| CORN Futures Statistics | SPECULATORS | COMMERCIALS | SMALL TRADERS |
| – Percent of Open Interest Longs: | 33.7 | 46.4 | 8.9 |
| – Percent of Open Interest Shorts: | 5.0 | 72.1 | 11.9 |
| – Net Position: | 410,814 | -367,873 | -42,941 |
| – Gross Longs: | 482,428 | 663,484 | 127,218 |
| – Gross Shorts: | 71,614 | 1,031,357 | 170,159 |
| – Long to Short Ratio: | 6.7 to 1 | 0.6 to 1 | 0.7 to 1 |
| NET POSITION TREND: | |||
| – Strength Index Score (3 Year Range Pct): | 82.5 | 19.5 | 18.3 |
| – Strength Index Reading (3 Year Range): | Bullish-Extreme | Bearish-Extreme | Bearish-Extreme |
| NET POSITION MOVEMENT INDEX: | |||
| – 6-Week Change in Strength Index: | 13.2 | -16.5 | 7.4 |
SUGAR Futures:
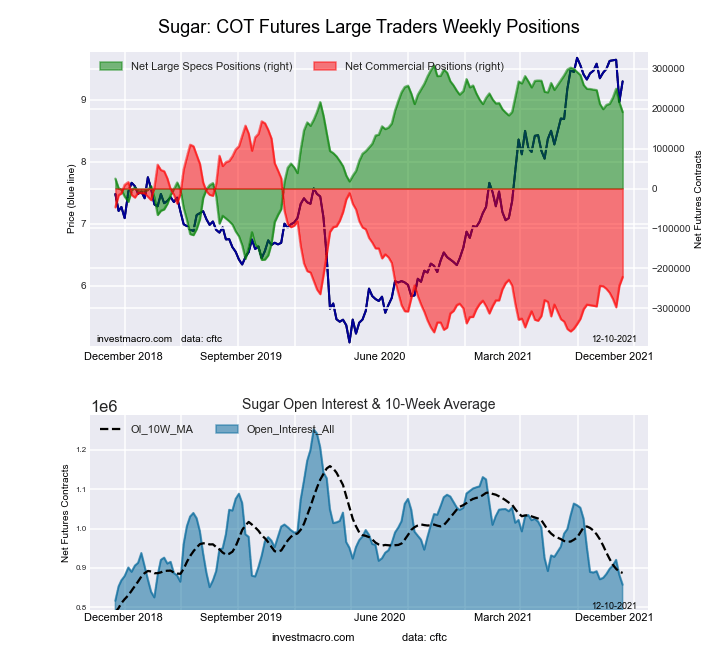 The SUGAR large speculator standing this week reached a net position of 191,239 contracts in the data reported through Tuesday. This was a weekly lowering of -23,756 contracts from the previous week which had a total of 214,995 net contracts.
This week’s current strength score (the trader positioning range over the past three years, measured from 0 to 100) shows the speculators are currently Bullish with a score of 75.9 percent. The commercials are Bearish with a score of 26.2 percent and the small traders (not shown in chart) are Bearish with a score of 45.0 percent.
| SUGAR Futures Statistics | SPECULATORS | COMMERCIALS | SMALL TRADERS |
| – Percent of Open Interest Longs: | 29.0 | 48.1 | 9.4 |
| – Percent of Open Interest Shorts: | 6.7 | 73.9 | 5.9 |
| – Net Position: | 191,239 | -221,289 | 30,050 |
| – Gross Longs: | 248,411 | 412,295 | 80,891 |
| – Gross Shorts: | 57,172 | 633,584 | 50,841 |
| – Long to Short Ratio: | 4.3 to 1 | 0.7 to 1 | 1.6 to 1 |
| NET POSITION TREND: | |||
| – Strength Index Score (3 Year Range Pct): | 75.9 | 26.2 | 45.0 |
| – Strength Index Reading (3 Year Range): | Bullish | Bearish | Bearish |
| NET POSITION MOVEMENT INDEX: | |||
| – 6-Week Change in Strength Index: | -1.5 | 4.4 | -19.4 |
COFFEE Futures:
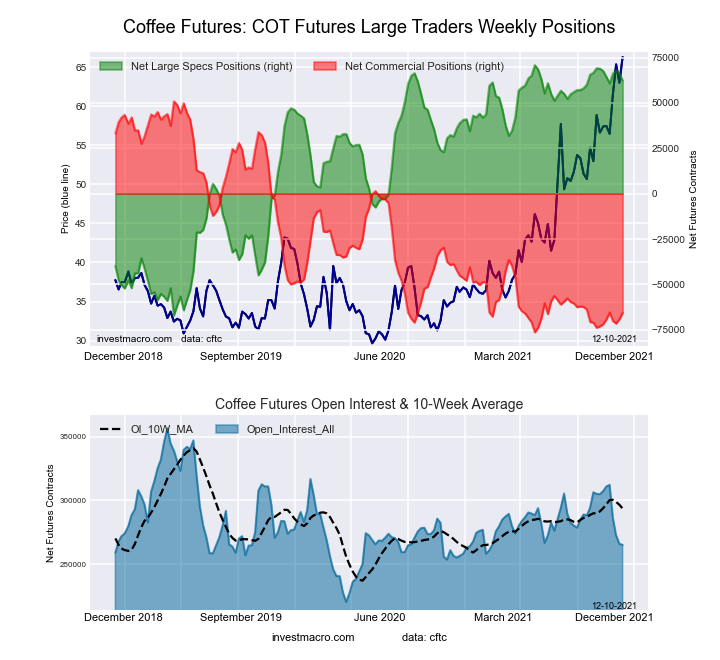 The COFFEE large speculator standing this week reached a net position of 62,344 contracts in the data reported through Tuesday. This was a weekly lowering of -3,681 contracts from the previous week which had a total of 66,025 net contracts.
This week’s current strength score (the trader positioning range over the past three years, measured from 0 to 100) shows the speculators are currently Bullish-Extreme with a score of 93.9 percent. The commercials are Bearish-Extreme with a score of 8.4 percent and the small traders (not shown in chart) are Bearish-Extreme with a score of 10.8 percent.
| COFFEE Futures Statistics | SPECULATORS | COMMERCIALS | SMALL TRADERS |
| – Percent of Open Interest Longs: | 29.0 | 47.2 | 3.8 |
| – Percent of Open Interest Shorts: | 5.5 | 71.9 | 2.5 |
| – Net Position: | 62,344 | -65,596 | 3,252 |
| – Gross Longs: | 76,852 | 125,100 | 10,004 |
| – Gross Shorts: | 14,508 | 190,696 | 6,752 |
| – Long to Short Ratio: | 5.3 to 1 | 0.7 to 1 | 1.5 to 1 |
| NET POSITION TREND: | |||
| – Strength Index Score (3 Year Range Pct): | 93.9 | 8.4 | 10.8 |
| – Strength Index Reading (3 Year Range): | Bullish-Extreme | Bearish-Extreme | Bearish-Extreme |
| NET POSITION MOVEMENT INDEX: | |||
| – 6-Week Change in Strength Index: | -3.8 | 5.0 | -7.4 |
SOYBEANS Futures:
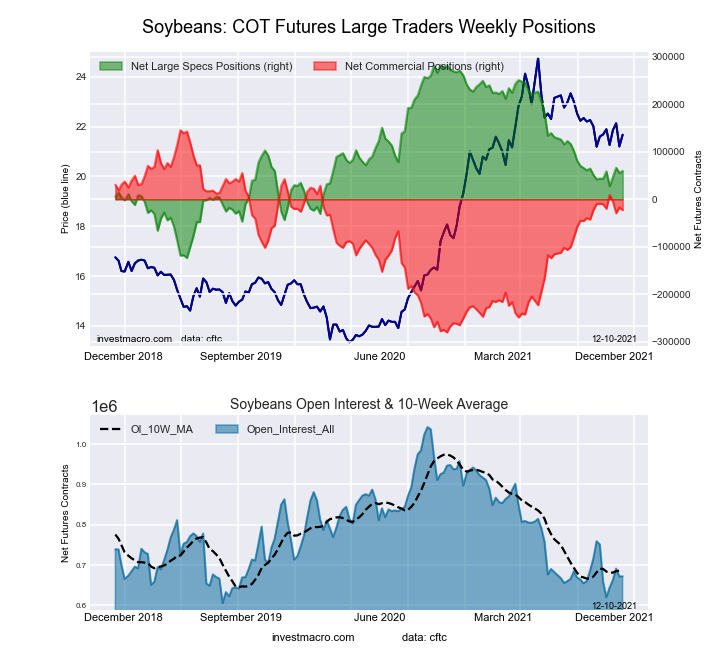 The SOYBEANS large speculator standing this week reached a net position of 59,654 contracts in the data reported through Tuesday. This was a weekly rise of 4,337 contracts from the previous week which had a total of 55,317 net contracts.
This week’s current strength score (the trader positioning range over the past three years, measured from 0 to 100) shows the speculators are currently Bearish with a score of 45.1 percent. The commercials are Bullish with a score of 60.5 percent and the small traders (not shown in chart) are Bearish-Extreme with a score of 10.4 percent.
| SOYBEANS Futures Statistics | SPECULATORS | COMMERCIALS | SMALL TRADERS |
| – Percent of Open Interest Longs: | 18.6 | 57.5 | 7.0 |
| – Percent of Open Interest Shorts: | 9.8 | 60.9 | 12.5 |
| – Net Position: | 59,654 | -22,744 | -36,910 |
| – Gross Longs: | 125,257 | 386,500 | 46,981 |
| – Gross Shorts: | 65,603 | 409,244 | 83,891 |
| – Long to Short Ratio: | 1.9 to 1 | 0.9 to 1 | 0.6 to 1 |
| NET POSITION TREND: | |||
| – Strength Index Score (3 Year Range Pct): | 45.1 | 60.5 | 10.4 |
| – Strength Index Reading (3 Year Range): | Bearish | Bullish | Bearish-Extreme |
| NET POSITION MOVEMENT INDEX: | |||
| – 6-Week Change in Strength Index: | 4.1 | -3.0 | -6.4 |
SOYBEAN OIL Futures:
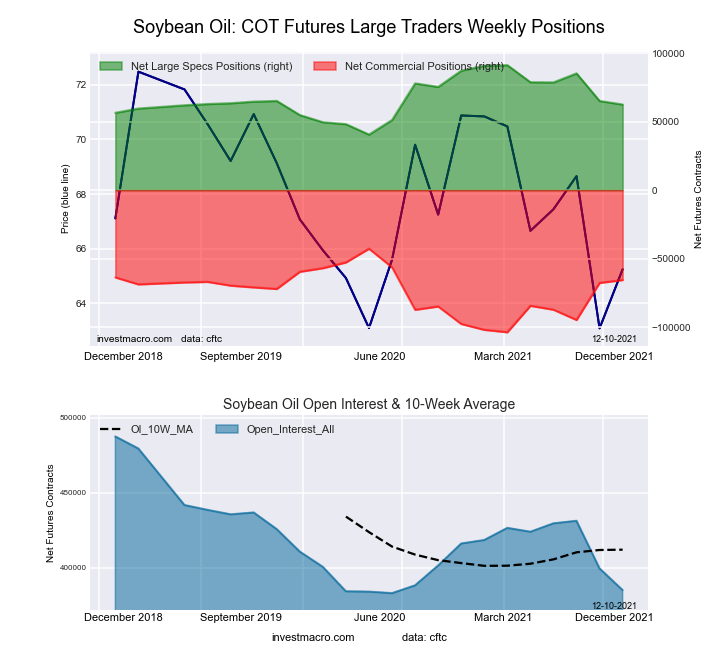 The SOYBEAN OIL large speculator standing this week reached a net position of 62,445 contracts in the data reported through Tuesday. This was a weekly reduction of -2,602 contracts from the previous week which had a total of 65,047 net contracts.
This week’s current strength score (the trader positioning range over the past three years, measured from 0 to 100) shows the speculators are currently Bullish with a score of 57.5 percent. The commercials are Bearish with a score of 47.0 percent and the small traders (not shown in chart) are Bearish with a score of 24.9 percent.
| SOYBEAN OIL Futures Statistics | SPECULATORS | COMMERCIALS | SMALL TRADERS |
| – Percent of Open Interest Longs: | 26.4 | 51.9 | 7.1 |
| – Percent of Open Interest Shorts: | 10.2 | 69.0 | 6.3 |
| – Net Position: | 62,445 | -65,501 | 3,056 |
| – Gross Longs: | 101,774 | 199,942 | 27,293 |
| – Gross Shorts: | 39,329 | 265,443 | 24,237 |
| – Long to Short Ratio: | 2.6 to 1 | 0.8 to 1 | 1.1 to 1 |
| NET POSITION TREND: | |||
| – Strength Index Score (3 Year Range Pct): | 57.5 | 47.0 | 24.9 |
| – Strength Index Reading (3 Year Range): | Bullish | Bearish | Bearish |
| NET POSITION MOVEMENT INDEX: | |||
| – 6-Week Change in Strength Index: | -15.3 | 18.2 | -30.0 |
SOYBEAN MEAL Futures:
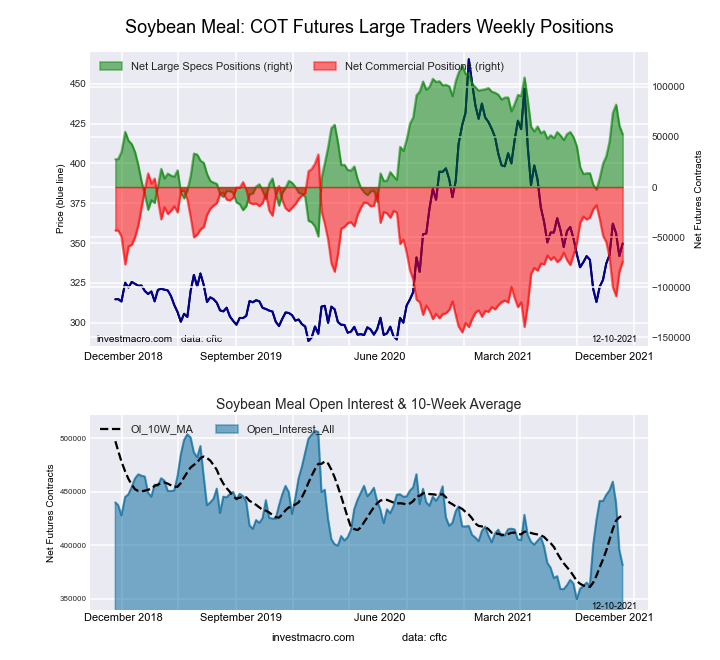 The SOYBEAN MEAL large speculator standing this week reached a net position of 52,643 contracts in the data reported through Tuesday. This was a weekly fall of -8,478 contracts from the previous week which had a total of 61,121 net contracts.
This week’s current strength score (the trader positioning range over the past three years, measured from 0 to 100) shows the speculators are currently Bullish with a score of 59.6 percent. The commercials are Bearish with a score of 39.8 percent and the small traders (not shown in chart) are Bullish with a score of 57.6 percent.
| SOYBEAN MEAL Futures Statistics | SPECULATORS | COMMERCIALS | SMALL TRADERS |
| – Percent of Open Interest Longs: | 22.1 | 49.4 | 12.8 |
| – Percent of Open Interest Shorts: | 8.3 | 68.9 | 7.1 |
| – Net Position: | 52,643 | -74,341 | 21,698 |
| – Gross Longs: | 84,189 | 188,494 | 48,687 |
| – Gross Shorts: | 31,546 | 262,835 | 26,989 |
| – Long to Short Ratio: | 2.7 to 1 | 0.7 to 1 | 1.8 to 1 |
| NET POSITION TREND: | |||
| – Strength Index Score (3 Year Range Pct): | 59.6 | 39.8 | 57.6 |
| – Strength Index Reading (3 Year Range): | Bullish | Bearish | Bullish |
| NET POSITION MOVEMENT INDEX: | |||
| – 6-Week Change in Strength Index: | 17.1 | -14.5 | -13.6 |
LIVE CATTLE Futures:
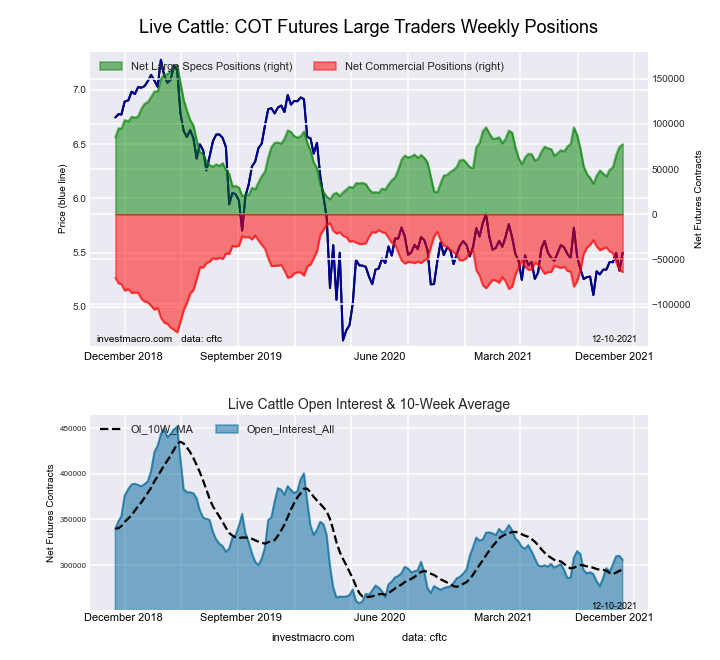 The LIVE CATTLE large speculator standing this week reached a net position of 77,523 contracts in the data reported through Tuesday. This was a weekly advance of 2,869 contracts from the previous week which had a total of 74,654 net contracts.
This week’s current strength score (the trader positioning range over the past three years, measured from 0 to 100) shows the speculators are currently Bearish with a score of 41.1 percent. The commercials are Bullish with a score of 55.2 percent and the small traders (not shown in chart) are Bullish with a score of 54.1 percent.
| LIVE CATTLE Futures Statistics | SPECULATORS | COMMERCIALS | SMALL TRADERS |
| – Percent of Open Interest Longs: | 39.6 | 37.7 | 9.2 |
| – Percent of Open Interest Shorts: | 14.2 | 58.6 | 13.6 |
| – Net Position: | 77,523 | -63,995 | -13,528 |
| – Gross Longs: | 120,946 | 115,149 | 28,080 |
| – Gross Shorts: | 43,423 | 179,144 | 41,608 |
| – Long to Short Ratio: | 2.8 to 1 | 0.6 to 1 | 0.7 to 1 |
| NET POSITION TREND: | |||
| – Strength Index Score (3 Year Range Pct): | 41.1 | 55.2 | 54.1 |
| – Strength Index Reading (3 Year Range): | Bearish | Bullish | Bullish |
| NET POSITION MOVEMENT INDEX: | |||
| – 6-Week Change in Strength Index: | 21.9 | -21.6 | -15.7 |
LEAN HOGS Futures:
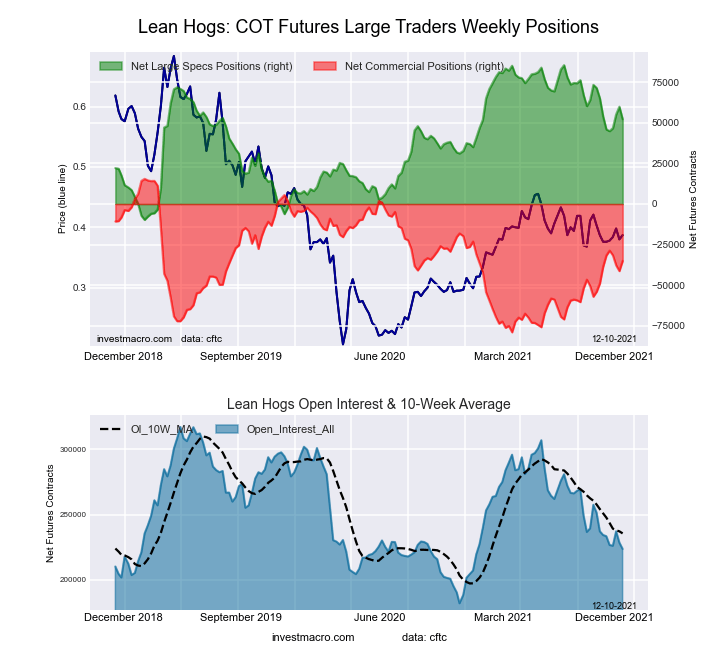 The LEAN HOGS large speculator standing this week reached a net position of 52,297 contracts in the data reported through Tuesday. This was a weekly fall of -7,652 contracts from the previous week which had a total of 59,949 net contracts.
This week’s current strength score (the trader positioning range over the past three years, measured from 0 to 100) shows the speculators are currently Bullish with a score of 65.1 percent. The commercials are Bearish with a score of 46.5 percent and the small traders (not shown in chart) are Bearish-Extreme with a score of 6.0 percent.
| LEAN HOGS Futures Statistics | SPECULATORS | COMMERCIALS | SMALL TRADERS |
| – Percent of Open Interest Longs: | 41.5 | 34.7 | 6.8 |
| – Percent of Open Interest Shorts: | 18.1 | 50.4 | 14.5 |
| – Net Position: | 52,297 | -35,096 | -17,201 |
| – Gross Longs: | 92,824 | 77,627 | 15,221 |
| – Gross Shorts: | 40,527 | 112,723 | 32,422 |
| – Long to Short Ratio: | 2.3 to 1 | 0.7 to 1 | 0.5 to 1 |
| NET POSITION TREND: | |||
| – Strength Index Score (3 Year Range Pct): | 65.1 | 46.5 | 6.0 |
| – Strength Index Reading (3 Year Range): | Bullish | Bearish | Bearish-Extreme |
| NET POSITION MOVEMENT INDEX: | |||
| – 6-Week Change in Strength Index: | -1.8 | 3.9 | -8.2 |
COTTON Futures:
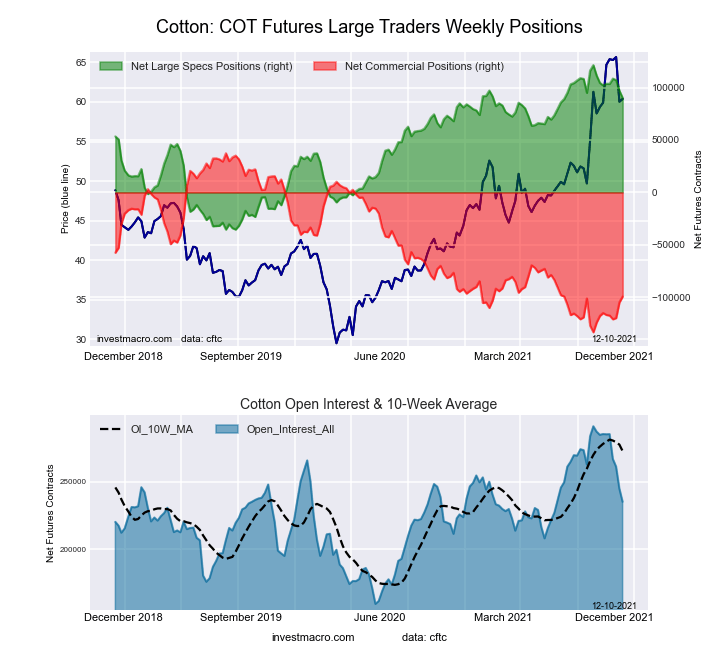 The COTTON large speculator standing this week reached a net position of 90,014 contracts in the data reported through Tuesday. This was a weekly decline of -6,981 contracts from the previous week which had a total of 96,995 net contracts.
This week’s current strength score (the trader positioning range over the past three years, measured from 0 to 100) shows the speculators are currently Bullish-Extreme with a score of 80.0 percent. The commercials are Bearish-Extreme with a score of 19.9 percent and the small traders (not shown in chart) are Bullish with a score of 71.5 percent.
| COTTON Futures Statistics | SPECULATORS | COMMERCIALS | SMALL TRADERS |
| – Percent of Open Interest Longs: | 44.1 | 36.2 | 7.1 |
| – Percent of Open Interest Shorts: | 5.8 | 78.5 | 3.2 |
| – Net Position: | 90,014 | -99,303 | 9,289 |
| – Gross Longs: | 103,611 | 85,095 | 16,792 |
| – Gross Shorts: | 13,597 | 184,398 | 7,503 |
| – Long to Short Ratio: | 7.6 to 1 | 0.5 to 1 | 2.2 to 1 |
| NET POSITION TREND: | |||
| – Strength Index Score (3 Year Range Pct): | 80.0 | 19.9 | 71.5 |
| – Strength Index Reading (3 Year Range): | Bullish-Extreme | Bearish-Extreme | Bullish |
| NET POSITION MOVEMENT INDEX: | |||
| – 6-Week Change in Strength Index: | -7.7 | 9.2 | -22.5 |
COCOA Futures:
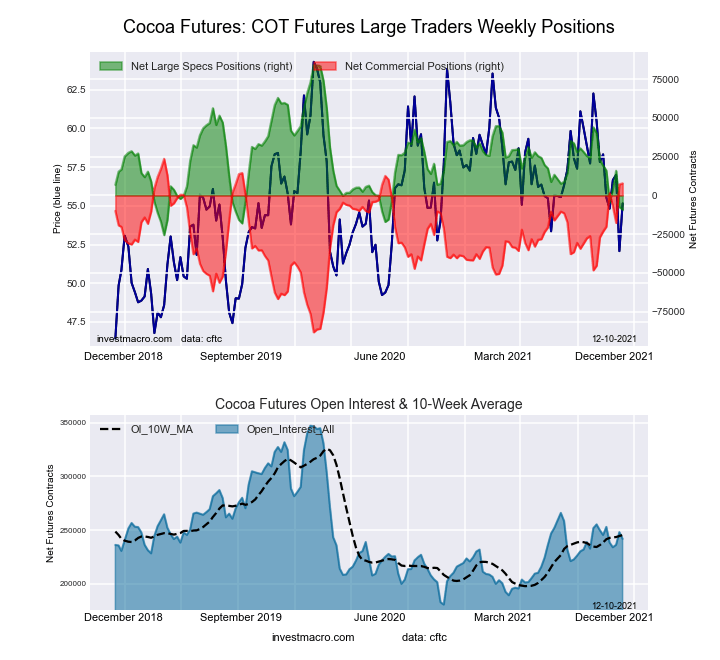 The COCOA large speculator standing this week reached a net position of -9,095 contracts in the data reported through Tuesday. This was a weekly decrease of -1,598 contracts from the previous week which had a total of -7,497 net contracts.
This week’s current strength score (the trader positioning range over the past three years, measured from 0 to 100) shows the speculators are currently Bearish-Extreme with a score of 15.0 percent. The commercials are Bullish-Extreme with a score of 85.9 percent and the small traders (not shown in chart) are Bearish with a score of 23.2 percent.
| COCOA Futures Statistics | SPECULATORS | COMMERCIALS | SMALL TRADERS |
| – Percent of Open Interest Longs: | 26.3 | 54.1 | 4.8 |
| – Percent of Open Interest Shorts: | 30.0 | 50.8 | 4.3 |
| – Net Position: | -9,095 | 7,799 | 1,296 |
| – Gross Longs: | 63,483 | 130,734 | 11,672 |
| – Gross Shorts: | 72,578 | 122,935 | 10,376 |
| – Long to Short Ratio: | 0.9 to 1 | 1.1 to 1 | 1.1 to 1 |
| NET POSITION TREND: | |||
| – Strength Index Score (3 Year Range Pct): | 15.0 | 85.9 | 23.2 |
| – Strength Index Reading (3 Year Range): | Bearish-Extreme | Bullish-Extreme | Bearish |
| NET POSITION MOVEMENT INDEX: | |||
| – 6-Week Change in Strength Index: | -25.8 | 27.7 | -31.4 |
WHEAT Futures:
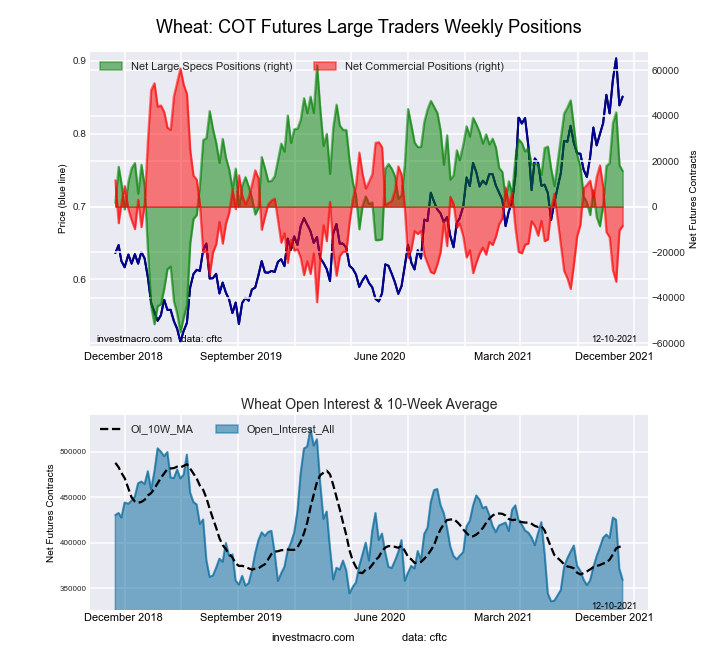 The WHEAT large speculator standing this week reached a net position of 15,667 contracts in the data reported through Tuesday. This was a weekly decrease of -2,627 contracts from the previous week which had a total of 18,294 net contracts.
This week’s current strength score (the trader positioning range over the past three years, measured from 0 to 100) shows the speculators are currently Bullish with a score of 60.4 percent. The commercials are Bearish with a score of 32.7 percent and the small traders (not shown in chart) are Bullish with a score of 66.8 percent.
| WHEAT Futures Statistics | SPECULATORS | COMMERCIALS | SMALL TRADERS |
| – Percent of Open Interest Longs: | 31.2 | 35.5 | 9.2 |
| – Percent of Open Interest Shorts: | 26.8 | 37.8 | 11.3 |
| – Net Position: | 15,667 | -8,386 | -7,281 |
| – Gross Longs: | 111,973 | 127,435 | 33,159 |
| – Gross Shorts: | 96,306 | 135,821 | 40,440 |
| – Long to Short Ratio: | 1.2 to 1 | 0.9 to 1 | 0.8 to 1 |
| NET POSITION TREND: | |||
| – Strength Index Score (3 Year Range Pct): | 60.4 | 32.7 | 66.8 |
| – Strength Index Reading (3 Year Range): | Bullish | Bearish | Bullish |
| NET POSITION MOVEMENT INDEX: | |||
| – 6-Week Change in Strength Index: | 12.7 | -16.7 | 10.7 |
Article By InvestMacro – Receive our weekly COT Reports by Email
*COT Report: The COT data, released weekly to the public each Friday, is updated through the most recent Tuesday (data is 3 days old) and shows a quick view of how large speculators or non-commercials (for-profit traders) were positioned in the futures markets.
The CFTC categorizes trader positions according to commercial hedgers (traders who use futures contracts for hedging as part of the business), non-commercials (large traders who speculate to realize trading profits) and nonreportable traders (usually small traders/speculators) as well as their open interest (contracts open in the market at time of reporting).See CFTC criteria here.

- The Tech‑heavy NASDAQ Index jumped by more than 3.3%. The offshore yuan is trading at its highest level since 2023 Jul 31, 2026
- USD/JPY After Volatility: Multiple Events in One Day Jul 31, 2026
- The US indices sell off amid renewed US-Iran clashes. Oil jumps by 7% Jul 30, 2026
- USD/JPY Temporary in Equilibrium: Multiple Factors in Focus Jul 30, 2026
- GBP/USD at Month’s Lows: The Outlook Remains Weak Jul 29, 2026
- Crude oil falls below $80 per barrel. Australia sees inflation slowdown Jul 29, 2026
- The US Tech sector hit by sell‑off. Oil prices decline on renewed negotiations Jul 28, 2026
- Gold Declines, Focus on Fed and Falling Oil Prices Jul 28, 2026
- This week will be one of the most crowded for central‑bank meetings Jul 27, 2026
- EUR/USD Ahead of a Key Week: Holding Near Lows Jul 27, 2026