
By InvestMacro | COT | Data Tables | COT Leaders | Downloads | COT Newsletter
Here are the latest charts and statistics for the Commitment of Traders (COT) data published by the Commodities Futures Trading Commission (CFTC).
The latest COT data is updated through Tuesday December 7th 2021 and shows a quick view of how large traders (for-profit speculators and commercial entities) were positioned in the futures markets.
Highlighting this week’s COT metals data is the recent decline in the Silver futures bets. The speculative net position in the Silver futures has fallen for three consecutive weeks and by a total of -15,792 contracts over that time-frame. This weakness has brought the current standing for Silver net positions to the least bullish level in the past eight weeks, dating back to October 12th. Speculators had been raising their positions for Silver in recent months with bullish bets hitting a 22-week high on November 16th before turning lower. Despite the recent declines, the Silver strength index (current positioning compared to the positioning of the past three years) remains almost right down the middle at a 52.1 percent score.
Joining Silver (-8,601 contracts) in falling this week are Gold (-8,675 contracts), Copper (-1,987 contracts), Platinum (-2,886 contracts) while the Palladium (242 contracts) were the only rising futures contracts for speculators this week in the metals we cover.
| Dec-07-2021 | OI | OI-Index | Spec-Net | Spec-Index | Com-Net | COM-Index | Smalls-Net | Smalls-Index |
|---|---|---|---|---|---|---|---|---|
| WTI Crude | 1,972,536 | 3 | 367,232 | 29 | -400,431 | 62 | 33,199 | 62 |
| Gold | 499,307 | 23 | 217,185 | 57 | -245,623 | 43 | 28,438 | 45 |
| Silver | 136,572 | 4 | 29,833 | 52 | -43,148 | 57 | 13,315 | 17 |
| Copper | 173,954 | 8 | 7,204 | 48 | -14,219 | 50 | 7,015 | 66 |
| Palladium | 9,253 | 12 | -2,731 | 4 | 3,036 | 97 | -305 | 27 |
| Platinum | 65,134 | 30 | 6,062 | 11 | -12,138 | 92 | 6,076 | 47 |
| Natural Gas | 1,205,626 | 20 | -132,443 | 39 | 99,372 | 62 | 33,071 | 63 |
| Brent | 211,254 | 48 | -20,446 | 84 | 17,107 | 17 | 3,339 | 55 |
| Heating Oil | 298,997 | 0 | 8,597 | 55 | -21,351 | 49 | 12,754 | 43 |
| Soybeans | 672,116 | 15 | 59,654 | 45 | -22,744 | 60 | -36,910 | 10 |
| Corn | 1,430,401 | 9 | 410,814 | 83 | -367,873 | 20 | -42,941 | 18 |
| Coffee | 265,046 | 33 | 62,344 | 94 | -65,596 | 8 | 3,252 | 11 |
| Sugar | 857,621 | 8 | 191,239 | 76 | -221,289 | 26 | 30,050 | 45 |
| Wheat | 359,186 | 12 | 15,667 | 60 | -8,386 | 33 | -7,281 | 67 |
Free Reports:
 Sign Up for Our Stock Market Newsletter – Get updated on News, Charts & Rankings of Public Companies when you join our Stocks Newsletter
 Get our Weekly Commitment of Traders Reports - See where the biggest traders (Hedge Funds and Commercial Hedgers) are positioned in the futures markets on a weekly basis.
Gold Comex Futures:
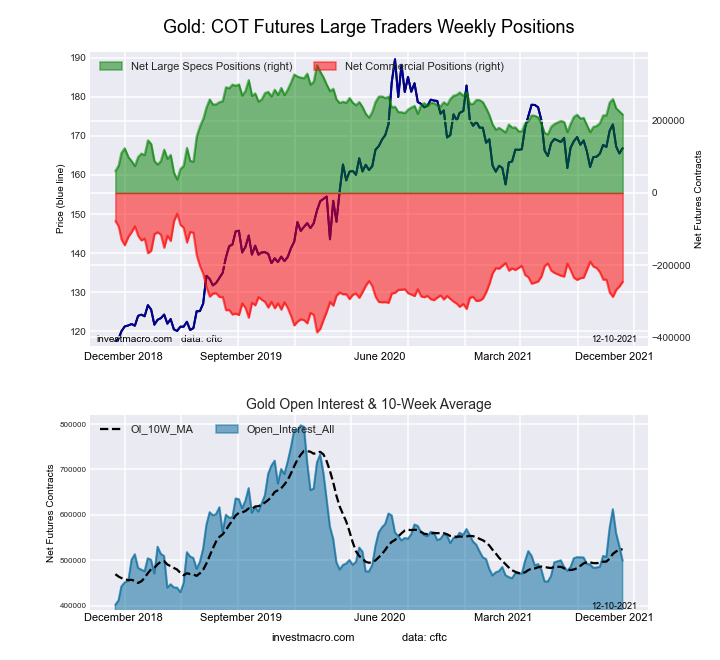 The Gold Comex Futures large speculator standing this week totaled a net position of 217,185 contracts in the data reported through Tuesday. This was a weekly lowering of -8,675 contracts from the previous week which had a total of 225,860 net contracts.
This week’s current strength score (the trader positioning range over the past three years, measured from 0 to 100) shows the speculators are currently Bullish with a score of 56.8 percent. The commercials are Bearish with a score of 42.7 percent and the small traders (not shown in chart) are Bearish with a score of 44.9 percent.
| Gold Futures Statistics | SPECULATORS | COMMERCIALS | SMALL TRADERS |
| – Percent of Open Interest Longs: | 60.2 | 20.8 | 9.5 |
| – Percent of Open Interest Shorts: | 16.7 | 70.0 | 3.8 |
| – Net Position: | 217,185 | -245,623 | 28,438 |
| – Gross Longs: | 300,518 | 103,942 | 47,358 |
| – Gross Shorts: | 83,333 | 349,565 | 18,920 |
| – Long to Short Ratio: | 3.6 to 1 | 0.3 to 1 | 2.5 to 1 |
| NET POSITION TREND: | |||
| – Strength Index Score (3 Year Range Pct): | 56.8 | 42.7 | 44.9 |
| – Strength Index Reading (3 Year Range): | Bullish | Bearish | Bearish |
| NET POSITION MOVEMENT INDEX: | |||
| – 6-Week Change in Strength Index: | 0.8 | -1.8 | 9.5 |
Silver Comex Futures:
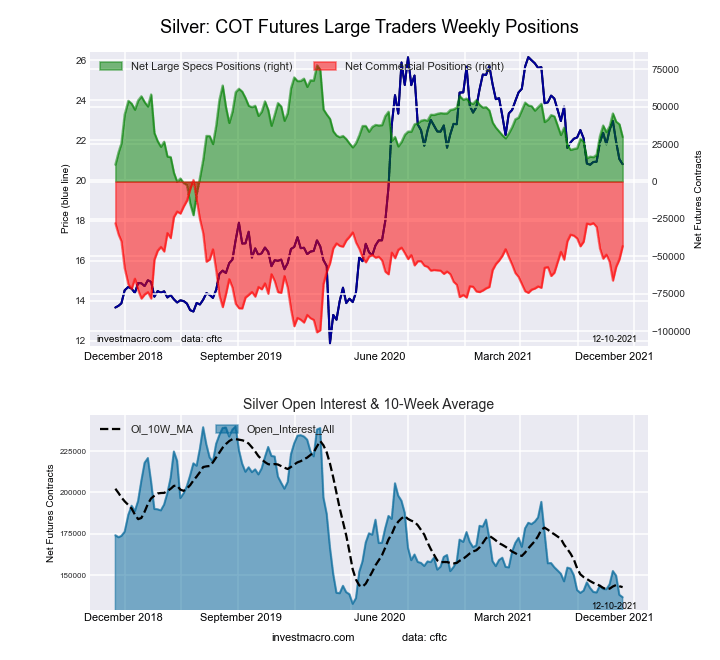 The Silver Comex Futures large speculator standing this week totaled a net position of 29,833 contracts in the data reported through Tuesday. This was a weekly reduction of -8,601 contracts from the previous week which had a total of 38,434 net contracts.
This week’s current strength score (the trader positioning range over the past three years, measured from 0 to 100) shows the speculators are currently Bullish with a score of 52.1 percent. The commercials are Bullish with a score of 56.6 percent and the small traders (not shown in chart) are Bearish-Extreme with a score of 17.5 percent.
| Silver Futures Statistics | SPECULATORS | COMMERCIALS | SMALL TRADERS |
| – Percent of Open Interest Longs: | 46.1 | 28.8 | 19.3 |
| – Percent of Open Interest Shorts: | 24.2 | 60.4 | 9.5 |
| – Net Position: | 29,833 | -43,148 | 13,315 |
| – Gross Longs: | 62,930 | 39,369 | 26,328 |
| – Gross Shorts: | 33,097 | 82,517 | 13,013 |
| – Long to Short Ratio: | 1.9 to 1 | 0.5 to 1 | 2.0 to 1 |
| NET POSITION TREND: | |||
| – Strength Index Score (3 Year Range Pct): | 52.1 | 56.6 | 17.5 |
| – Strength Index Reading (3 Year Range): | Bullish | Bullish | Bearish-Extreme |
| NET POSITION MOVEMENT INDEX: | |||
| – 6-Week Change in Strength Index: | -7.7 | 8.2 | -4.0 |
Copper Grade #1 Futures:
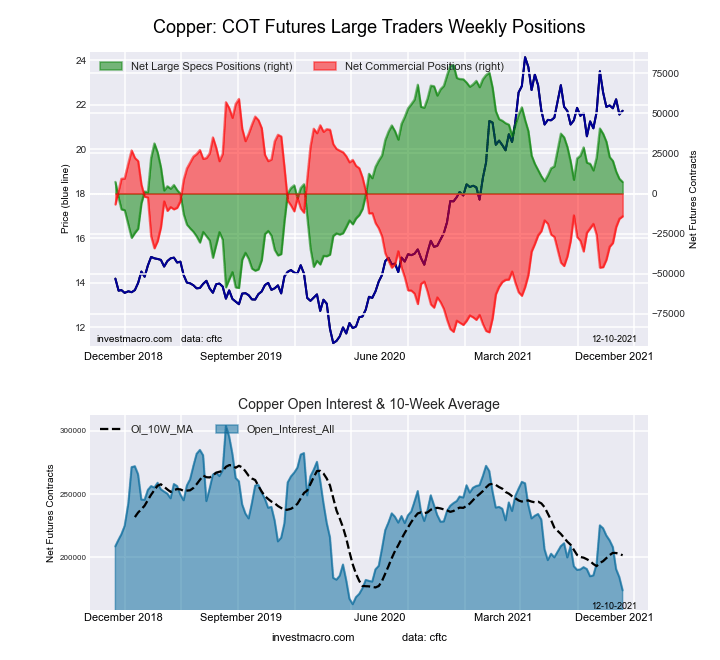 The Copper Grade #1 Futures large speculator standing this week totaled a net position of 7,204 contracts in the data reported through Tuesday. This was a weekly fall of -1,987 contracts from the previous week which had a total of 9,191 net contracts.
This week’s current strength score (the trader positioning range over the past three years, measured from 0 to 100) shows the speculators are currently Bearish with a score of 47.6 percent. The commercials are Bearish with a score of 49.7 percent and the small traders (not shown in chart) are Bullish with a score of 65.9 percent.
| Copper Futures Statistics | SPECULATORS | COMMERCIALS | SMALL TRADERS |
| – Percent of Open Interest Longs: | 36.4 | 43.9 | 9.7 |
| – Percent of Open Interest Shorts: | 32.3 | 52.1 | 5.6 |
| – Net Position: | 7,204 | -14,219 | 7,015 |
| – Gross Longs: | 63,403 | 76,370 | 16,787 |
| – Gross Shorts: | 56,199 | 90,589 | 9,772 |
| – Long to Short Ratio: | 1.1 to 1 | 0.8 to 1 | 1.7 to 1 |
| NET POSITION TREND: | |||
| – Strength Index Score (3 Year Range Pct): | 47.6 | 49.7 | 65.9 |
| – Strength Index Reading (3 Year Range): | Bearish | Bearish | Bullish |
| NET POSITION MOVEMENT INDEX: | |||
| – 6-Week Change in Strength Index: | -21.7 | 21.8 | -9.1 |
Platinum Futures:
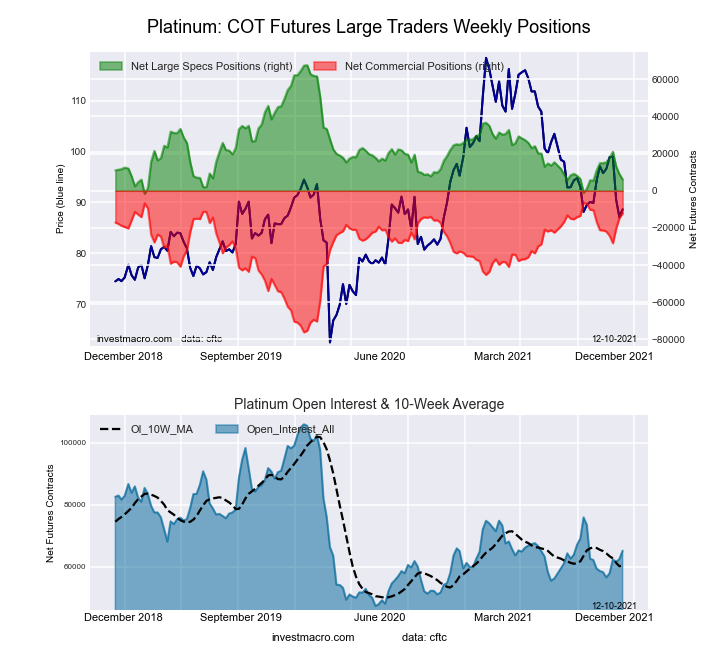 The Platinum Futures large speculator standing this week totaled a net position of 6,062 contracts in the data reported through Tuesday. This was a weekly lowering of -2,886 contracts from the previous week which had a total of 8,948 net contracts.
This week’s current strength score (the trader positioning range over the past three years, measured from 0 to 100) shows the speculators are currently Bearish-Extreme with a score of 11.1 percent. The commercials are Bullish-Extreme with a score of 91.7 percent and the small traders (not shown in chart) are Bearish with a score of 46.8 percent.
| Platinum Futures Statistics | SPECULATORS | COMMERCIALS | SMALL TRADERS |
| – Percent of Open Interest Longs: | 41.5 | 38.0 | 14.7 |
| – Percent of Open Interest Shorts: | 32.2 | 56.7 | 5.4 |
| – Net Position: | 6,062 | -12,138 | 6,076 |
| – Gross Longs: | 27,056 | 24,780 | 9,598 |
| – Gross Shorts: | 20,994 | 36,918 | 3,522 |
| – Long to Short Ratio: | 1.3 to 1 | 0.7 to 1 | 2.7 to 1 |
| NET POSITION TREND: | |||
| – Strength Index Score (3 Year Range Pct): | 11.1 | 91.7 | 46.8 |
| – Strength Index Reading (3 Year Range): | Bearish-Extreme | Bullish-Extreme | Bearish |
| NET POSITION MOVEMENT INDEX: | |||
| – 6-Week Change in Strength Index: | -12.8 | 13.1 | -4.2 |
Palladium Futures:
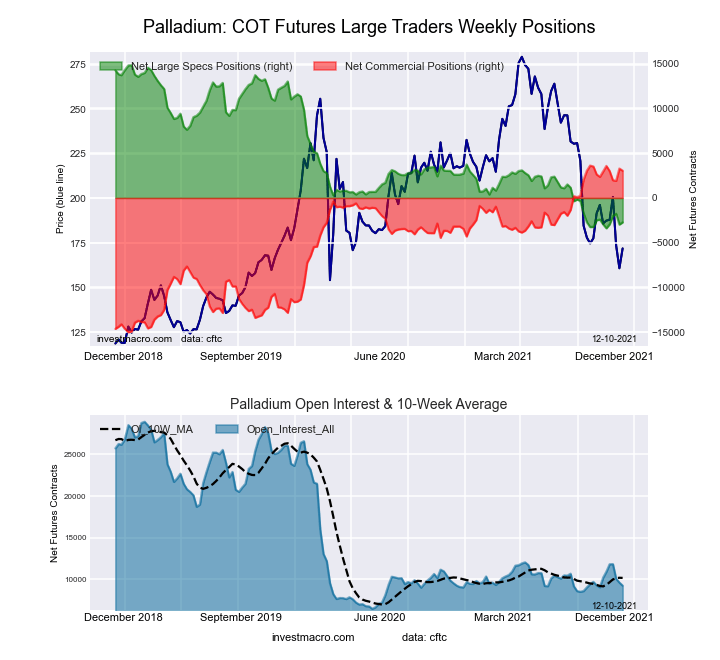 The Palladium Futures large speculator standing this week totaled a net position of -2,731 contracts in the data reported through Tuesday. This was a weekly boost of 242 contracts from the previous week which had a total of -2,973 net contracts.
This week’s current strength score (the trader positioning range over the past three years, measured from 0 to 100) shows the speculators are currently Bearish-Extreme with a score of 3.6 percent. The commercials are Bullish-Extreme with a score of 96.9 percent and the small traders (not shown in chart) are Bearish with a score of 26.7 percent.
| Palladium Futures Statistics | SPECULATORS | COMMERCIALS | SMALL TRADERS |
| – Percent of Open Interest Longs: | 30.9 | 54.3 | 12.7 |
| – Percent of Open Interest Shorts: | 60.4 | 21.5 | 16.0 |
| – Net Position: | -2,731 | 3,036 | -305 |
| – Gross Longs: | 2,862 | 5,024 | 1,175 |
| – Gross Shorts: | 5,593 | 1,988 | 1,480 |
| – Long to Short Ratio: | 0.5 to 1 | 2.5 to 1 | 0.8 to 1 |
| NET POSITION TREND: | |||
| – Strength Index Score (3 Year Range Pct): | 3.6 | 96.9 | 26.7 |
| – Strength Index Reading (3 Year Range): | Bearish-Extreme | Bullish-Extreme | Bearish |
| NET POSITION MOVEMENT INDEX: | |||
| – 6-Week Change in Strength Index: | 1.2 | 0.4 | -17.5 |
Article By InvestMacro – Receive our weekly COT Reports by Email
*COT Report: The COT data, released weekly to the public each Friday, is updated through the most recent Tuesday (data is 3 days old) and shows a quick view of how large speculators or non-commercials (for-profit traders) were positioned in the futures markets.
The CFTC categorizes trader positions according to commercial hedgers (traders who use futures contracts for hedging as part of the business), non-commercials (large traders who speculate to realize trading profits) and nonreportable traders (usually small traders/speculators) as well as their open interest (contracts open in the market at time of reporting).See CFTC criteria here.

- COT Metals Charts: Weekly Speculator Bets see small gains for Silver & Gold Jul 12, 2026
- COT Bonds Charts: Speculator Bets led by SOFR 3-Months & 2-Year Bonds Jul 12, 2026
- COT Energy Charts: Weekly Speculator Changes led by Brent Oil Jul 12, 2026
- COT Soft Commodities Charts: Weekly Speculator Changes led by Sugar, Corn & Soybeans Jul 12, 2026
- The US and European stock indices are rising again amid renewed investor interest in the AI industry. Jul 10, 2026
- USD/JPY Falls as Yen Recovers Weekly Losses Jul 10, 2026
- Crude oil prices surged sharply by 7% in reaction to the rapid escalation of the conflict in the Middle East Jul 9, 2026
- Middle East Tensions Weigh on Gold Jul 9, 2026
- Pound Awaits Tighter Policy from Bank of England Jul 8, 2026
- The United States carried out airstrikes on Iran after Iran’s attacked tankers in the Strait of Hormuz. The RBNZ raised the interest rate to 2.5% Jul 8, 2026