
By InvestMacro | COT | Data Tables | COT Leaders | Downloads | COT Newsletter
Here are the latest charts and statistics for the Commitment of Traders (COT) data published by the Commodities Futures Trading Commission (CFTC).
The latest COT data is updated through Tuesday December 7th 2021 and shows a quick view of how large traders (for-profit speculators and commercial entities) were positioned in the futures markets.
Highlighting this week’s COT stock market data is the continued cool off in the VIX Volatility futures bearish bets. The speculative net position in the VIX futures saw bearish bets fall by 13,751 contracts this week following a 20,782 contract improvement in positions last week.
The stock markets that saw higher speculator bets this week were VIX (13,751 contracts), Dow Jones Industrial Average Mini (2,283 contracts) and the Russell 2000 Mini (4,140 contracts).
The markets with lower speculator bets this week were S&P500 Mini (-14,329 contracts), Nasdaq Mini (-8,155 contracts), Nikkei 225 USD (-557 contracts), MSCI EAFE Min (-2,227 contracts), MSCI Emerging Markets Mini (-2,219 contracts).
Free Reports:
 Get our Weekly Commitment of Traders Reports - See where the biggest traders (Hedge Funds and Commercial Hedgers) are positioned in the futures markets on a weekly basis.
 Download Our Metatrader 4 Indicators – Put Our Free MetaTrader 4 Custom Indicators on your charts when you join our Weekly Newsletter
| Dec-07-2021 | OI | OI-Index | Spec-Net | Spec-Index | Com-Net | COM-Index | Smalls-Net | Smalls-Index |
|---|---|---|---|---|---|---|---|---|
| S&P500-Mini | 2,514,383 | 6 | 165,396 | 91 | -182,926 | 33 | 17,530 | 30 |
| Nikkei 225 | 25,848 | 33 | 1,211 | 62 | -3,259 | 41 | 2,048 | 53 |
| Nasdaq-Mini | 251,880 | 43 | 25,778 | 89 | -24,885 | 11 | -893 | 42 |
| DowJones-Mini | 103,059 | 74 | -4,553 | 30 | 3,180 | 66 | 1,373 | 46 |
| VIX | 300,082 | 27 | -47,403 | 65 | 55,699 | 37 | -8,296 | 25 |
| Nikkei 225 Yen | 61,968 | 46 | -2,432 | 16 | 25,719 | 94 | -23,287 | 34 |
VIX Volatility Futures:
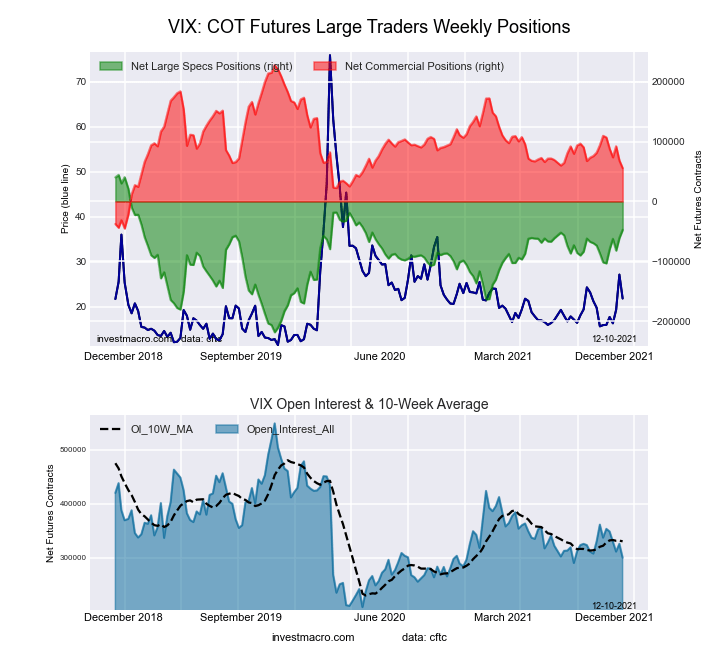 The VIX Volatility large speculator standing this week equaled a net position of -47,403 contracts in the data reported through Tuesday. This was a weekly gain of 13,751 contracts from the previous week which had a total of -61,154 net contracts.
This week’s current strength score (the trader positioning range over the past three years, measured from 0 to 100) shows the speculators are currently Bullish with a score of 65.1 percent. The commercials are Bearish with a score of 37.0 percent and the small traders (not shown in chart) are Bearish with a score of 24.9 percent.
| VIX Volatility Futures Statistics | SPECULATORS | COMMERCIALS | SMALL TRADERS |
| – Percent of Open Interest Longs: | 24.3 | 46.6 | 6.5 |
| – Percent of Open Interest Shorts: | 40.1 | 28.1 | 9.3 |
| – Net Position: | -47,403 | 55,699 | -8,296 |
| – Gross Longs: | 72,815 | 139,911 | 19,632 |
| – Gross Shorts: | 120,218 | 84,212 | 27,928 |
| – Long to Short Ratio: | 0.6 to 1 | 1.7 to 1 | 0.7 to 1 |
| NET POSITION TREND: | |||
| – Strength Index Score (3 Year Range Pct): | 65.1 | 37.0 | 24.9 |
| – Strength Index Reading (3 Year Range): | Bullish | Bearish | Bearish |
| NET POSITION MOVEMENT INDEX: | |||
| – 6-Week Change in Strength Index: | 20.6 | -19.7 | -1.4 |
S&P500 Mini Futures:
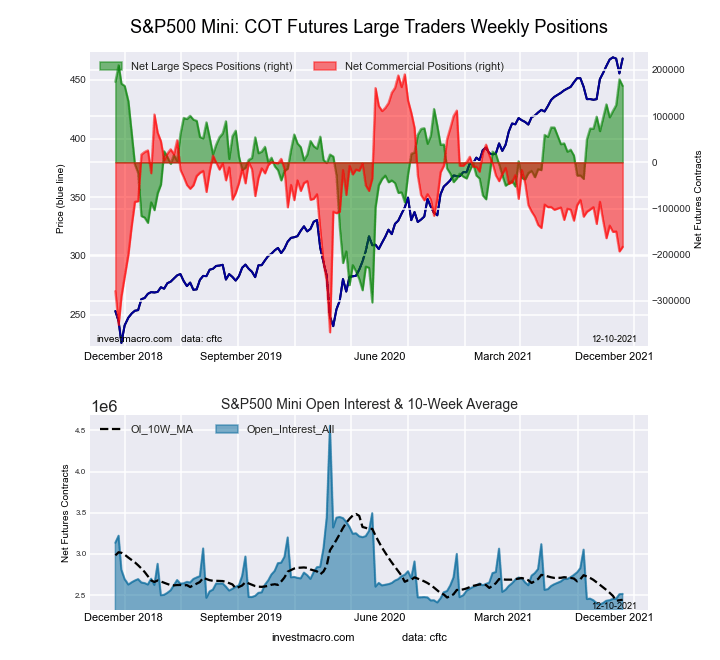 The S&P500 Mini large speculator standing this week equaled a net position of 165,396 contracts in the data reported through Tuesday. This was a weekly reduction of -14,329 contracts from the previous week which had a total of 179,725 net contracts.
This week’s current strength score (the trader positioning range over the past three years, measured from 0 to 100) shows the speculators are currently Bullish-Extreme with a score of 91.3 percent. The commercials are Bearish with a score of 33.1 percent and the small traders (not shown in chart) are Bearish with a score of 30.0 percent.
| S&P500 Mini Futures Statistics | SPECULATORS | COMMERCIALS | SMALL TRADERS |
| – Percent of Open Interest Longs: | 17.4 | 69.0 | 10.5 |
| – Percent of Open Interest Shorts: | 10.8 | 76.3 | 9.8 |
| – Net Position: | 165,396 | -182,926 | 17,530 |
| – Gross Longs: | 437,939 | 1,734,746 | 263,698 |
| – Gross Shorts: | 272,543 | 1,917,672 | 246,168 |
| – Long to Short Ratio: | 1.6 to 1 | 0.9 to 1 | 1.1 to 1 |
| NET POSITION TREND: | |||
| – Strength Index Score (3 Year Range Pct): | 91.3 | 33.1 | 30.0 |
| – Strength Index Reading (3 Year Range): | Bullish-Extreme | Bearish | Bearish |
| NET POSITION MOVEMENT INDEX: | |||
| – 6-Week Change in Strength Index: | 13.4 | -10.1 | -2.6 |
Dow Jones Mini Futures:
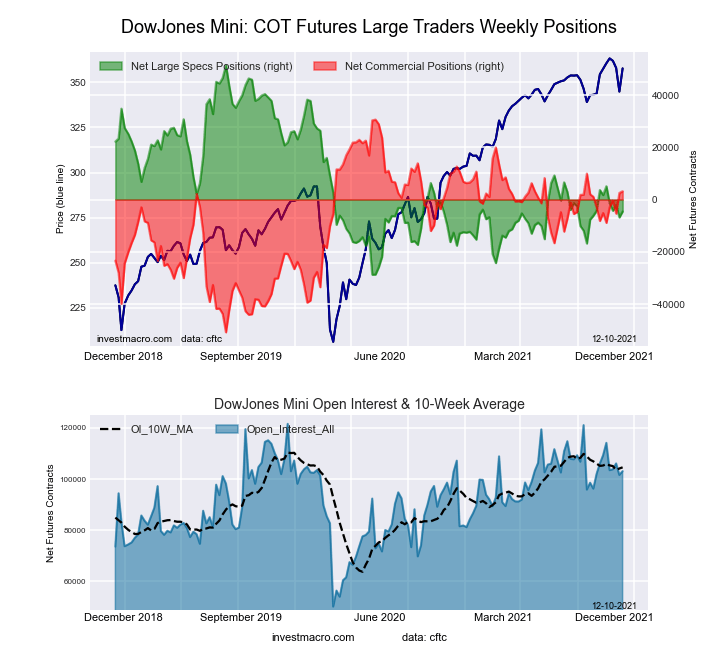 The Dow Jones Mini large speculator standing this week equaled a net position of -4,553 contracts in the data reported through Tuesday. This was a weekly rise of 2,283 contracts from the previous week which had a total of -6,836 net contracts.
This week’s current strength score (the trader positioning range over the past three years, measured from 0 to 100) shows the speculators are currently Bearish with a score of 30.2 percent. The commercials are Bullish with a score of 66.3 percent and the small traders (not shown in chart) are Bearish with a score of 45.8 percent.
| Dow Jones Mini Futures Statistics | SPECULATORS | COMMERCIALS | SMALL TRADERS |
| – Percent of Open Interest Longs: | 36.6 | 47.2 | 15.8 |
| – Percent of Open Interest Shorts: | 41.0 | 44.1 | 14.5 |
| – Net Position: | -4,553 | 3,180 | 1,373 |
| – Gross Longs: | 37,728 | 48,612 | 16,285 |
| – Gross Shorts: | 42,281 | 45,432 | 14,912 |
| – Long to Short Ratio: | 0.9 to 1 | 1.1 to 1 | 1.1 to 1 |
| NET POSITION TREND: | |||
| – Strength Index Score (3 Year Range Pct): | 30.2 | 66.3 | 45.8 |
| – Strength Index Reading (3 Year Range): | Bearish | Bullish | Bearish |
| NET POSITION MOVEMENT INDEX: | |||
| – 6-Week Change in Strength Index: | -7.8 | 10.3 | -11.1 |
Nasdaq Mini Futures:
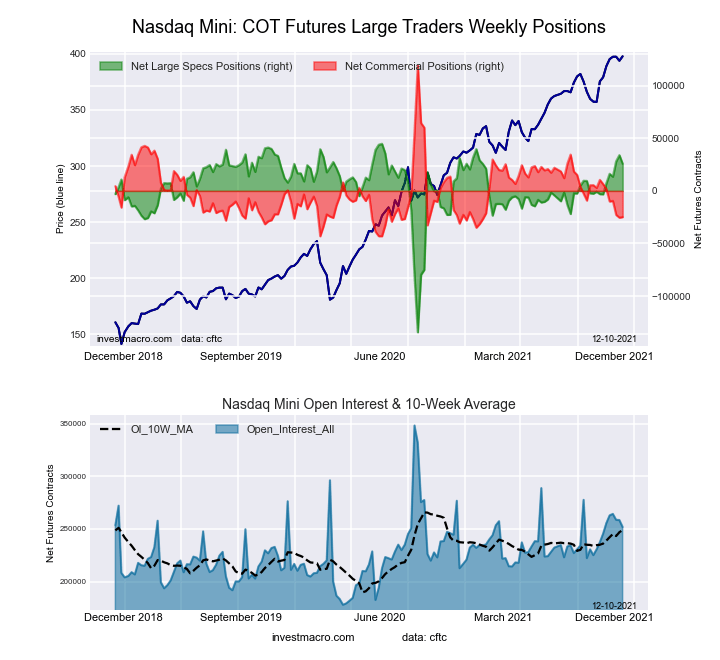 The Nasdaq Mini large speculator standing this week equaled a net position of 25,778 contracts in the data reported through Tuesday. This was a weekly fall of -8,155 contracts from the previous week which had a total of 33,933 net contracts.
This week’s current strength score (the trader positioning range over the past three years, measured from 0 to 100) shows the speculators are currently Bullish-Extreme with a score of 89.4 percent. The commercials are Bearish-Extreme with a score of 11.2 percent and the small traders (not shown in chart) are Bearish with a score of 42.0 percent.
| Nasdaq Mini Futures Statistics | SPECULATORS | COMMERCIALS | SMALL TRADERS |
| – Percent of Open Interest Longs: | 32.0 | 49.4 | 16.1 |
| – Percent of Open Interest Shorts: | 21.8 | 59.3 | 16.4 |
| – Net Position: | 25,778 | -24,885 | -893 |
| – Gross Longs: | 80,716 | 124,386 | 40,430 |
| – Gross Shorts: | 54,938 | 149,271 | 41,323 |
| – Long to Short Ratio: | 1.5 to 1 | 0.8 to 1 | 1.0 to 1 |
| NET POSITION TREND: | |||
| – Strength Index Score (3 Year Range Pct): | 89.4 | 11.2 | 42.0 |
| – Strength Index Reading (3 Year Range): | Bullish-Extreme | Bearish-Extreme | Bearish |
| NET POSITION MOVEMENT INDEX: | |||
| – 6-Week Change in Strength Index: | 16.2 | -19.3 | 5.1 |
Russell 2000 Mini Futures:
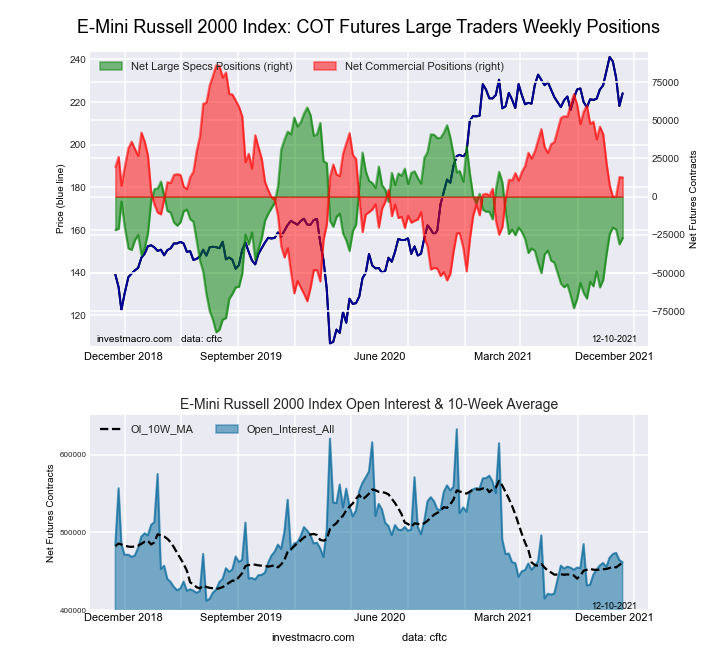 The Russell 2000 Mini large speculator standing this week equaled a net position of -27,001 contracts in the data reported through Tuesday. This was a weekly advance of 4,140 contracts from the previous week which had a total of -31,141 net contracts.
This week’s current strength score (the trader positioning range over the past three years, measured from 0 to 100) shows the speculators are currently Bearish with a score of 42.0 percent. The commercials are Bullish with a score of 52.5 percent and the small traders (not shown in chart) are Bullish with a score of 73.4 percent.
| Russell 2000 Mini Futures Statistics | SPECULATORS | COMMERCIALS | SMALL TRADERS |
| – Percent of Open Interest Longs: | 12.9 | 77.9 | 7.5 |
| – Percent of Open Interest Shorts: | 18.8 | 75.2 | 4.4 |
| – Net Position: | -27,001 | 12,683 | 14,318 |
| – Gross Longs: | 59,732 | 359,571 | 34,544 |
| – Gross Shorts: | 86,733 | 346,888 | 20,226 |
| – Long to Short Ratio: | 0.7 to 1 | 1.0 to 1 | 1.7 to 1 |
| NET POSITION TREND: | |||
| – Strength Index Score (3 Year Range Pct): | 42.0 | 52.5 | 73.4 |
| – Strength Index Reading (3 Year Range): | Bearish | Bullish | Bullish |
| NET POSITION MOVEMENT INDEX: | |||
| – 6-Week Change in Strength Index: | 18.7 | -18.3 | 2.2 |
Nikkei Stock Average (USD) Futures:
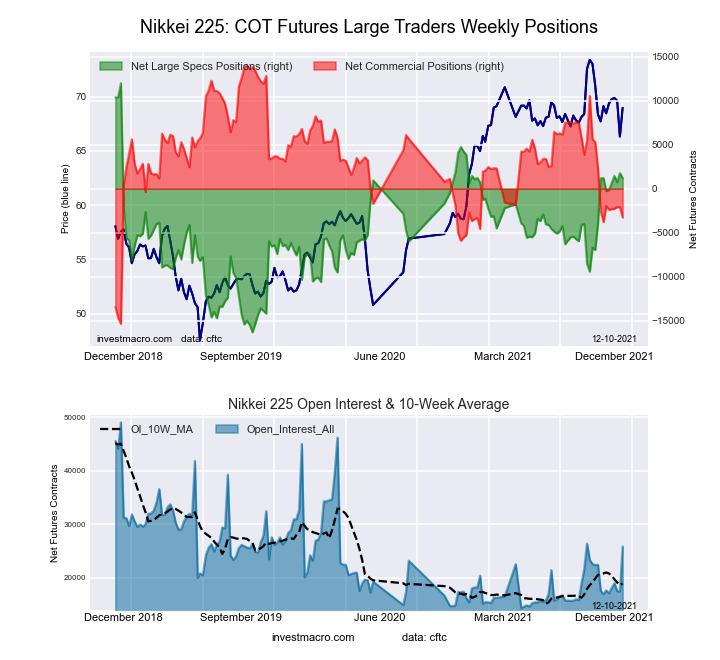 The Nikkei Stock Average (USD) large speculator standing this week equaled a net position of 1,211 contracts in the data reported through Tuesday. This was a weekly decrease of -557 contracts from the previous week which had a total of 1,768 net contracts.
This week’s current strength score (the trader positioning range over the past three years, measured from 0 to 100) shows the speculators are currently Bullish with a score of 61.9 percent. The commercials are Bearish with a score of 41.1 percent and the small traders (not shown in chart) are Bullish with a score of 53.1 percent.
| Nikkei Stock Average Futures Statistics | SPECULATORS | COMMERCIALS | SMALL TRADERS |
| – Percent of Open Interest Longs: | 15.3 | 37.9 | 23.2 |
| – Percent of Open Interest Shorts: | 10.6 | 50.5 | 15.2 |
| – Net Position: | 1,211 | -3,259 | 2,048 |
| – Gross Longs: | 3,959 | 9,791 | 5,984 |
| – Gross Shorts: | 2,748 | 13,050 | 3,936 |
| – Long to Short Ratio: | 1.4 to 1 | 0.8 to 1 | 1.5 to 1 |
| NET POSITION TREND: | |||
| – Strength Index Score (3 Year Range Pct): | 61.9 | 41.1 | 53.1 |
| – Strength Index Reading (3 Year Range): | Bullish | Bearish | Bullish |
| NET POSITION MOVEMENT INDEX: | |||
| – 6-Week Change in Strength Index: | 5.2 | -4.4 | -2.2 |
MSCI EAFE Mini Futures:
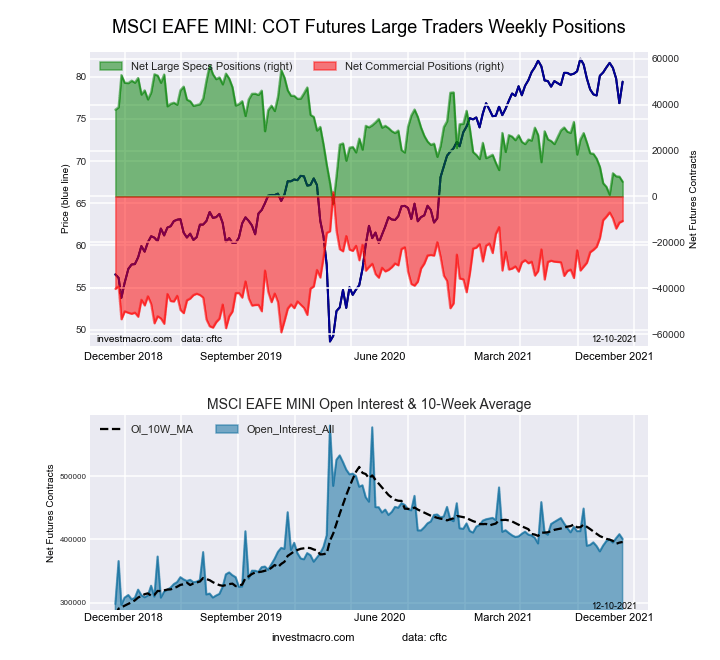 The MSCI EAFE Mini large speculator standing this week equaled a net position of 6,409 contracts in the data reported through Tuesday. This was a weekly lowering of -2,227 contracts from the previous week which had a total of 8,636 net contracts.
This week’s current strength score (the trader positioning range over the past three years, measured from 0 to 100) shows the speculators are currently Bearish-Extreme with a score of 16.2 percent. The commercials are Bullish with a score of 79.4 percent and the small traders (not shown in chart) are Bullish with a score of 54.9 percent.
| MSCI EAFE Mini Futures Statistics | SPECULATORS | COMMERCIALS | SMALL TRADERS |
| – Percent of Open Interest Longs: | 6.6 | 90.5 | 2.5 |
| – Percent of Open Interest Shorts: | 5.0 | 93.2 | 1.4 |
| – Net Position: | 6,409 | -10,709 | 4,300 |
| – Gross Longs: | 26,370 | 362,582 | 10,038 |
| – Gross Shorts: | 19,961 | 373,291 | 5,738 |
| – Long to Short Ratio: | 1.3 to 1 | 1.0 to 1 | 1.7 to 1 |
| NET POSITION TREND: | |||
| – Strength Index Score (3 Year Range Pct): | 16.2 | 79.4 | 54.9 |
| – Strength Index Reading (3 Year Range): | Bearish-Extreme | Bullish | Bullish |
| NET POSITION MOVEMENT INDEX: | |||
| – 6-Week Change in Strength Index: | 1.0 | -0.6 | -2.4 |
Article By InvestMacro – Receive our weekly COT Reports by Email
*COT Report: The COT data, released weekly to the public each Friday, is updated through the most recent Tuesday (data is 3 days old) and shows a quick view of how large speculators or non-commercials (for-profit traders) were positioned in the futures markets.
The CFTC categorizes trader positions according to commercial hedgers (traders who use futures contracts for hedging as part of the business), non-commercials (large traders who speculate to realize trading profits) and nonreportable traders (usually small traders/speculators) as well as their open interest (contracts open in the market at time of reporting).See CFTC criteria here.

- The Tech‑heavy NASDAQ Index jumped by more than 3.3%. The offshore yuan is trading at its highest level since 2023 Jul 31, 2026
- USD/JPY After Volatility: Multiple Events in One Day Jul 31, 2026
- The US indices sell off amid renewed US-Iran clashes. Oil jumps by 7% Jul 30, 2026
- USD/JPY Temporary in Equilibrium: Multiple Factors in Focus Jul 30, 2026
- GBP/USD at Month’s Lows: The Outlook Remains Weak Jul 29, 2026
- Crude oil falls below $80 per barrel. Australia sees inflation slowdown Jul 29, 2026
- The US Tech sector hit by sell‑off. Oil prices decline on renewed negotiations Jul 28, 2026
- Gold Declines, Focus on Fed and Falling Oil Prices Jul 28, 2026
- This week will be one of the most crowded for central‑bank meetings Jul 27, 2026
- EUR/USD Ahead of a Key Week: Holding Near Lows Jul 27, 2026