
Here are the latest charts and statistics for the Commitment of Traders (COT) data published by the Commodities Futures Trading Commission (CFTC).
The latest COT data is updated through Tuesday November 30th 2021 and shows a quick view of how large traders (for-profit speculators and commercial entities) were positioned in the futures markets.
Highlighting this week’s COT bonds data is the 2-Year Bond speculators bets that rose for the fifth time in the past six weeks. Bond speculators have been improving their bets for the 2-Year steadily and have also pushed their bets higher for seven out of the past nine weeks and by a total of +78,499 contracts over that period. This improving sentiment has brought the current net position standing into a bullish level for the first time since August 17th, a span of fifteen weeks. The 2-Year Treasury Note is now one of the only two bond instruments (the other is the Ultra 10-Year U.S. T-Note) in our tracking that have bullish net positions at the moment.
| Nov-30-2021 | OI | OI-Index | Spec-Net | Spec-Index | Com-Net | COM-Index | Smalls-Net | Smalls-Index |
|---|---|---|---|---|---|---|---|---|
| Eurodollar | 12,207,541 | 59 | -1,121,656 | 28 | 1,568,222 | 71 | -446,566 | 28 |
| FedFunds | 1,426,038 | 33 | -98,478 | 27 | 114,396 | 74 | -15,918 | 31 |
| 2-Year | 1,789,196 | 1 | 15,670 | 96 | 35,095 | 24 | -50,765 | 4 |
| Long T-Bond | 1,219,181 | 52 | -49,640 | 76 | 29,588 | 30 | 20,052 | 68 |
| 10-Year | 3,803,125 | 51 | -313,371 | 24 | 567,638 | 93 | -254,267 | 19 |
| 5-Year | 3,486,538 | 21 | -367,832 | 16 | 614,453 | 97 | -246,621 | 13 |
3-Month Eurodollars Futures:
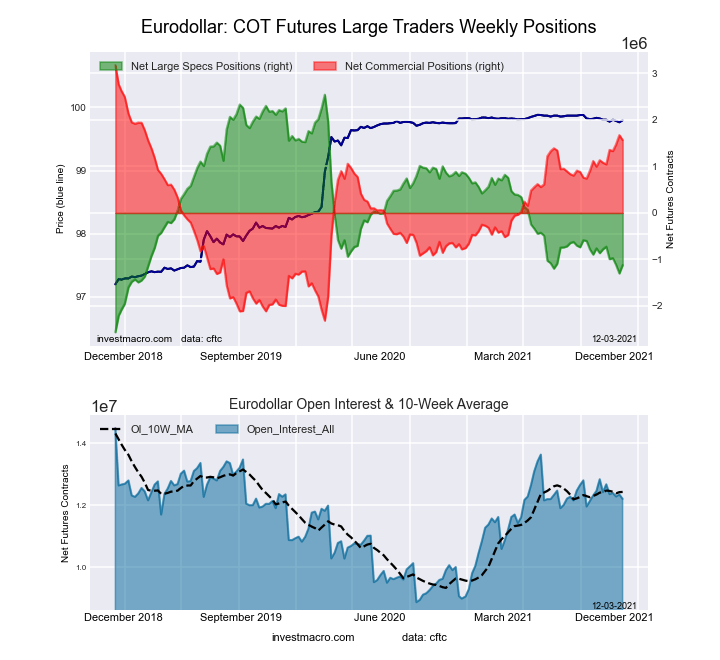 The 3-Month Eurodollars large speculator standing this week equaled a net position of -1,121,656 contracts in the data reported through Tuesday. This was a weekly rise of 178,825 contracts from the previous week which had a total of -1,300,481 net contracts.
This week’s current strength score (the trader positioning range over the past three years, measured from 0 to 100) shows the speculators are currently Bearish with a score of 28.3 percent. The commercials are Bullish with a score of 70.7 percent and the small traders (not shown in chart) are Bearish with a score of 27.9 percent.
Free Reports:
 Download Our Metatrader 4 Indicators – Put Our Free MetaTrader 4 Custom Indicators on your charts when you join our Weekly Newsletter
 Get our Weekly Commitment of Traders Reports - See where the biggest traders (Hedge Funds and Commercial Hedgers) are positioned in the futures markets on a weekly basis.
| 3-Month Eurodollars Statistics | SPECULATORS | COMMERCIALS | SMALL TRADERS |
| – Percent of Open Interest Longs: | 12.4 | 66.3 | 3.7 |
| – Percent of Open Interest Shorts: | 21.6 | 53.4 | 7.4 |
| – Net Position: | -1,121,656 | 1,568,222 | -446,566 |
| – Gross Longs: | 1,515,247 | 8,091,297 | 451,347 |
| – Gross Shorts: | 2,636,903 | 6,523,075 | 897,913 |
| – Long to Short Ratio: | 0.6 to 1 | 1.2 to 1 | 0.5 to 1 |
| NET POSITION TREND: | |||
| – COT Index Score (3 Year Range Pct): | 28.3 | 70.7 | 27.9 |
| – COT Index Reading (3 Year Range): | Bearish | Bullish | Bearish |
| NET POSITION MOVEMENT INDEX: | |||
| – 6-Week Change in Strength Index: | -6.7 | 8.9 | -24.9 |
30-Day Federal Funds Futures:
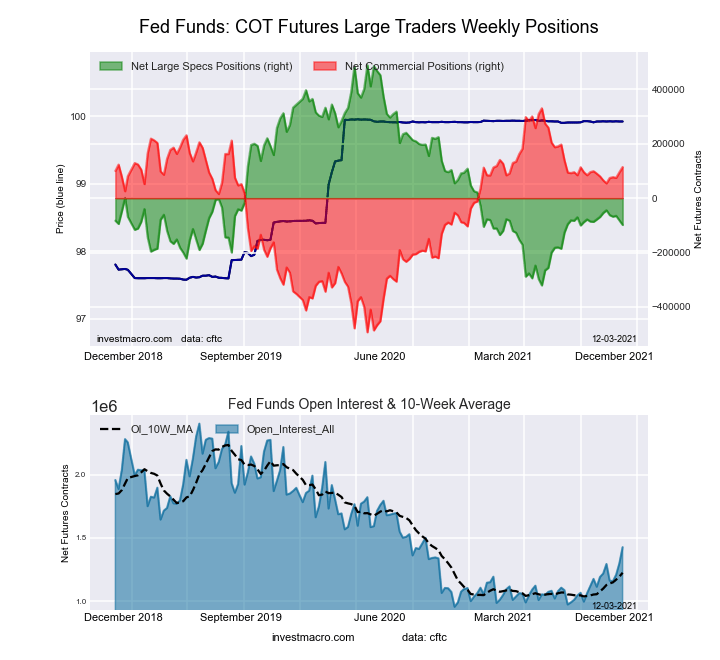 The 30-Day Federal Funds large speculator standing this week equaled a net position of -98,478 contracts in the data reported through Tuesday. This was a weekly decline of -16,473 contracts from the previous week which had a total of -82,005 net contracts.
This week’s current strength score (the trader positioning range over the past three years, measured from 0 to 100) shows the speculators are currently Bearish with a score of 27.5 percent. The commercials are Bullish with a score of 73.8 percent and the small traders (not shown in chart) are Bearish with a score of 30.8 percent.
| 30-Day Federal Funds Statistics | SPECULATORS | COMMERCIALS | SMALL TRADERS |
| – Percent of Open Interest Longs: | 3.7 | 81.6 | 1.3 |
| – Percent of Open Interest Shorts: | 10.6 | 73.6 | 2.4 |
| – Net Position: | -98,478 | 114,396 | -15,918 |
| – Gross Longs: | 52,431 | 1,163,989 | 18,288 |
| – Gross Shorts: | 150,909 | 1,049,593 | 34,206 |
| – Long to Short Ratio: | 0.3 to 1 | 1.1 to 1 | 0.5 to 1 |
| NET POSITION TREND: | |||
| – COT Index Score (3 Year Range Pct): | 27.5 | 73.8 | 30.8 |
| – COT Index Reading (3 Year Range): | Bearish | Bullish | Bearish |
| NET POSITION MOVEMENT INDEX: | |||
| – 6-Week Change in Strength Index: | -5.4 | 5.9 | -10.7 |
2-Year Treasury Note Futures:
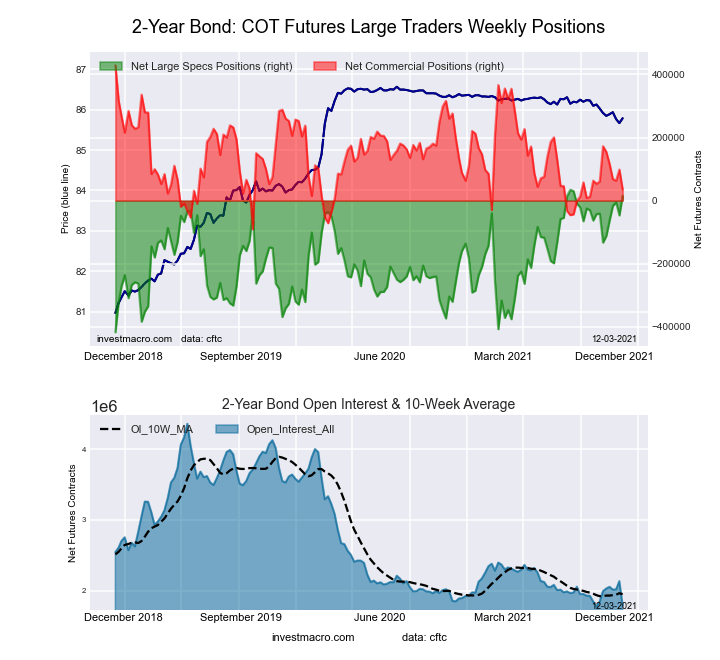 The 2-Year Treasury Note large speculator standing this week equaled a net position of 15,670 contracts in the data reported through Tuesday. This was a weekly increase of 62,290 contracts from the previous week which had a total of -46,620 net contracts.
This week’s current strength score (the trader positioning range over the past three years, measured from 0 to 100) shows the speculators are currently Bullish-Extreme with a score of 95.8 percent. The commercials are Bearish with a score of 24.2 percent and the small traders (not shown in chart) are Bearish-Extreme with a score of 4.0 percent.
| 2-Year Treasury Note Statistics | SPECULATORS | COMMERCIALS | SMALL TRADERS |
| – Percent of Open Interest Longs: | 16.2 | 73.0 | 7.0 |
| – Percent of Open Interest Shorts: | 15.3 | 71.0 | 9.9 |
| – Net Position: | 15,670 | 35,095 | -50,765 |
| – Gross Longs: | 289,388 | 1,306,141 | 125,667 |
| – Gross Shorts: | 273,718 | 1,271,046 | 176,432 |
| – Long to Short Ratio: | 1.1 to 1 | 1.0 to 1 | 0.7 to 1 |
| NET POSITION TREND: | |||
| – COT Index Score (3 Year Range Pct): | 95.8 | 24.2 | 4.0 |
| – COT Index Reading (3 Year Range): | Bullish-Extreme | Bearish | Bearish-Extreme |
| NET POSITION MOVEMENT INDEX: | |||
| – 6-Week Change in Strength Index: | 32.9 | -26.4 | -6.1 |
5-Year Treasury Note Futures:
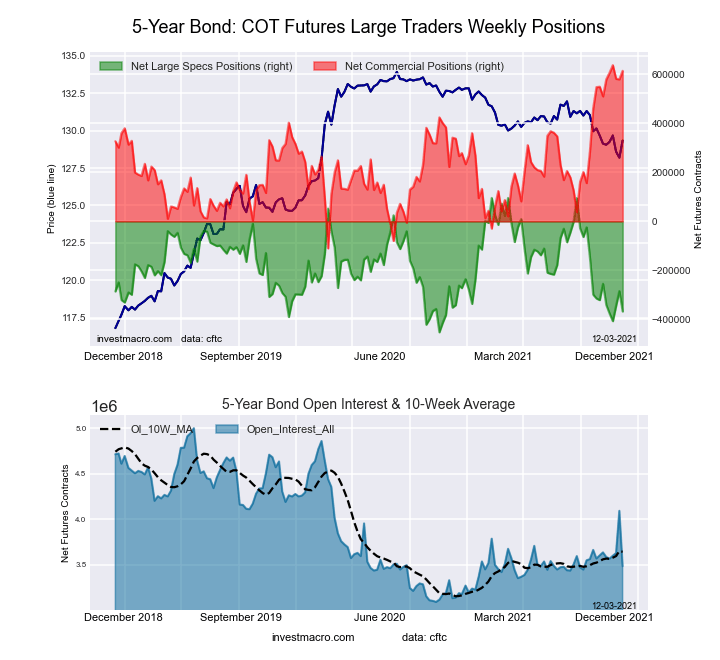 The 5-Year Treasury Note large speculator standing this week equaled a net position of -367,832 contracts in the data reported through Tuesday. This was a weekly reduction of -82,949 contracts from the previous week which had a total of -284,883 net contracts.
This week’s current strength score (the trader positioning range over the past three years, measured from 0 to 100) shows the speculators are currently Bearish-Extreme with a score of 15.5 percent. The commercials are Bullish-Extreme with a score of 96.9 percent and the small traders (not shown in chart) are Bearish-Extreme with a score of 13.3 percent.
| 5-Year Treasury Note Statistics | SPECULATORS | COMMERCIALS | SMALL TRADERS |
| – Percent of Open Interest Longs: | 7.0 | 82.0 | 7.4 |
| – Percent of Open Interest Shorts: | 17.6 | 64.4 | 14.5 |
| – Net Position: | -367,832 | 614,453 | -246,621 |
| – Gross Longs: | 244,895 | 2,859,429 | 258,648 |
| – Gross Shorts: | 612,727 | 2,244,976 | 505,269 |
| – Long to Short Ratio: | 0.4 to 1 | 1.3 to 1 | 0.5 to 1 |
| NET POSITION TREND: | |||
| – COT Index Score (3 Year Range Pct): | 15.5 | 96.9 | 13.3 |
| – COT Index Reading (3 Year Range): | Bearish-Extreme | Bullish-Extreme | Bearish-Extreme |
| NET POSITION MOVEMENT INDEX: | |||
| – 6-Week Change in Strength Index: | -20.5 | 13.9 | 2.3 |
10-Year Treasury Note Futures:
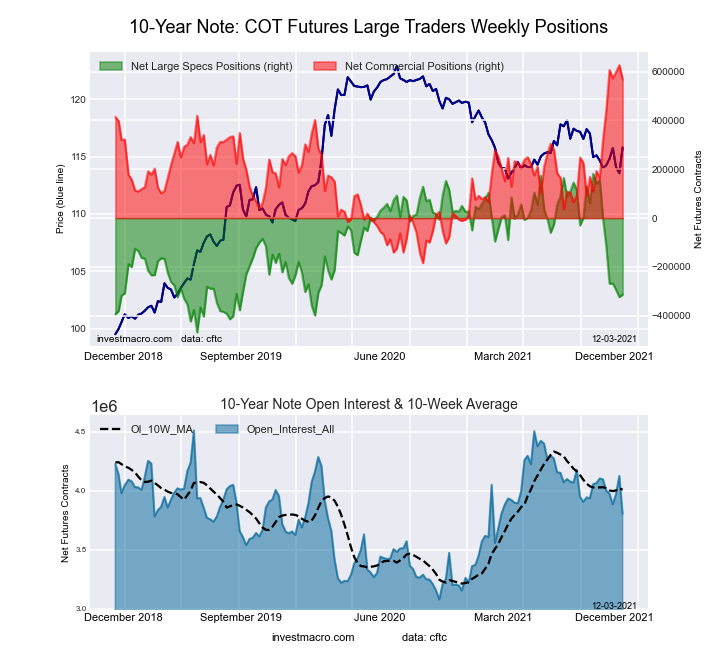 The 10-Year Treasury Note large speculator standing this week equaled a net position of -313,371 contracts in the data reported through Tuesday. This was a weekly rise of 10,044 contracts from the previous week which had a total of -323,415 net contracts.
This week’s current strength score (the trader positioning range over the past three years, measured from 0 to 100) shows the speculators are currently Bearish with a score of 23.8 percent. The commercials are Bullish-Extreme with a score of 92.8 percent and the small traders (not shown in chart) are Bearish-Extreme with a score of 19.5 percent.
| 10-Year Treasury Note Statistics | SPECULATORS | COMMERCIALS | SMALL TRADERS |
| – Percent of Open Interest Longs: | 11.1 | 78.4 | 7.8 |
| – Percent of Open Interest Shorts: | 19.3 | 63.5 | 14.5 |
| – Net Position: | -313,371 | 567,638 | -254,267 |
| – Gross Longs: | 420,694 | 2,982,808 | 297,942 |
| – Gross Shorts: | 734,065 | 2,415,170 | 552,209 |
| – Long to Short Ratio: | 0.6 to 1 | 1.2 to 1 | 0.5 to 1 |
| NET POSITION TREND: | |||
| – COT Index Score (3 Year Range Pct): | 23.8 | 92.8 | 19.5 |
| – COT Index Reading (3 Year Range): | Bearish | Bullish-Extreme | Bearish-Extreme |
| NET POSITION MOVEMENT INDEX: | |||
| – 6-Week Change in Strength Index: | -48.2 | 30.6 | 15.0 |
Ultra 10-Year Notes Futures:
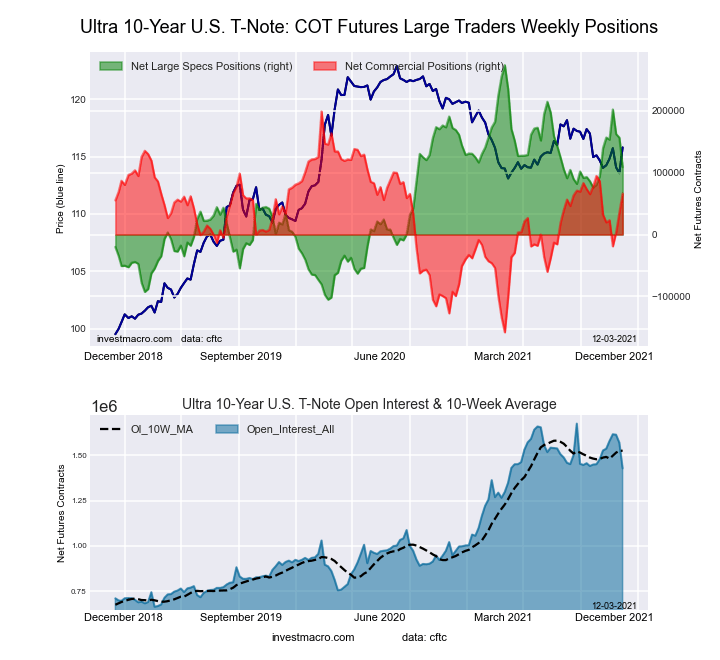 The Ultra 10-Year Notes large speculator standing this week equaled a net position of 108,880 contracts in the data reported through Tuesday. This was a weekly decline of -47,706 contracts from the previous week which had a total of 156,586 net contracts.
This week’s current strength score (the trader positioning range over the past three years, measured from 0 to 100) shows the speculators are currently Bullish with a score of 56.5 percent. The commercials are Bullish with a score of 62.8 percent and the small traders (not shown in chart) are Bearish-Extreme with a score of 10.2 percent.
| Ultra 10-Year Notes Statistics | SPECULATORS | COMMERCIALS | SMALL TRADERS |
| – Percent of Open Interest Longs: | 17.5 | 72.1 | 7.3 |
| – Percent of Open Interest Shorts: | 9.9 | 67.5 | 19.5 |
| – Net Position: | 108,880 | 66,179 | -175,059 |
| – Gross Longs: | 250,436 | 1,030,621 | 104,031 |
| – Gross Shorts: | 141,556 | 964,442 | 279,090 |
| – Long to Short Ratio: | 1.8 to 1 | 1.1 to 1 | 0.4 to 1 |
| NET POSITION TREND: | |||
| – COT Index Score (3 Year Range Pct): | 56.5 | 62.8 | 10.2 |
| – COT Index Reading (3 Year Range): | Bullish | Bullish | Bearish-Extreme |
| NET POSITION MOVEMENT INDEX: | |||
| – 6-Week Change in Strength Index: | -8.1 | 9.5 | -2.0 |
US Treasury Bonds Futures:
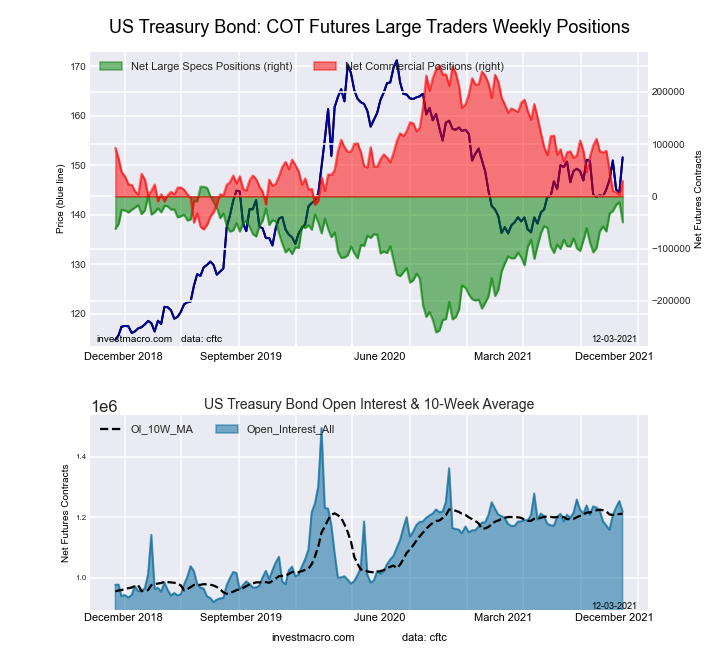 The US Treasury Bonds large speculator standing this week equaled a net position of -49,640 contracts in the data reported through Tuesday. This was a weekly decline of -38,615 contracts from the previous week which had a total of -11,025 net contracts.
This week’s current strength score (the trader positioning range over the past three years, measured from 0 to 100) shows the speculators are currently Bullish with a score of 75.6 percent. The commercials are Bearish with a score of 29.6 percent and the small traders (not shown in chart) are Bullish with a score of 68.5 percent.
| US Treasury Bonds Statistics | SPECULATORS | COMMERCIALS | SMALL TRADERS |
| – Percent of Open Interest Longs: | 10.5 | 72.6 | 14.9 |
| – Percent of Open Interest Shorts: | 14.6 | 70.2 | 13.2 |
| – Net Position: | -49,640 | 29,588 | 20,052 |
| – Gross Longs: | 127,915 | 885,731 | 181,245 |
| – Gross Shorts: | 177,555 | 856,143 | 161,193 |
| – Long to Short Ratio: | 0.7 to 1 | 1.0 to 1 | 1.1 to 1 |
| NET POSITION TREND: | |||
| – COT Index Score (3 Year Range Pct): | 75.6 | 29.6 | 68.5 |
| – COT Index Reading (3 Year Range): | Bullish | Bearish | Bullish |
| NET POSITION MOVEMENT INDEX: | |||
| – 6-Week Change in Strength Index: | 2.9 | -17.3 | 36.7 |
Ultra US Treasury Bonds Futures:
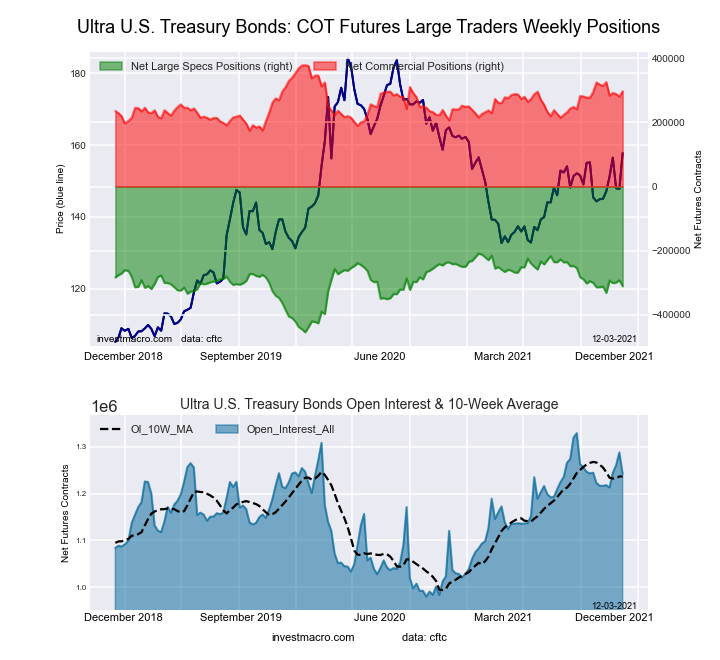 The Ultra US Treasury Bonds large speculator standing this week equaled a net position of -310,496 contracts in the data reported through Tuesday. This was a weekly fall of -18,776 contracts from the previous week which had a total of -291,720 net contracts.
This week’s current strength score (the trader positioning range over the past three years, measured from 0 to 100) shows the speculators are currently Bullish with a score of 58.5 percent. The commercials are Bullish with a score of 60.1 percent and the small traders (not shown in chart) are Bearish with a score of 38.2 percent.
| Ultra US Treasury Bonds Statistics | SPECULATORS | COMMERCIALS | SMALL TRADERS |
| – Percent of Open Interest Longs: | 5.6 | 80.5 | 12.0 |
| – Percent of Open Interest Shorts: | 30.6 | 56.6 | 10.9 |
| – Net Position: | -310,496 | 296,670 | 13,826 |
| – Gross Longs: | 69,305 | 1,000,175 | 149,596 |
| – Gross Shorts: | 379,801 | 703,505 | 135,770 |
| – Long to Short Ratio: | 0.2 to 1 | 1.4 to 1 | 1.1 to 1 |
| NET POSITION TREND: | |||
| – COT Index Score (3 Year Range Pct): | 58.5 | 60.1 | 38.2 |
| – COT Index Reading (3 Year Range): | Bullish | Bullish | Bearish |
| NET POSITION MOVEMENT INDEX: | |||
| – 6-Week Change in Strength Index: | 0.5 | -8.4 | 11.4 |
Article By InvestMacro – Receive our weekly COT Reports by Email
*COT Report: The COT data, released weekly to the public each Friday, is updated through the most recent Tuesday (data is 3 days old) and shows a quick view of how large speculators or non-commercials (for-profit traders) were positioned in the futures markets.
The CFTC categorizes trader positions according to commercial hedgers (traders who use futures contracts for hedging as part of the business), non-commercials (large traders who speculate to realize trading profits) and nonreportable traders (usually small traders/speculators) as well as their open interest (contracts open in the market at time of reporting).See CFTC criteria here.

- COT Metals Charts: Weekly Speculator Bets see small gains for Silver & Gold Jul 12, 2026
- COT Bonds Charts: Speculator Bets led by SOFR 3-Months & 2-Year Bonds Jul 12, 2026
- COT Energy Charts: Weekly Speculator Changes led by Brent Oil Jul 12, 2026
- COT Soft Commodities Charts: Weekly Speculator Changes led by Sugar, Corn & Soybeans Jul 12, 2026
- The US and European stock indices are rising again amid renewed investor interest in the AI industry. Jul 10, 2026
- USD/JPY Falls as Yen Recovers Weekly Losses Jul 10, 2026
- Crude oil prices surged sharply by 7% in reaction to the rapid escalation of the conflict in the Middle East Jul 9, 2026
- Middle East Tensions Weigh on Gold Jul 9, 2026
- Pound Awaits Tighter Policy from Bank of England Jul 8, 2026
- The United States carried out airstrikes on Iran after Iran’s attacked tankers in the Strait of Hormuz. The RBNZ raised the interest rate to 2.5% Jul 8, 2026