
Here are the latest charts and statistics for the Commitment of Traders (COT) data published by the Commodities Futures Trading Commission (CFTC).
The latest COT data is updated through Tuesday November 30th 2021 and shows a quick view of how large traders (for-profit speculators and commercial entities) were positioned in the futures markets.
Highlighting this week’s COT Metals data is the decline across the board in the metals speculator positioning. This week saw speculators pull back on bets for Gold (-8,551 contracts), Silver (-1,671 contracts), Copper (-4,531 contracts), Palladium (-1,207 contracts) and Platinum (-4,187 contracts).
Silver and Gold are in relatively strong speculator positioning at the moment with both right around their 60 percent strength score which measures the current level against the last three years. Copper positioning, on the other hand, has fallen quite a bit over the past year. Bullish net positions reached as high as +75,000 contracts in February before cooling off and trending lower over the year. Currently, Copper bets declined for a sixth straight week and dipped to a total bullish position of just 9,191 contracts this week.
Platinum continues to have a small bullish contract level while Palladium, the high flyer before the pandemic, has continued to have very low open interest and has been in a bearish position since August.
| Nov-30-2021 | OI | OI-Index | Spec-Net | Spec-Index | Com-Net | COM-Index | Smalls-Net | Smalls-Index |
|---|---|---|---|---|---|---|---|---|
| WTI Crude | 2,033,286 | 14 | 387,234 | 35 | -432,885 | 53 | 45,651 | 79 |
| Gold | 531,868 | 33 | 225,860 | 60 | -258,603 | 39 | 32,743 | 57 |
| Silver | 138,003 | 5 | 38,434 | 61 | -52,009 | 48 | 13,575 | 19 |
| Copper | 184,214 | 15 | 9,191 | 49 | -15,763 | 49 | 6,572 | 63 |
| Palladium | 9,621 | 14 | -2,973 | 2 | 3,277 | 98 | -304 | 27 |
| Platinum | 62,385 | 26 | 8,948 | 15 | -14,696 | 88 | 5,748 | 42 |
| Natural Gas | 1,269,879 | 36 | -132,678 | 39 | 93,560 | 60 | 39,118 | 78 |
| Brent | 217,781 | 53 | -15,494 | 93 | 12,212 | 8 | 3,282 | 54 |
| Heating Oil | 298,300 | 0 | 11,225 | 59 | -26,834 | 43 | 15,609 | 52 |
| Soybeans | 671,433 | 15 | 55,317 | 44 | -16,980 | 62 | -38,337 | 8 |
| Corn | 1,405,105 | 5 | 394,912 | 80 | -341,094 | 23 | -53,818 | 12 |
| Coffee | 266,001 | 33 | 66,025 | 97 | -69,144 | 6 | 3,119 | 10 |
| Sugar | 882,199 | 15 | 214,995 | 81 | -242,927 | 22 | 27,932 | 42 |
| Wheat | 371,575 | 19 | 18,294 | 63 | -10,430 | 31 | -7,864 | 64 |
Free Reports:
 Get our Weekly Commitment of Traders Reports - See where the biggest traders (Hedge Funds and Commercial Hedgers) are positioned in the futures markets on a weekly basis.
 Download Our Metatrader 4 Indicators – Put Our Free MetaTrader 4 Custom Indicators on your charts when you join our Weekly Newsletter
Gold Comex Futures:
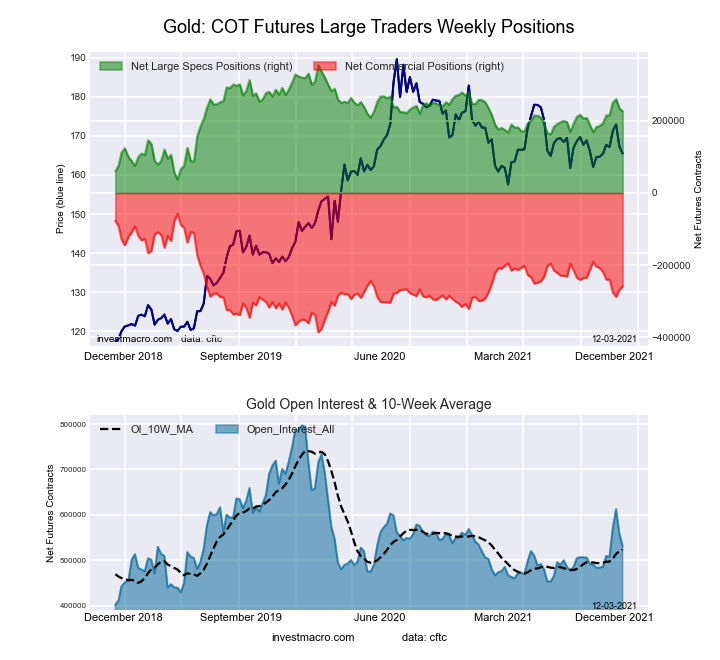 The Gold Comex Futures large speculator standing this week equaled a net position of 225,860 contracts in the data reported through Tuesday. This was a weekly decline of -8,551 contracts from the previous week which had a total of 234,411 net contracts.
This week’s current strength score (the trader positioning range over the past three years, measured from 0 to 100) shows the speculators are currently Bullish with a score of 59.6 percent. The commercials are Bearish with a score of 38.7 percent and the small traders (not shown in chart) are Bullish with a score of 57.1 percent.
| Gold Futures Statistics | SPECULATORS | COMMERCIALS | SMALL TRADERS |
| – Percent of Open Interest Longs: | 58.3 | 22.5 | 9.7 |
| – Percent of Open Interest Shorts: | 15.9 | 71.1 | 3.6 |
| – Net Position: | 225,860 | -258,603 | 32,743 |
| – Gross Longs: | 310,253 | 119,562 | 51,657 |
| – Gross Shorts: | 84,393 | 378,165 | 18,914 |
| – Long to Short Ratio: | 3.7 to 1 | 0.3 to 1 | 2.7 to 1 |
| NET POSITION TREND: | |||
| – COT Index Score (3 Year Range Pct): | 59.6 | 38.7 | 57.1 |
| – COT Index Reading (3 Year Range): | Bullish | Bearish | Bullish |
| NET POSITION MOVEMENT INDEX: | |||
| – 6-Week Change in Strength Index: | 10.3 | -12.0 | 19.6 |
Silver Comex Futures:
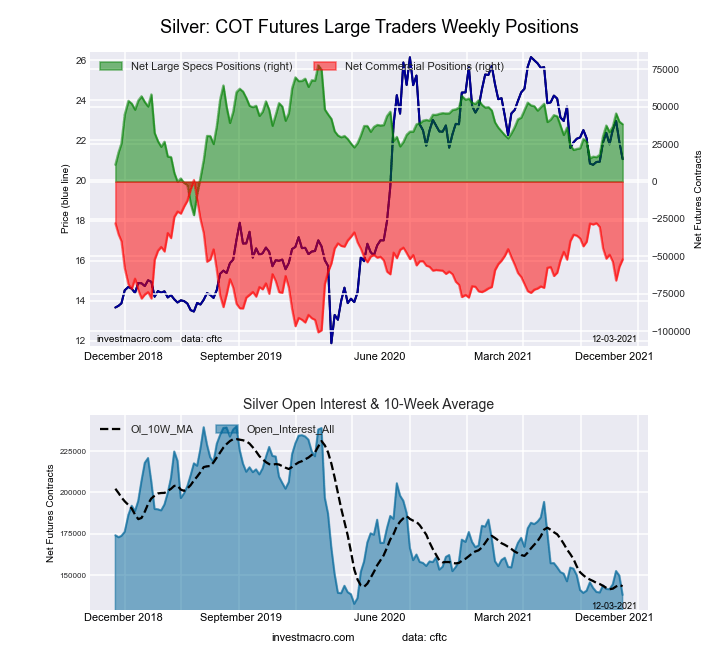 The Silver Comex Futures large speculator standing this week equaled a net position of 38,434 contracts in the data reported through Tuesday. This was a weekly decrease of -1,671 contracts from the previous week which had a total of 40,105 net contracts.
This week’s current strength score (the trader positioning range over the past three years, measured from 0 to 100) shows the speculators are currently Bullish with a score of 60.7 percent. The commercials are Bearish with a score of 47.9 percent and the small traders (not shown in chart) are Bearish-Extreme with a score of 19.0 percent.
| Silver Futures Statistics | SPECULATORS | COMMERCIALS | SMALL TRADERS |
| – Percent of Open Interest Longs: | 45.4 | 29.1 | 19.0 |
| – Percent of Open Interest Shorts: | 17.6 | 66.7 | 9.1 |
| – Net Position: | 38,434 | -52,009 | 13,575 |
| – Gross Longs: | 62,678 | 40,107 | 26,184 |
| – Gross Shorts: | 24,244 | 92,116 | 12,609 |
| – Long to Short Ratio: | 2.6 to 1 | 0.4 to 1 | 2.1 to 1 |
| NET POSITION TREND: | |||
| – COT Index Score (3 Year Range Pct): | 60.7 | 47.9 | 19.0 |
| – COT Index Reading (3 Year Range): | Bullish | Bearish | Bearish-Extreme |
| NET POSITION MOVEMENT INDEX: | |||
| – 6-Week Change in Strength Index: | 8.1 | -7.3 | -3.9 |
Copper Grade #1 Futures:
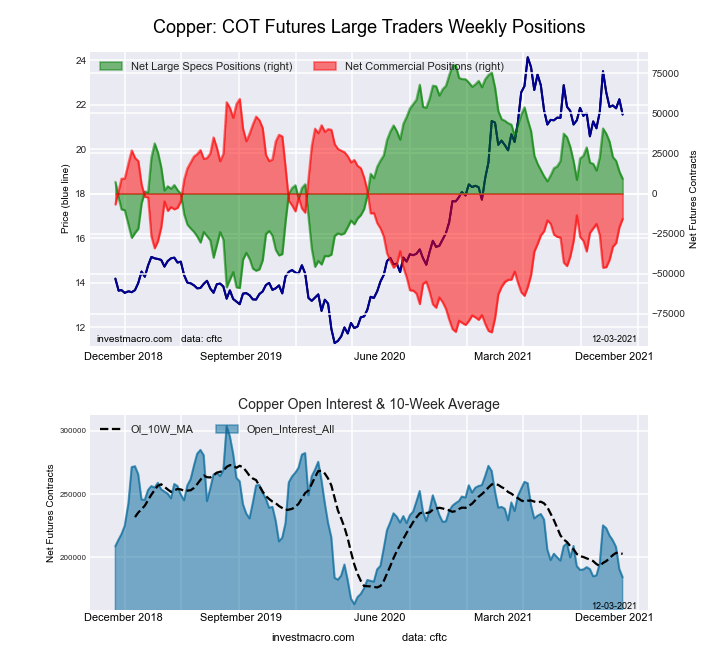 The Copper Grade #1 Futures large speculator standing this week equaled a net position of 9,191 contracts in the data reported through Tuesday. This was a weekly decline of -4,531 contracts from the previous week which had a total of 13,722 net contracts.
This week’s current strength score (the trader positioning range over the past three years, measured from 0 to 100) shows the speculators are currently Bearish with a score of 49.0 percent. The commercials are Bearish with a score of 48.6 percent and the small traders (not shown in chart) are Bullish with a score of 63.3 percent.
| Copper Futures Statistics | SPECULATORS | COMMERCIALS | SMALL TRADERS |
| – Percent of Open Interest Longs: | 37.1 | 42.8 | 9.2 |
| – Percent of Open Interest Shorts: | 32.1 | 51.3 | 5.6 |
| – Net Position: | 9,191 | -15,763 | 6,572 |
| – Gross Longs: | 68,310 | 78,773 | 16,876 |
| – Gross Shorts: | 59,119 | 94,536 | 10,304 |
| – Long to Short Ratio: | 1.2 to 1 | 0.8 to 1 | 1.6 to 1 |
| NET POSITION TREND: | |||
| – COT Index Score (3 Year Range Pct): | 49.0 | 48.6 | 63.3 |
| – COT Index Reading (3 Year Range): | Bearish | Bearish | Bullish |
| NET POSITION MOVEMENT INDEX: | |||
| – 6-Week Change in Strength Index: | -22.6 | 20.9 | 5.5 |
Platinum Futures:
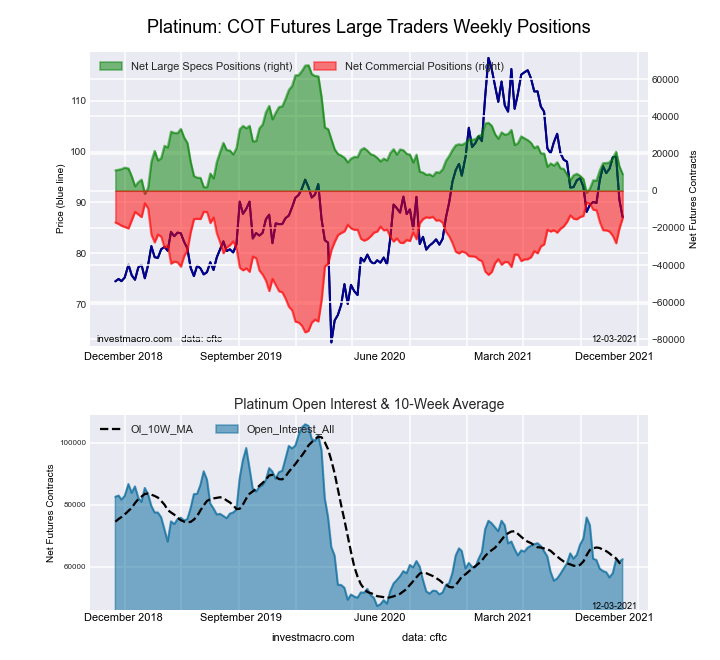 The Platinum Futures large speculator standing this week equaled a net position of 8,948 contracts in the data reported through Tuesday. This was a weekly decline of -4,187 contracts from the previous week which had a total of 13,135 net contracts.
This week’s current strength score (the trader positioning range over the past three years, measured from 0 to 100) shows the speculators are currently Bearish-Extreme with a score of 15.3 percent. The commercials are Bullish-Extreme with a score of 88.0 percent and the small traders (not shown in chart) are Bearish with a score of 42.2 percent.
| Platinum Futures Statistics | SPECULATORS | COMMERCIALS | SMALL TRADERS |
| – Percent of Open Interest Longs: | 45.5 | 34.5 | 14.9 |
| – Percent of Open Interest Shorts: | 31.2 | 58.1 | 5.7 |
| – Net Position: | 8,948 | -14,696 | 5,748 |
| – Gross Longs: | 28,408 | 21,528 | 9,297 |
| – Gross Shorts: | 19,460 | 36,224 | 3,549 |
| – Long to Short Ratio: | 1.5 to 1 | 0.6 to 1 | 2.6 to 1 |
| NET POSITION TREND: | |||
| – COT Index Score (3 Year Range Pct): | 15.3 | 88.0 | 42.2 |
| – COT Index Reading (3 Year Range): | Bearish-Extreme | Bullish-Extreme | Bearish |
| NET POSITION MOVEMENT INDEX: | |||
| – 6-Week Change in Strength Index: | -8.5 | 9.3 | -8.2 |
Palladium Futures:
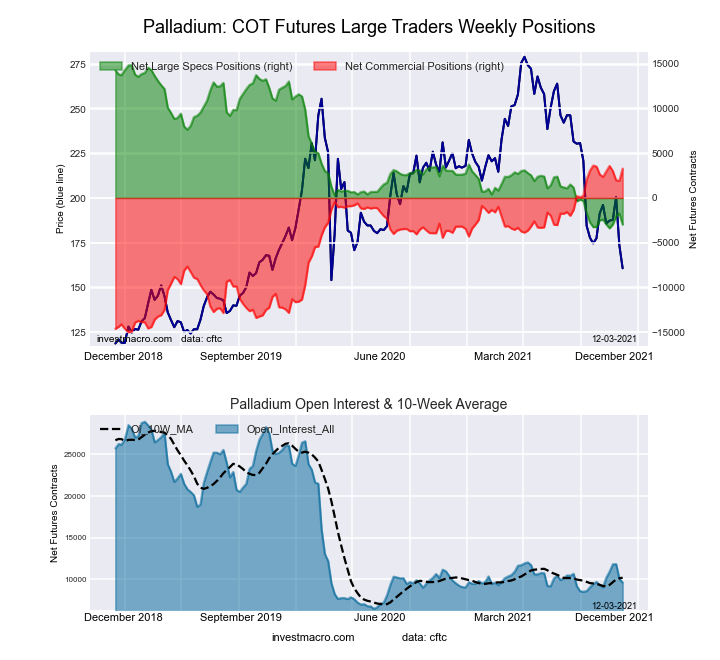 The Palladium Futures large speculator standing this week equaled a net position of -2,973 contracts in the data reported through Tuesday. This was a weekly lowering of -1,207 contracts from the previous week which had a total of -1,766 net contracts.
This week’s current strength score (the trader positioning range over the past three years, measured from 0 to 100) shows the speculators are currently Bearish-Extreme with a score of 2.3 percent. The commercials are Bullish-Extreme with a score of 98.2 percent and the small traders (not shown in chart) are Bearish with a score of 26.7 percent.
| Palladium Futures Statistics | SPECULATORS | COMMERCIALS | SMALL TRADERS |
| – Percent of Open Interest Longs: | 30.8 | 53.4 | 13.7 |
| – Percent of Open Interest Shorts: | 61.8 | 19.3 | 16.8 |
| – Net Position: | -2,973 | 3,277 | -304 |
| – Gross Longs: | 2,968 | 5,136 | 1,317 |
| – Gross Shorts: | 5,941 | 1,859 | 1,621 |
| – Long to Short Ratio: | 0.5 to 1 | 2.8 to 1 | 0.8 to 1 |
| NET POSITION TREND: | |||
| – COT Index Score (3 Year Range Pct): | 2.3 | 98.2 | 26.7 |
| – COT Index Reading (3 Year Range): | Bearish-Extreme | Bullish-Extreme | Bearish |
| NET POSITION MOVEMENT INDEX: | |||
| – 6-Week Change in Strength Index: | -3.1 | 5.0 | -21.5 |
Article By InvestMacro – Receive our weekly COT Reports by Email
*COT Report: The COT data, released weekly to the public each Friday, is updated through the most recent Tuesday (data is 3 days old) and shows a quick view of how large speculators or non-commercials (for-profit traders) were positioned in the futures markets.
The CFTC categorizes trader positions according to commercial hedgers (traders who use futures contracts for hedging as part of the business), non-commercials (large traders who speculate to realize trading profits) and nonreportable traders (usually small traders/speculators) as well as their open interest (contracts open in the market at time of reporting).See CFTC criteria here.

- The Bank of Canada kept its interest rate unchanged. Platinum prices reached a three‑week high Jul 16, 2026
- Stock indices rose after the release of US inflation data. China’s GDP slowed sharply Jul 15, 2026
- GBP/USD Awaits Political News: What Will Happen Next Jul 15, 2026
- USD/JPY Holds at Highs: Pressure Lingers on Yen Jul 14, 2026
- Oil prices jumped 4% amid a new wave of escalation between the US and Iran Jul 13, 2026
- EUR/USD: US Inflation Will Determine Everything Jul 13, 2026
- COT Metals Charts: Weekly Speculator Bets see small gains for Silver & Gold Jul 12, 2026
- COT Bonds Charts: Speculator Bets led by SOFR 3-Months & 2-Year Bonds Jul 12, 2026
- COT Energy Charts: Weekly Speculator Changes led by Brent Oil Jul 12, 2026
- COT Soft Commodities Charts: Weekly Speculator Changes led by Sugar, Corn & Soybeans Jul 12, 2026