
Here are the latest charts and statistics for the Commitment of Traders (COT) data published by the Commodities Futures Trading Commission (CFTC).
The latest COT data is updated through Tuesday November 30th 2021 and shows a quick view of how large traders (for-profit speculators and commercial entities) were positioned in the futures markets.
Highlighting this week’s COT stock market data is the VIX speculators sharply trimming their bearish bets. Stocks speculators pulled back on their VIX bearish bets for the third time in the past four weeks and by a total of 42,132 net contracts over that period. This reduction in bearish sentiment has brought the current net standing of -61,154 contracts to the least bearish level since August 3rd, a span of seventeen weeks. VIX speculators have been betting on lower volatility and positions have been as bearish as -103,286 contracts as recently as November 2nd before those positions cooled off and volatility has started to rise.
| Nov-30-2021 | OI | OI-Index | Spec-Net | Spec-Index | Com-Net | COM-Index | Smalls-Net | Smalls-Index |
|---|---|---|---|---|---|---|---|---|
| S&P500-Mini | 2,510,714 | 6 | 179,725 | 94 | -192,683 | 31 | 12,958 | 29 |
| Nikkei 225 | 17,463 | 9 | 1,768 | 64 | -2,099 | 45 | 331 | 31 |
| Nasdaq-Mini | 258,476 | 47 | 33,933 | 94 | -25,451 | 11 | -8,482 | 25 |
| DowJones-Mini | 101,603 | 72 | -6,836 | 27 | 2,518 | 66 | 4,318 | 62 |
| VIX | 325,869 | 34 | -61,154 | 60 | 68,347 | 42 | -7,193 | 29 |
| Nikkei 225 Yen | 52,198 | 32 | -1,050 | 19 | 23,966 | 90 | -22,916 | 34 |
VIX Volatility Futures:
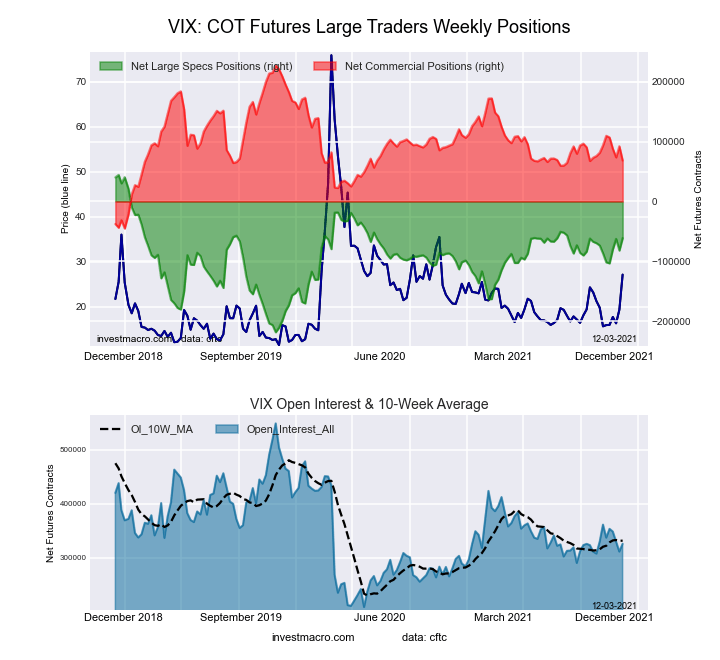 The VIX Volatility large speculator standing this week recorded a net position of -61,154 contracts in the data reported through Tuesday. This was a weekly boost of 20,782 contracts from the previous week which had a total of -81,936 net contracts.
This week’s current strength score (the trader positioning range over the past three years, measured from 0 to 100) shows the speculators are currently Bullish with a score of 59.9 percent. The commercials are Bearish with a score of 41.6 percent and the small traders (not shown in chart) are Bearish with a score of 29.1 percent.
Free Reports:
 Get our Weekly Commitment of Traders Reports - See where the biggest traders (Hedge Funds and Commercial Hedgers) are positioned in the futures markets on a weekly basis.
 Sign Up for Our Stock Market Newsletter – Get updated on News, Charts & Rankings of Public Companies when you join our Stocks Newsletter
| VIX Volatility Futures Statistics | SPECULATORS | COMMERCIALS | SMALL TRADERS |
| – Percent of Open Interest Longs: | 20.9 | 52.5 | 6.5 |
| – Percent of Open Interest Shorts: | 39.6 | 31.5 | 8.7 |
| – Net Position: | -61,154 | 68,347 | -7,193 |
| – Gross Longs: | 68,020 | 171,050 | 21,128 |
| – Gross Shorts: | 129,174 | 102,703 | 28,321 |
| – Long to Short Ratio: | 0.5 to 1 | 1.7 to 1 | 0.7 to 1 |
| NET POSITION TREND: | |||
| – COT Index Score (3 Year Range Pct): | 59.9 | 41.6 | 29.1 |
| – COT Index Reading (3 Year Range): | Bullish | Bearish | Bearish |
| NET POSITION MOVEMENT INDEX: | |||
| – 6-Week Change in Strength Index: | 9.8 | -9.3 | -1.3 |
S&P500 Mini Futures:
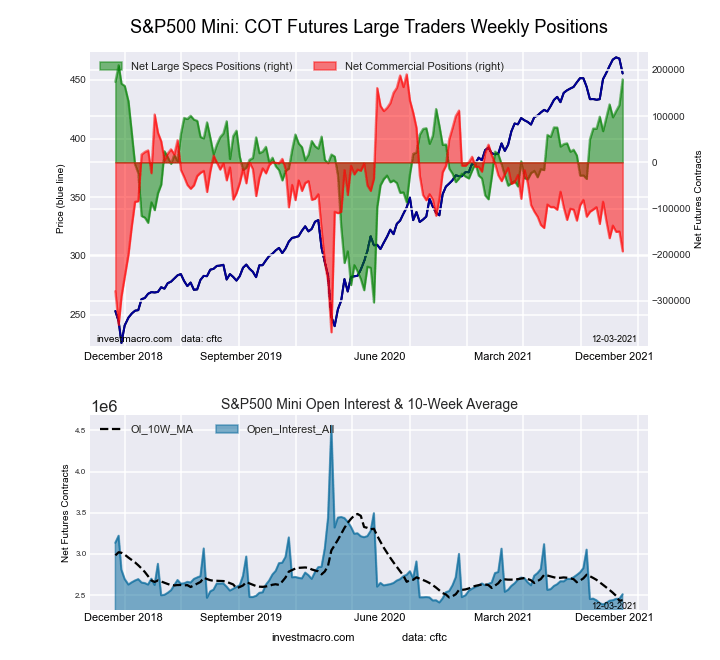 The S&P500 Mini large speculator standing this week recorded a net position of 179,725 contracts in the data reported through Tuesday. This was a weekly gain of 55,911 contracts from the previous week which had a total of 123,814 net contracts.
This week’s current strength score (the trader positioning range over the past three years, measured from 0 to 100) shows the speculators are currently Bullish-Extreme with a score of 94.1 percent. The commercials are Bearish with a score of 31.4 percent and the small traders (not shown in chart) are Bearish with a score of 29.1 percent.
| S&P500 Mini Futures Statistics | SPECULATORS | COMMERCIALS | SMALL TRADERS |
| – Percent of Open Interest Longs: | 17.0 | 68.9 | 11.0 |
| – Percent of Open Interest Shorts: | 9.8 | 76.5 | 10.5 |
| – Net Position: | 179,725 | -192,683 | 12,958 |
| – Gross Longs: | 425,700 | 1,729,147 | 277,390 |
| – Gross Shorts: | 245,975 | 1,921,830 | 264,432 |
| – Long to Short Ratio: | 1.7 to 1 | 0.9 to 1 | 1.0 to 1 |
| NET POSITION TREND: | |||
| – COT Index Score (3 Year Range Pct): | 94.1 | 31.4 | 29.1 |
| – COT Index Reading (3 Year Range): | Bullish-Extreme | Bearish | Bearish |
| NET POSITION MOVEMENT INDEX: | |||
| – 6-Week Change in Strength Index: | 21.8 | -19.2 | -1.0 |
Dow Jones Mini Futures:
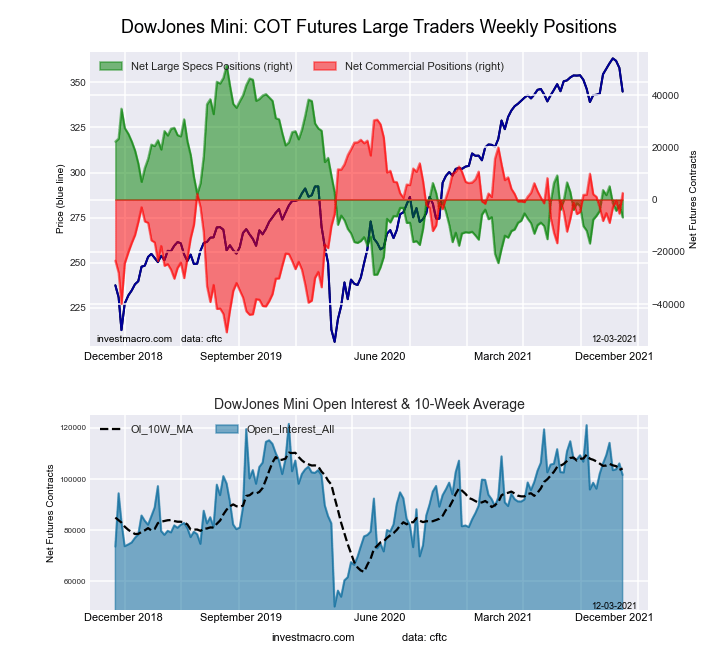 The Dow Jones Mini large speculator standing this week recorded a net position of -6,836 contracts in the data reported through Tuesday. This was a weekly decrease of -4,685 contracts from the previous week which had a total of -2,151 net contracts.
This week’s current strength score (the trader positioning range over the past three years, measured from 0 to 100) shows the speculators are currently Bearish with a score of 27.3 percent. The commercials are Bullish with a score of 65.5 percent and the small traders (not shown in chart) are Bullish with a score of 61.6 percent.
| Dow Jones Mini Futures Statistics | SPECULATORS | COMMERCIALS | SMALL TRADERS |
| – Percent of Open Interest Longs: | 33.5 | 48.0 | 17.4 |
| – Percent of Open Interest Shorts: | 40.3 | 45.5 | 13.1 |
| – Net Position: | -6,836 | 2,518 | 4,318 |
| – Gross Longs: | 34,083 | 48,778 | 17,643 |
| – Gross Shorts: | 40,919 | 46,260 | 13,325 |
| – Long to Short Ratio: | 0.8 to 1 | 1.1 to 1 | 1.3 to 1 |
| NET POSITION TREND: | |||
| – COT Index Score (3 Year Range Pct): | 27.3 | 65.5 | 61.6 |
| – COT Index Reading (3 Year Range): | Bearish | Bullish | Bullish |
| NET POSITION MOVEMENT INDEX: | |||
| – 6-Week Change in Strength Index: | -13.1 | 13.1 | -1.2 |
Nasdaq Mini Futures:
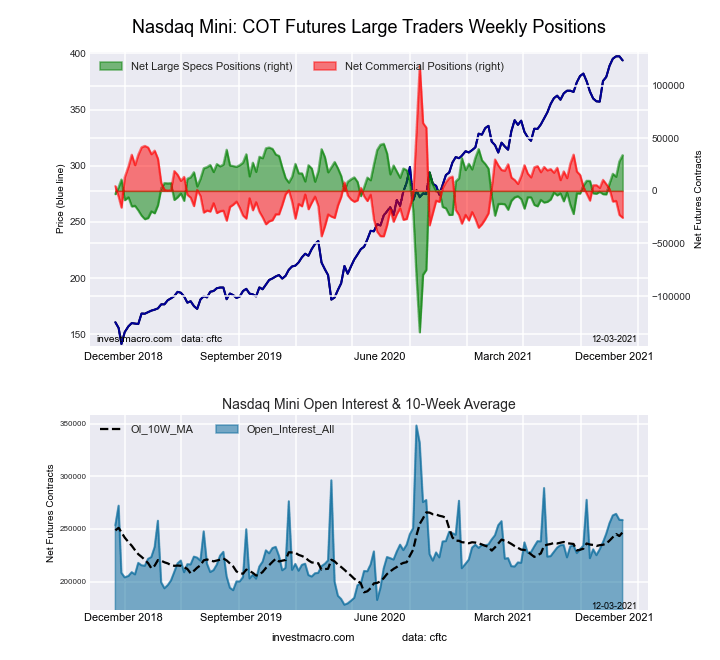 The Nasdaq Mini large speculator standing this week recorded a net position of 33,933 contracts in the data reported through Tuesday. This was a weekly rise of 5,919 contracts from the previous week which had a total of 28,014 net contracts.
This week’s current strength score (the trader positioning range over the past three years, measured from 0 to 100) shows the speculators are currently Bullish-Extreme with a score of 94.0 percent. The commercials are Bearish-Extreme with a score of 10.8 percent and the small traders (not shown in chart) are Bearish with a score of 25.0 percent.
| Nasdaq Mini Futures Statistics | SPECULATORS | COMMERCIALS | SMALL TRADERS |
| – Percent of Open Interest Longs: | 33.5 | 50.5 | 14.2 |
| – Percent of Open Interest Shorts: | 20.4 | 60.3 | 17.5 |
| – Net Position: | 33,933 | -25,451 | -8,482 |
| – Gross Longs: | 86,716 | 130,523 | 36,787 |
| – Gross Shorts: | 52,783 | 155,974 | 45,269 |
| – Long to Short Ratio: | 1.6 to 1 | 0.8 to 1 | 0.8 to 1 |
| NET POSITION TREND: | |||
| – COT Index Score (3 Year Range Pct): | 94.0 | 10.8 | 25.0 |
| – COT Index Reading (3 Year Range): | Bullish-Extreme | Bearish-Extreme | Bearish |
| NET POSITION MOVEMENT INDEX: | |||
| – 6-Week Change in Strength Index: | 20.7 | -22.1 | -2.5 |
Russell 2000 Mini Futures:
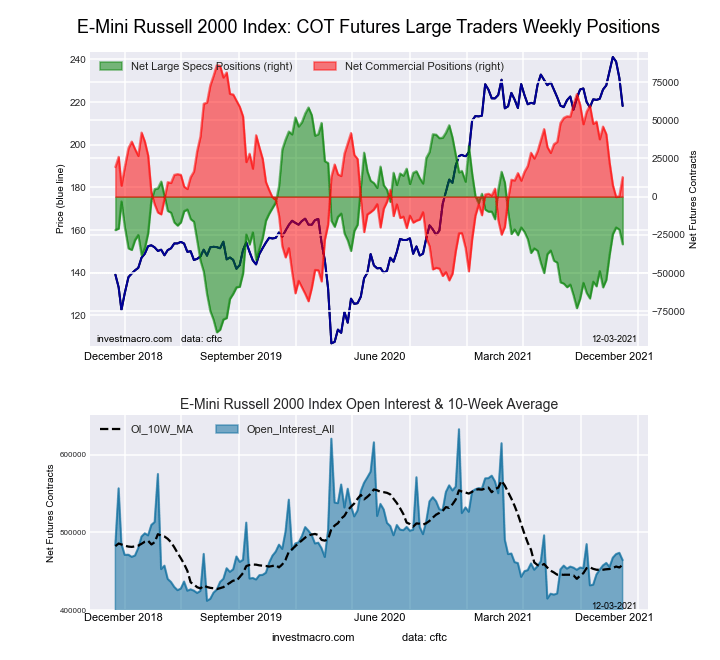 The Russell 2000 Mini large speculator standing this week recorded a net position of -31,141 contracts in the data reported through Tuesday. This was a weekly decrease of -9,603 contracts from the previous week which had a total of -21,538 net contracts.
This week’s current strength score (the trader positioning range over the past three years, measured from 0 to 100) shows the speculators are currently Bearish with a score of 39.2 percent. The commercials are Bullish with a score of 52.6 percent and the small traders (not shown in chart) are Bullish-Extreme with a score of 84.8 percent.
| Russell 2000 Mini Futures Statistics | SPECULATORS | COMMERCIALS | SMALL TRADERS |
| – Percent of Open Interest Longs: | 13.0 | 77.4 | 8.5 |
| – Percent of Open Interest Shorts: | 19.7 | 74.7 | 4.6 |
| – Net Position: | -31,141 | 12,788 | 18,353 |
| – Gross Longs: | 60,401 | 359,478 | 39,571 |
| – Gross Shorts: | 91,542 | 346,690 | 21,218 |
| – Long to Short Ratio: | 0.7 to 1 | 1.0 to 1 | 1.9 to 1 |
| NET POSITION TREND: | |||
| – COT Index Score (3 Year Range Pct): | 39.2 | 52.6 | 84.8 |
| – COT Index Reading (3 Year Range): | Bearish | Bullish | Bullish-Extreme |
| NET POSITION MOVEMENT INDEX: | |||
| – 6-Week Change in Strength Index: | 19.2 | -21.4 | 13.7 |
Nikkei Stock Average (USD) Futures:
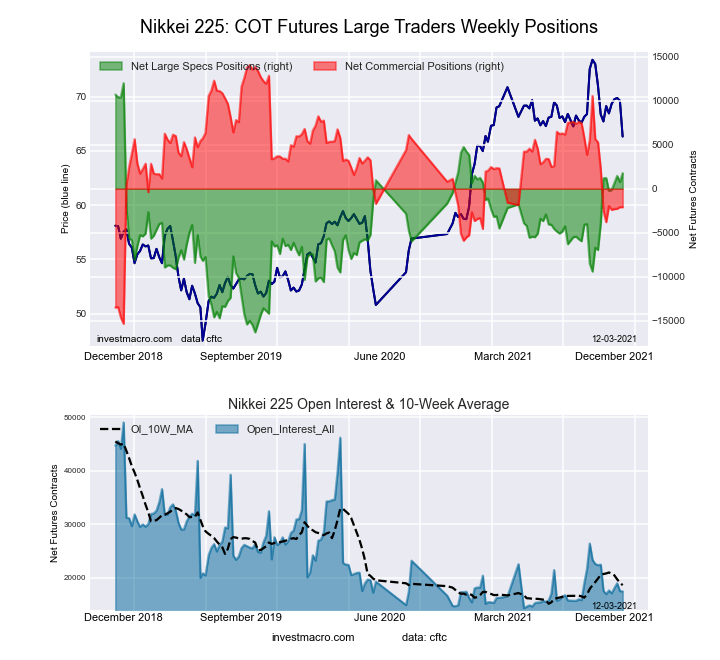 The Nikkei Stock Average (USD) large speculator standing this week recorded a net position of 1,768 contracts in the data reported through Tuesday. This was a weekly lift of 1,012 contracts from the previous week which had a total of 756 net contracts.
This week’s current strength score (the trader positioning range over the past three years, measured from 0 to 100) shows the speculators are currently Bullish with a score of 63.9 percent. The commercials are Bearish with a score of 45.1 percent and the small traders (not shown in chart) are Bearish with a score of 31.0 percent.
| Nikkei Stock Average Futures Statistics | SPECULATORS | COMMERCIALS | SMALL TRADERS |
| – Percent of Open Interest Longs: | 14.6 | 58.2 | 26.8 |
| – Percent of Open Interest Shorts: | 4.4 | 70.2 | 24.9 |
| – Net Position: | 1,768 | -2,099 | 331 |
| – Gross Longs: | 2,545 | 10,166 | 4,686 |
| – Gross Shorts: | 777 | 12,265 | 4,355 |
| – Long to Short Ratio: | 3.3 to 1 | 0.8 to 1 | 1.1 to 1 |
| NET POSITION TREND: | |||
| – COT Index Score (3 Year Range Pct): | 63.9 | 45.1 | 31.0 |
| – COT Index Reading (3 Year Range): | Bullish | Bearish | Bearish |
| NET POSITION MOVEMENT INDEX: | |||
| – 6-Week Change in Strength Index: | 2.0 | 5.8 | -28.8 |
MSCI EAFE Mini Futures:
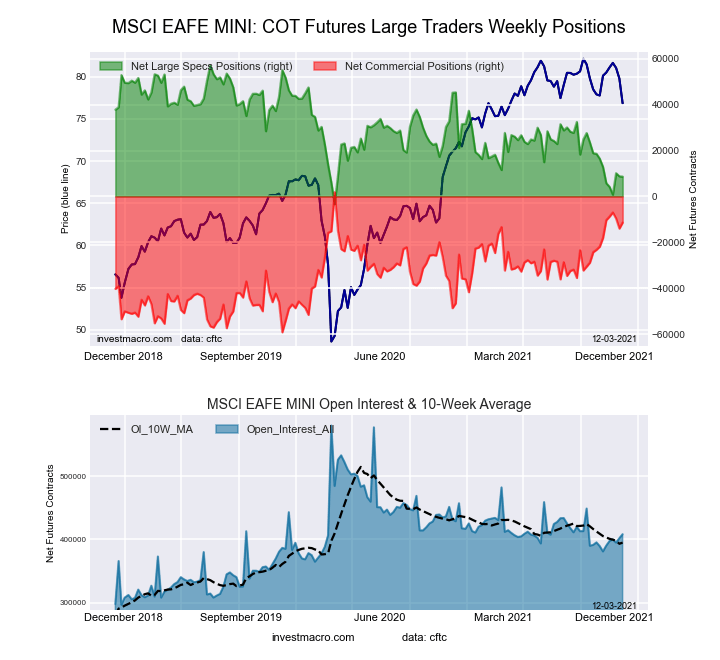 The MSCI EAFE Mini large speculator standing this week recorded a net position of 8,636 contracts in the data reported through Tuesday. This was a weekly lowering of -138 contracts from the previous week which had a total of 8,774 net contracts.
This week’s current strength score (the trader positioning range over the past three years, measured from 0 to 100) shows the speculators are currently Bearish-Extreme with a score of 19.9 percent. The commercials are Bullish with a score of 78.3 percent and the small traders (not shown in chart) are Bearish with a score of 40.8 percent.
| MSCI EAFE Mini Futures Statistics | SPECULATORS | COMMERCIALS | SMALL TRADERS |
| – Percent of Open Interest Longs: | 6.8 | 90.2 | 2.4 |
| – Percent of Open Interest Shorts: | 4.7 | 93.0 | 1.7 |
| – Net Position: | 8,636 | -11,389 | 2,753 |
| – Gross Longs: | 27,744 | 368,338 | 9,731 |
| – Gross Shorts: | 19,108 | 379,727 | 6,978 |
| – Long to Short Ratio: | 1.5 to 1 | 1.0 to 1 | 1.4 to 1 |
| NET POSITION TREND: | |||
| – COT Index Score (3 Year Range Pct): | 19.9 | 78.3 | 40.8 |
| – COT Index Reading (3 Year Range): | Bearish-Extreme | Bullish | Bearish |
| NET POSITION MOVEMENT INDEX: | |||
| – 6-Week Change in Strength Index: | -6.9 | 11.0 | -22.7 |
Article By InvestMacro – Receive our weekly COT Reports by Email
*COT Report: The COT data, released weekly to the public each Friday, is updated through the most recent Tuesday (data is 3 days old) and shows a quick view of how large speculators or non-commercials (for-profit traders) were positioned in the futures markets.
The CFTC categorizes trader positions according to commercial hedgers (traders who use futures contracts for hedging as part of the business), non-commercials (large traders who speculate to realize trading profits) and nonreportable traders (usually small traders/speculators) as well as their open interest (contracts open in the market at time of reporting).See CFTC criteria here.

- Oil prices jumped 4% amid a new wave of escalation between the US and Iran Jul 13, 2026
- EUR/USD: US Inflation Will Determine Everything Jul 13, 2026
- COT Metals Charts: Weekly Speculator Bets see small gains for Silver & Gold Jul 12, 2026
- COT Bonds Charts: Speculator Bets led by SOFR 3-Months & 2-Year Bonds Jul 12, 2026
- COT Energy Charts: Weekly Speculator Changes led by Brent Oil Jul 12, 2026
- COT Soft Commodities Charts: Weekly Speculator Changes led by Sugar, Corn & Soybeans Jul 12, 2026
- The US and European stock indices are rising again amid renewed investor interest in the AI industry. Jul 10, 2026
- USD/JPY Falls as Yen Recovers Weekly Losses Jul 10, 2026
- Crude oil prices surged sharply by 7% in reaction to the rapid escalation of the conflict in the Middle East Jul 9, 2026
- Middle East Tensions Weigh on Gold Jul 9, 2026