
By InvestMacro | COT | Data Tables | COT Leaders | Downloads | COT Newsletter
Here are the latest charts and statistics for the Commitment of Traders (COT) data published by the Commodities Futures Trading Commission (CFTC).
The latest COT data is updated through Tuesday December 7th 2021 and shows a quick view of how large traders (for-profit speculators and commercial entities) were positioned in the futures markets.
Highlighting this week’s COT energy data is the recent decline in the WTI Crude Oil futures bets. The speculative net position in the WTI Crude Oil futures has now fallen for four consecutive weeks and in six out of the past seven weeks. The spec crude position has dropped by a total of -62,362 contracts over these past seven weeks and speculators have now pushed their current net positioning to the lowest level since September 21st, a span of eleven weeks.
Joining WTI Crude Oil (-20,002 contracts) with decreasing bets this week are Brent Crude Oil (-4,952 contracts), Heating Oil (-2,628 contracts) and the Bloomberg Commodity Index (-4,473 contracts). The energy markets with gaining positions this week were Natural Gas (235 contracts) and Gasoline (4,269 contracts).
| Dec-07-2021 | OI | OI-Index | Spec-Net | Spec-Index | Com-Net | COM-Index | Smalls-Net | Smalls-Index |
|---|---|---|---|---|---|---|---|---|
| WTI Crude | 1,972,536 | 3 | 367,232 | 29 | -400,431 | 62 | 33,199 | 62 |
| Gold | 499,307 | 23 | 217,185 | 57 | -245,623 | 43 | 28,438 | 45 |
| Silver | 136,572 | 4 | 29,833 | 52 | -43,148 | 57 | 13,315 | 17 |
| Copper | 173,954 | 8 | 7,204 | 48 | -14,219 | 50 | 7,015 | 66 |
| Palladium | 9,253 | 12 | -2,731 | 4 | 3,036 | 97 | -305 | 27 |
| Platinum | 65,134 | 30 | 6,062 | 11 | -12,138 | 92 | 6,076 | 47 |
| Natural Gas | 1,205,626 | 20 | -132,443 | 39 | 99,372 | 62 | 33,071 | 63 |
| Brent | 211,254 | 48 | -20,446 | 84 | 17,107 | 17 | 3,339 | 55 |
| Heating Oil | 298,997 | 0 | 8,597 | 55 | -21,351 | 49 | 12,754 | 43 |
| Soybeans | 672,116 | 15 | 59,654 | 45 | -22,744 | 60 | -36,910 | 10 |
| Corn | 1,430,401 | 9 | 410,814 | 83 | -367,873 | 20 | -42,941 | 18 |
| Coffee | 265,046 | 33 | 62,344 | 94 | -65,596 | 8 | 3,252 | 11 |
| Sugar | 857,621 | 8 | 191,239 | 76 | -221,289 | 26 | 30,050 | 45 |
| Wheat | 359,186 | 12 | 15,667 | 60 | -8,386 | 33 | -7,281 | 67 |
Free Reports:
 Sign Up for Our Stock Market Newsletter – Get updated on News, Charts & Rankings of Public Companies when you join our Stocks Newsletter
 Get our Weekly Commitment of Traders Reports - See where the biggest traders (Hedge Funds and Commercial Hedgers) are positioned in the futures markets on a weekly basis.
WTI Crude Oil Futures:
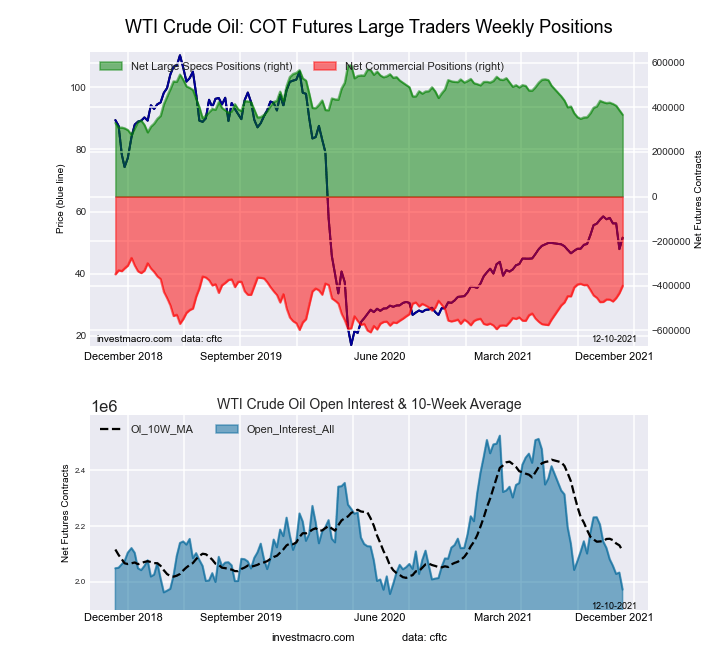 The WTI Crude Oil Futures large speculator standing this week was a net position of 367,232 contracts in the data reported through Tuesday. This was a weekly decrease of -20,002 contracts from the previous week which had a total of 387,234 net contracts.
This week’s current strength score (the trader positioning range over the past three years, measured from 0 to 100) shows the speculators are currently Bearish with a score of 28.8 percent. The commercials are Bullish with a score of 62.4 percent and the small traders (not shown in chart) are Bullish with a score of 61.8 percent.
| WTI Crude Oil Futures Statistics | SPECULATORS | COMMERCIALS | SMALL TRADERS |
| – Percent of Open Interest Longs: | 25.0 | 36.7 | 4.2 |
| – Percent of Open Interest Shorts: | 6.4 | 57.0 | 2.5 |
| – Net Position: | 367,232 | -400,431 | 33,199 |
| – Gross Longs: | 492,585 | 724,626 | 82,580 |
| – Gross Shorts: | 125,353 | 1,125,057 | 49,381 |
| – Long to Short Ratio: | 3.9 to 1 | 0.6 to 1 | 1.7 to 1 |
| NET POSITION TREND: | |||
| – Strength Index Score (3 Year Range Pct): | 28.8 | 62.4 | 61.8 |
| – Strength Index Reading (3 Year Range): | Bearish | Bullish | Bullish |
| NET POSITION MOVEMENT INDEX: | |||
| – 6-Week Change in Strength Index: | -18.1 | 21.6 | -21.9 |
Brent Crude Oil Futures:
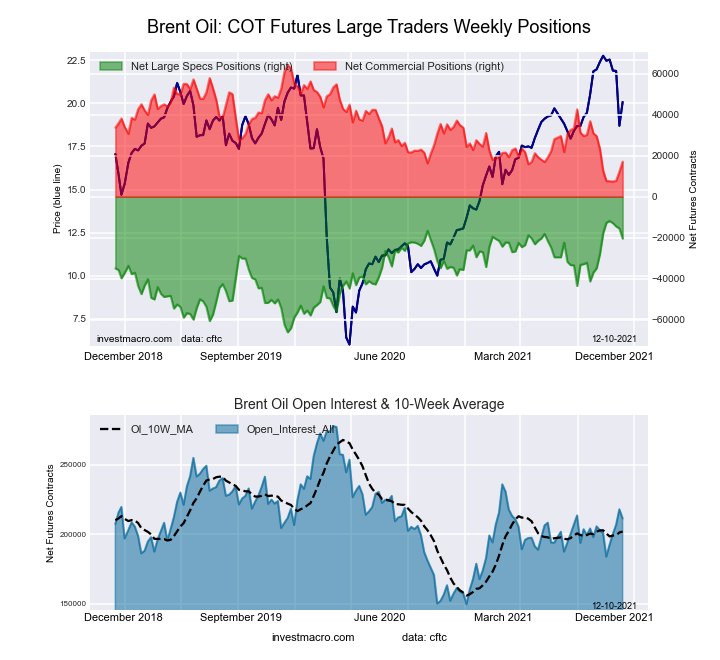 The Brent Crude Oil Futures large speculator standing this week was a net position of -20,446 contracts in the data reported through Tuesday. This was a weekly reduction of -4,952 contracts from the previous week which had a total of -15,494 net contracts.
This week’s current strength score (the trader positioning range over the past three years, measured from 0 to 100) shows the speculators are currently Bullish-Extreme with a score of 84.2 percent. The commercials are Bearish-Extreme with a score of 17.1 percent and the small traders (not shown in chart) are Bullish with a score of 54.5 percent.
| Brent Crude Oil Futures Statistics | SPECULATORS | COMMERCIALS | SMALL TRADERS |
| – Percent of Open Interest Longs: | 21.6 | 44.2 | 3.6 |
| – Percent of Open Interest Shorts: | 31.3 | 36.1 | 2.0 |
| – Net Position: | -20,446 | 17,107 | 3,339 |
| – Gross Longs: | 45,573 | 93,348 | 7,669 |
| – Gross Shorts: | 66,019 | 76,241 | 4,330 |
| – Long to Short Ratio: | 0.7 to 1 | 1.2 to 1 | 1.8 to 1 |
| NET POSITION TREND: | |||
| – Strength Index Score (3 Year Range Pct): | 84.2 | 17.1 | 54.5 |
| – Strength Index Reading (3 Year Range): | Bullish-Extreme | Bearish-Extreme | Bullish |
| NET POSITION MOVEMENT INDEX: | |||
| – 6-Week Change in Strength Index: | -4.8 | 7.8 | -24.6 |
Natural Gas Futures:
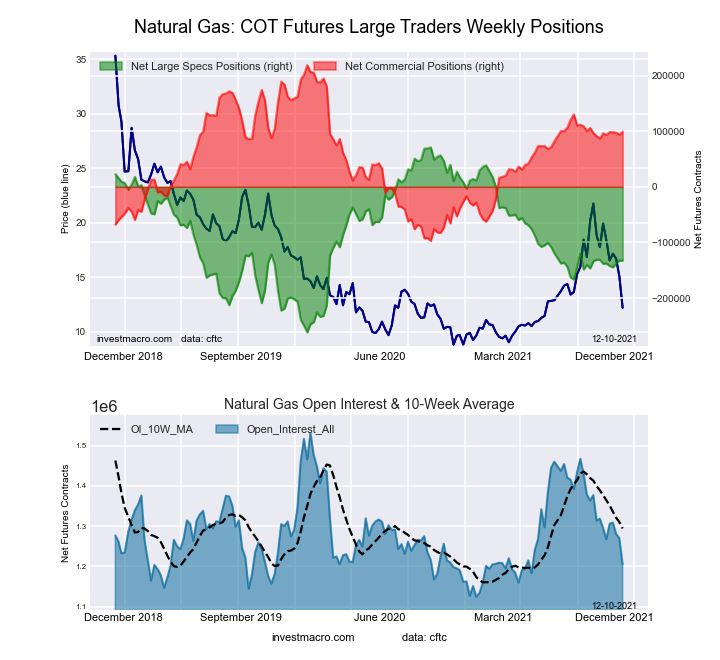 The Natural Gas Futures large speculator standing this week was a net position of -132,443 contracts in the data reported through Tuesday. This was a weekly lift of 235 contracts from the previous week which had a total of -132,678 net contracts.
This week’s current strength score (the trader positioning range over the past three years, measured from 0 to 100) shows the speculators are currently Bearish with a score of 38.8 percent. The commercials are Bullish with a score of 62.2 percent and the small traders (not shown in chart) are Bullish with a score of 62.7 percent.
| Natural Gas Futures Statistics | SPECULATORS | COMMERCIALS | SMALL TRADERS |
| – Percent of Open Interest Longs: | 19.3 | 43.5 | 4.6 |
| – Percent of Open Interest Shorts: | 30.3 | 35.2 | 1.9 |
| – Net Position: | -132,443 | 99,372 | 33,071 |
| – Gross Longs: | 233,007 | 524,229 | 55,682 |
| – Gross Shorts: | 365,450 | 424,857 | 22,611 |
| – Long to Short Ratio: | 0.6 to 1 | 1.2 to 1 | 2.5 to 1 |
| NET POSITION TREND: | |||
| – Strength Index Score (3 Year Range Pct): | 38.8 | 62.2 | 62.7 |
| – Strength Index Reading (3 Year Range): | Bearish | Bullish | Bullish |
| NET POSITION MOVEMENT INDEX: | |||
| – 6-Week Change in Strength Index: | 1.7 | 1.0 | -22.1 |
Gasoline Blendstock Futures:
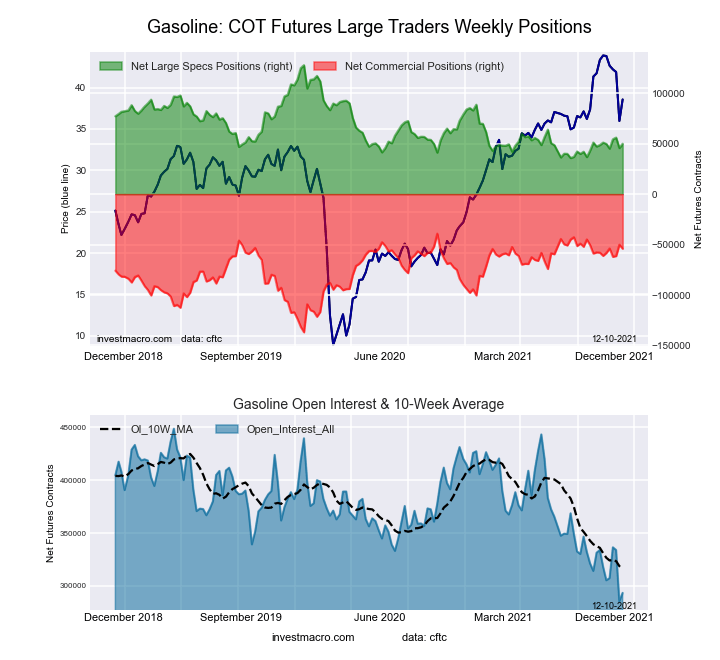 The Gasoline Blendstock Futures large speculator standing this week was a net position of 49,883 contracts in the data reported through Tuesday. This was a weekly increase of 4,269 contracts from the previous week which had a total of 45,614 net contracts.
This week’s current strength score (the trader positioning range over the past three years, measured from 0 to 100) shows the speculators are currently Bearish with a score of 20.9 percent. The commercials are Bullish-Extreme with a score of 82.9 percent and the small traders (not shown in chart) are Bearish with a score of 36.7 percent.
| Nasdaq Mini Futures Statistics | SPECULATORS | COMMERCIALS | SMALL TRADERS |
| – Percent of Open Interest Longs: | 30.4 | 48.5 | 5.7 |
| – Percent of Open Interest Shorts: | 13.4 | 66.9 | 4.3 |
| – Net Position: | 49,883 | -54,093 | 4,210 |
| – Gross Longs: | 89,156 | 142,169 | 16,850 |
| – Gross Shorts: | 39,273 | 196,262 | 12,640 |
| – Long to Short Ratio: | 2.3 to 1 | 0.7 to 1 | 1.3 to 1 |
| NET POSITION TREND: | |||
| – Strength Index Score (3 Year Range Pct): | 20.9 | 82.9 | 36.7 |
| – Strength Index Reading (3 Year Range): | Bearish | Bullish-Extreme | Bearish |
| NET POSITION MOVEMENT INDEX: | |||
| – 6-Week Change in Strength Index: | -1.2 | 7.1 | -35.4 |
#2 Heating Oil NY-Harbor Futures:
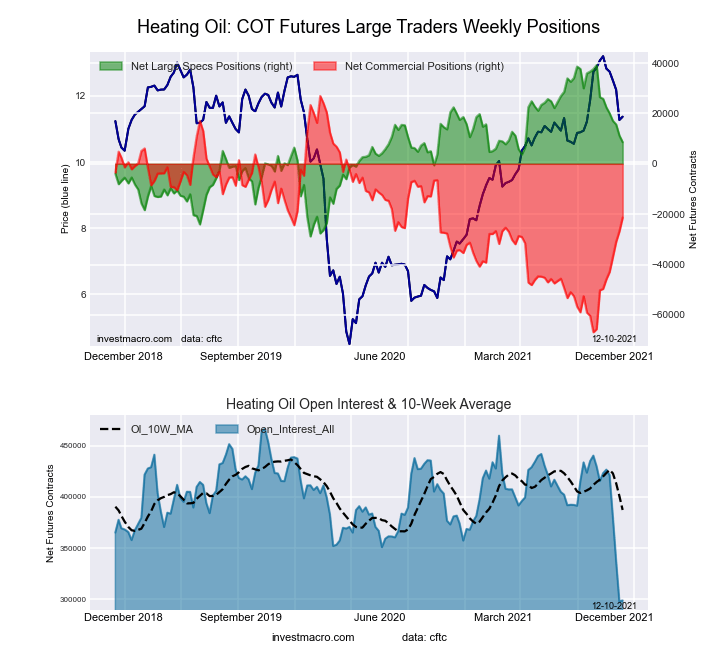 The #2 Heating Oil NY-Harbor Futures large speculator standing this week was a net position of 8,597 contracts in the data reported through Tuesday. This was a weekly decline of -2,628 contracts from the previous week which had a total of 11,225 net contracts.
This week’s current strength score (the trader positioning range over the past three years, measured from 0 to 100) shows the speculators are currently Bullish with a score of 55.1 percent. The commercials are Bearish with a score of 48.5 percent and the small traders (not shown in chart) are Bearish with a score of 42.5 percent.
| Heating Oil Futures Statistics | SPECULATORS | COMMERCIALS | SMALL TRADERS |
| – Percent of Open Interest Longs: | 13.3 | 53.4 | 12.9 |
| – Percent of Open Interest Shorts: | 10.5 | 60.6 | 8.7 |
| – Net Position: | 8,597 | -21,351 | 12,754 |
| – Gross Longs: | 39,877 | 159,783 | 38,689 |
| – Gross Shorts: | 31,280 | 181,134 | 25,935 |
| – Long to Short Ratio: | 1.3 to 1 | 0.9 to 1 | 1.5 to 1 |
| NET POSITION TREND: | |||
| – Strength Index Score (3 Year Range Pct): | 55.1 | 48.5 | 42.5 |
| – Strength Index Reading (3 Year Range): | Bullish | Bearish | Bearish |
| NET POSITION MOVEMENT INDEX: | |||
| – 6-Week Change in Strength Index: | -25.3 | 30.2 | -38.4 |
Bloomberg Commodity Index Futures:
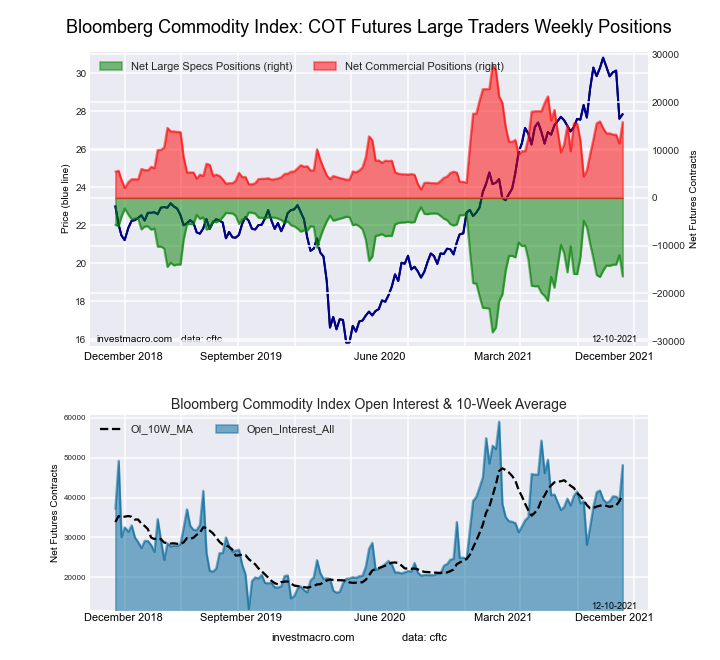 The Bloomberg Commodity Index Futures large speculator standing this week was a net position of -16,421 contracts in the data reported through Tuesday. This was a weekly fall of -4,473 contracts from the previous week which had a total of -11,948 net contracts.
This week’s current strength score (the trader positioning range over the past three years, measured from 0 to 100) shows the speculators are currently Bearish with a score of 44.7 percent. The commercials are Bullish with a score of 54.3 percent and the small traders (not shown in chart) are Bearish with a score of 48.7 percent.
| Bloomberg Index Futures Statistics | SPECULATORS | COMMERCIALS | SMALL TRADERS |
| – Percent of Open Interest Longs: | 59.0 | 37.1 | 1.2 |
| – Percent of Open Interest Shorts: | 93.0 | 4.2 | 0.1 |
| – Net Position: | -16,421 | 15,865 | 556 |
| – Gross Longs: | 28,421 | 17,881 | 597 |
| – Gross Shorts: | 44,842 | 2,016 | 41 |
| – Long to Short Ratio: | 0.6 to 1 | 8.9 to 1 | 14.6 to 1 |
| NET POSITION TREND: | |||
| – Strength Index Score (3 Year Range Pct): | 44.7 | 54.3 | 48.7 |
| – Strength Index Reading (3 Year Range): | Bearish | Bullish | Bearish |
| NET POSITION MOVEMENT INDEX: | |||
| – 6-Week Change in Strength Index: | -4.8 | 5.0 | -2.6 |
Article By InvestMacro – Receive our weekly COT Reports by Email
*COT Report: The COT data, released weekly to the public each Friday, is updated through the most recent Tuesday (data is 3 days old) and shows a quick view of how large speculators or non-commercials (for-profit traders) were positioned in the futures markets.
The CFTC categorizes trader positions according to commercial hedgers (traders who use futures contracts for hedging as part of the business), non-commercials (large traders who speculate to realize trading profits) and nonreportable traders (usually small traders/speculators) as well as their open interest (contracts open in the market at time of reporting).See CFTC criteria here.

- The Tech‑heavy NASDAQ Index jumped by more than 3.3%. The offshore yuan is trading at its highest level since 2023 Jul 31, 2026
- USD/JPY After Volatility: Multiple Events in One Day Jul 31, 2026
- The US indices sell off amid renewed US-Iran clashes. Oil jumps by 7% Jul 30, 2026
- USD/JPY Temporary in Equilibrium: Multiple Factors in Focus Jul 30, 2026
- GBP/USD at Month’s Lows: The Outlook Remains Weak Jul 29, 2026
- Crude oil falls below $80 per barrel. Australia sees inflation slowdown Jul 29, 2026
- The US Tech sector hit by sell‑off. Oil prices decline on renewed negotiations Jul 28, 2026
- Gold Declines, Focus on Fed and Falling Oil Prices Jul 28, 2026
- This week will be one of the most crowded for central‑bank meetings Jul 27, 2026
- EUR/USD Ahead of a Key Week: Holding Near Lows Jul 27, 2026