
By InvestMacro

Here are the latest charts and statistics for the Commitment of Traders (COT) data published by the Commodities Futures Trading Commission (CFTC).
The latest COT data is updated through Tuesday October 25th and shows a quick view of how large traders (for-profit speculators and commercial entities) were positioned in the futures markets.
Copper and Platinum lead Weekly Speculator Changes
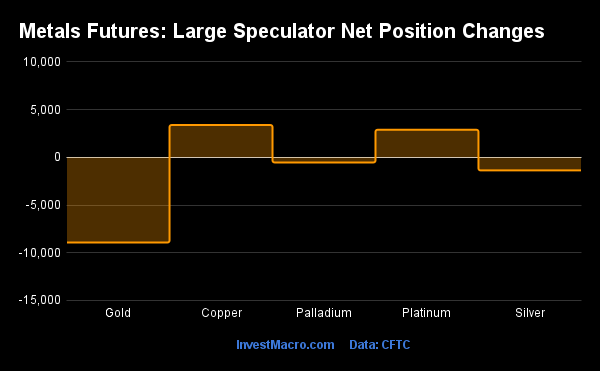
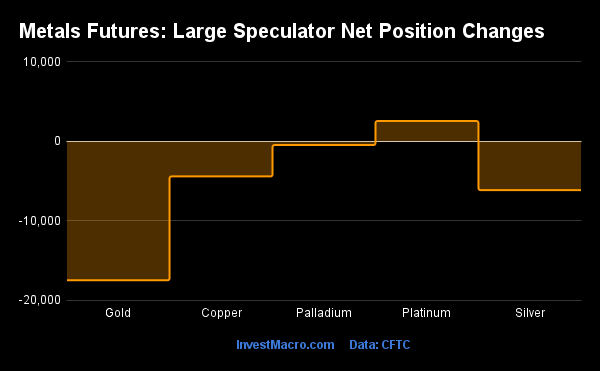
The COT precious metals speculator bets were lower this week as two out of the five metals markets we cover had higher positioning this week while three markets had lower contracts.
Leading the gains for the precious metals markets was Copper (3,383 contracts) with Platinum (2,887 contracts) also showing a positive week.
The metals markets leading the declines in speculator bets this week was Gold (-8,924 contracts) with Silver (-1,368 contracts) and Palladium (-536 contracts) also registering lower bets on the week.
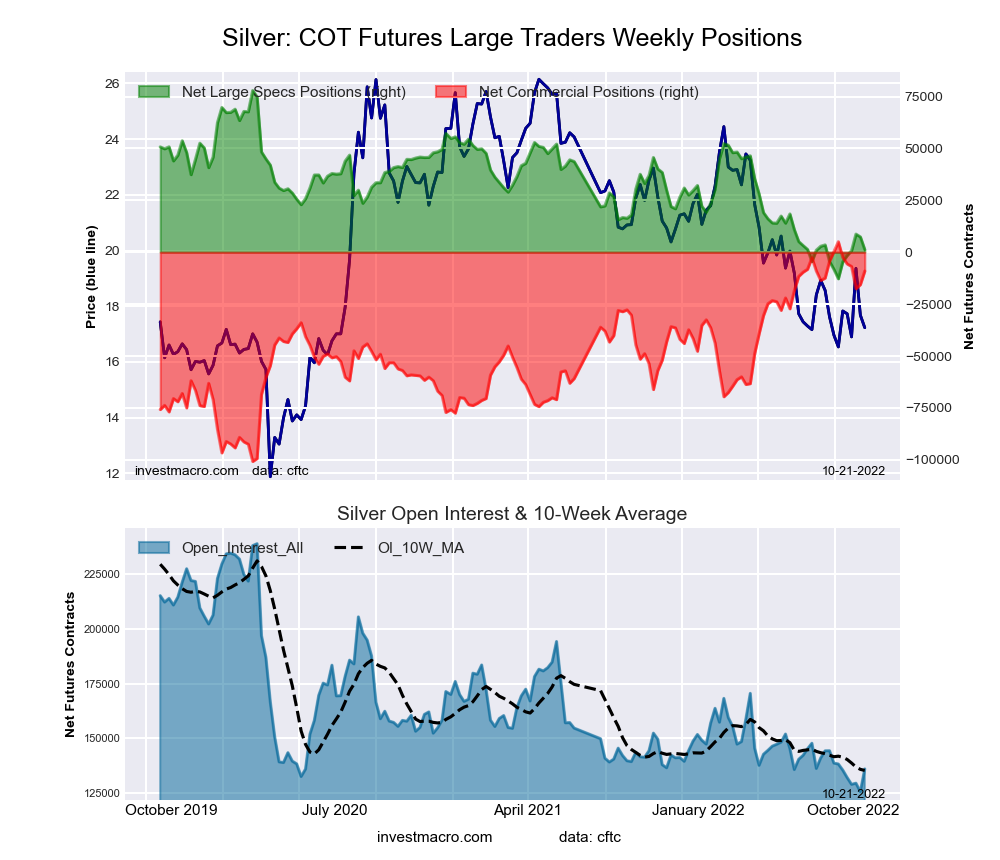
Highlighting the COT metals data this week is the decline in the speculators positions for Silver. The large speculators dropped their Silver bets for the third straight week following gains in the previous four weeks. This has brought the overall net position back into a small bearish standing this week (-101 contracts) for the first time in the past five weeks. Previously, the Silver net positioning had spent five weeks from August 23rd to September 20th in bearish territory before seeing speculator positions improve and regain their bullishness on September 27th.
The Silver price, like the other precious metals, remains under pressure and saw a small decline this week. The futures price trades around the $19.15 level and has been in a range between $18 and $20 over the past three weeks.
| Oct-25-2022 | OI | OI-Index | Spec-Net | Spec-Index | Com-Net | COM-Index | Smalls-Net | Smalls-Index |
|---|---|---|---|---|---|---|---|---|
| WTI Crude | 1,436,942 | 0 | 249,079 | 10 | -268,026 | 92 | 18,947 | 32 |
| Gold | 456,072 | 7 | 68,032 | 5 | -80,213 | 94 | 12,181 | 10 |
| Silver | 139,085 | 12 | -101 | 14 | -8,857 | 87 | 8,958 | 14 |
| Copper | 179,344 | 17 | -16,919 | 23 | 15,907 | 79 | 1,012 | 31 |
| Palladium | 7,343 | 7 | -1,745 | 14 | 2,228 | 87 | -483 | 13 |
| Platinum | 56,117 | 15 | 11,381 | 24 | -14,971 | 77 | 3,590 | 16 |
| Natural Gas | 970,872 | 5 | -151,766 | 33 | 133,397 | 73 | 18,369 | 24 |
| Brent | 166,931 | 14 | -40,301 | 44 | 36,912 | 55 | 3,389 | 55 |
| Heating Oil | 272,663 | 25 | 20,411 | 72 | -38,238 | 31 | 17,827 | 60 |
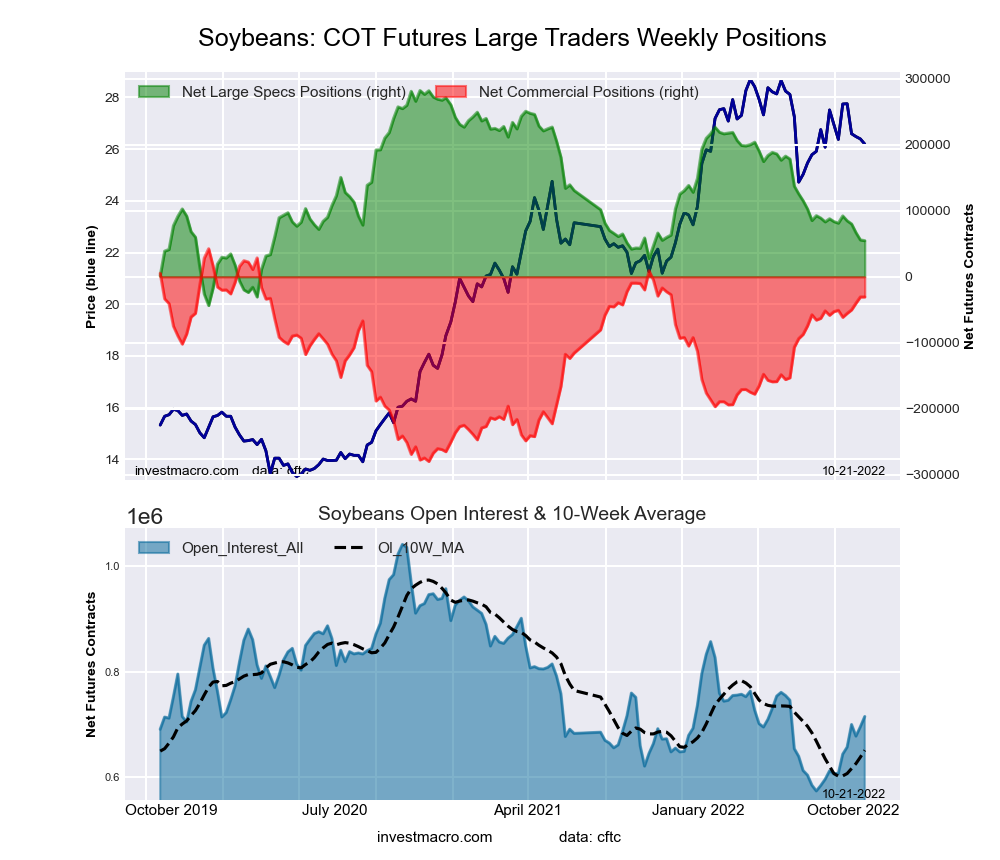
| Soybeans | 651,685 | 17 | 57,385 | 31 | -35,301 | 76 | -22,084 | 34 |
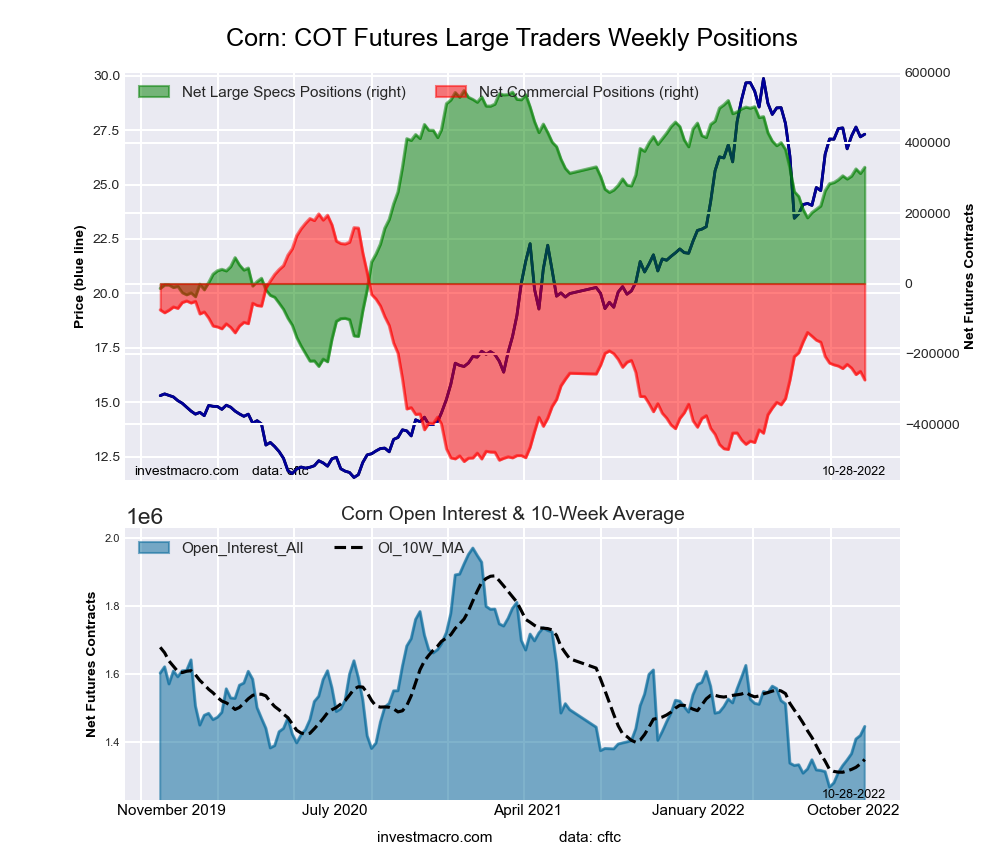
| Corn | 1,445,842 | 25 | 329,784 | 72 | -273,645 | 33 | -56,139 | 11 |
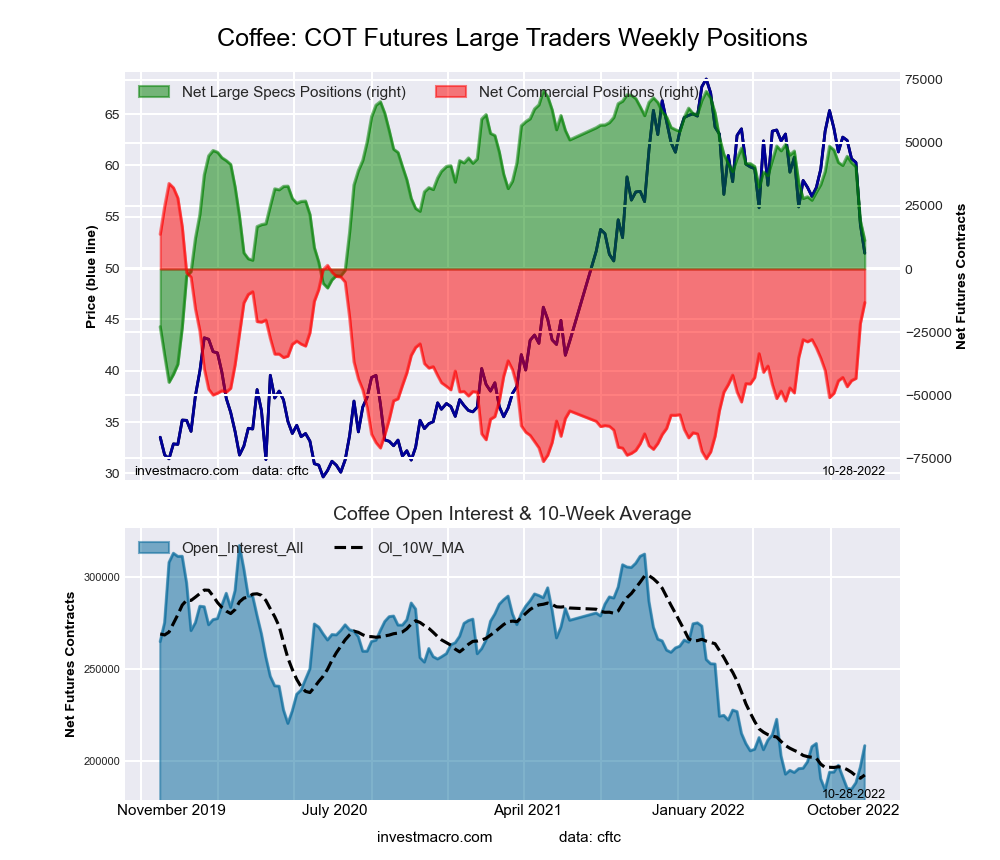
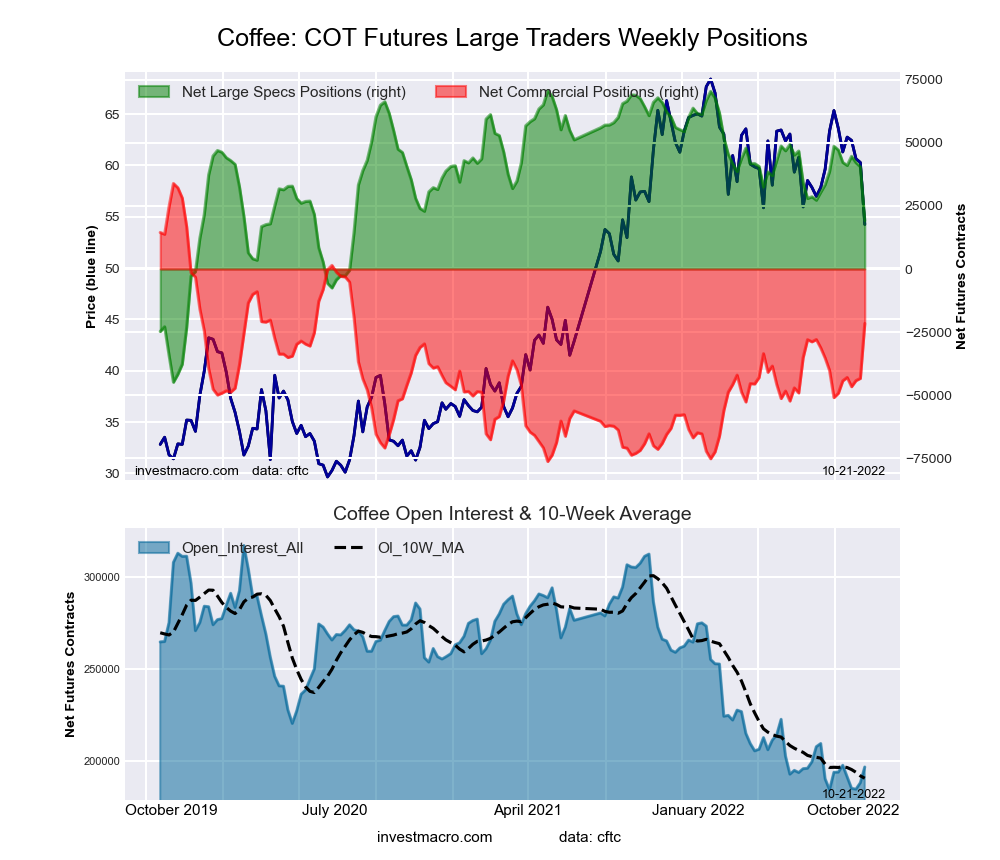
| Coffee | 208,280 | 18 | 11,351 | 37 | -13,326 | 68 | 1,975 | 27 |
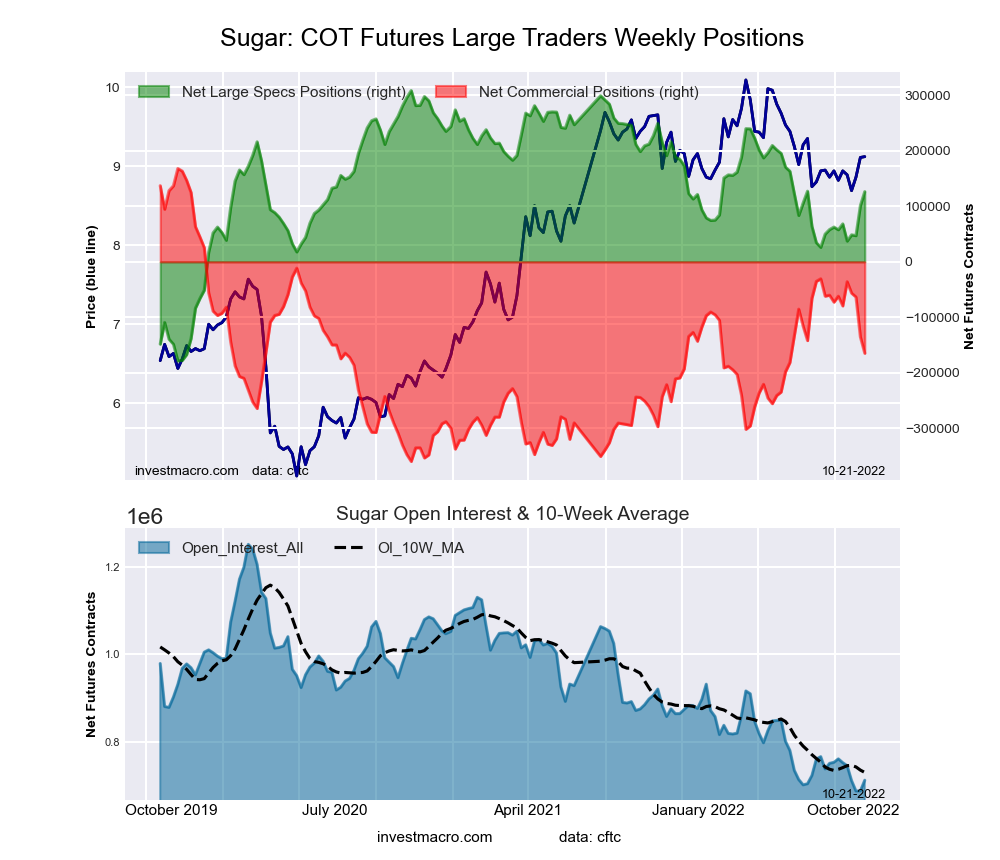
| Sugar | 723,503 | 6 | 111,888 | 59 | -140,147 | 43 | 28,259 | 43 |
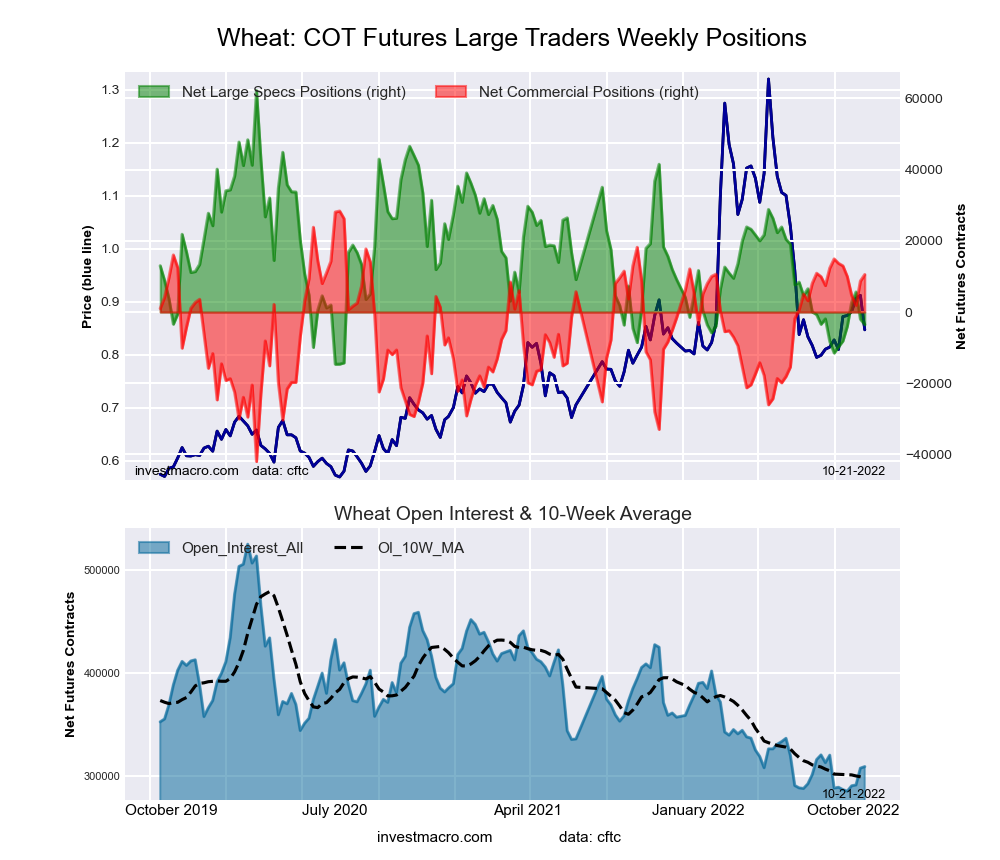
| Wheat | 324,137 | 16 | -12,913 | 2 | 19,896 | 88 | -6,983 | 74 |
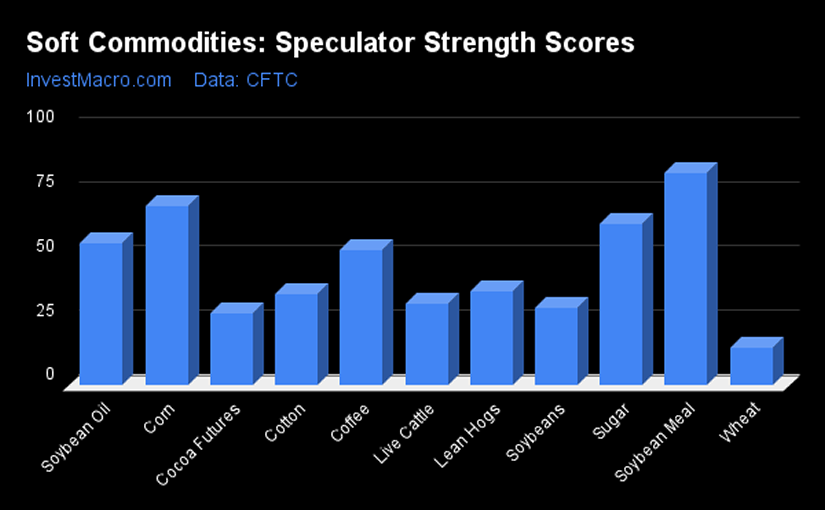
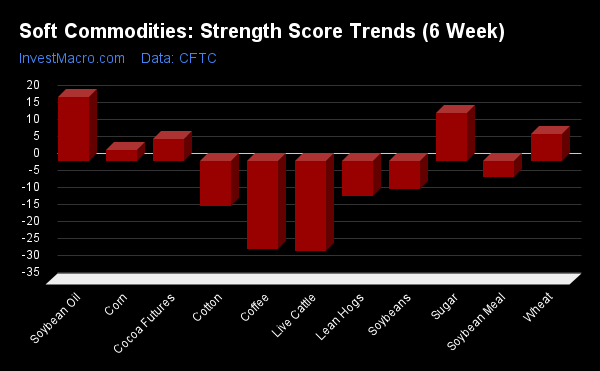
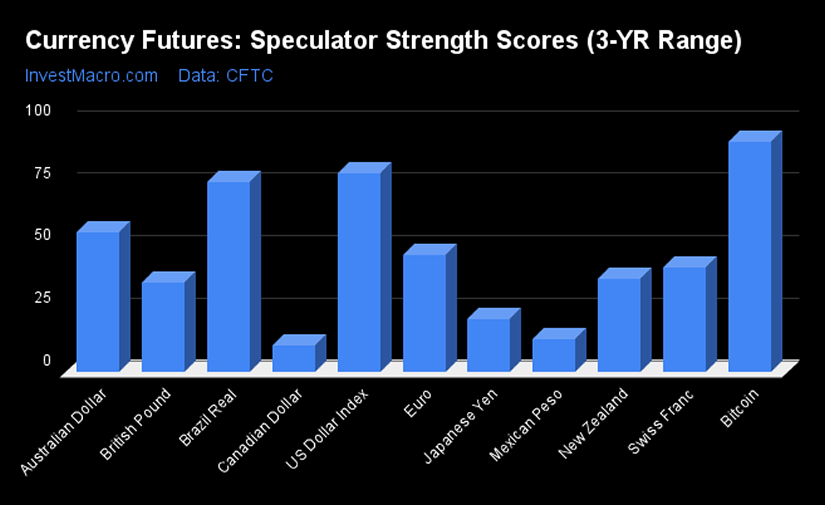
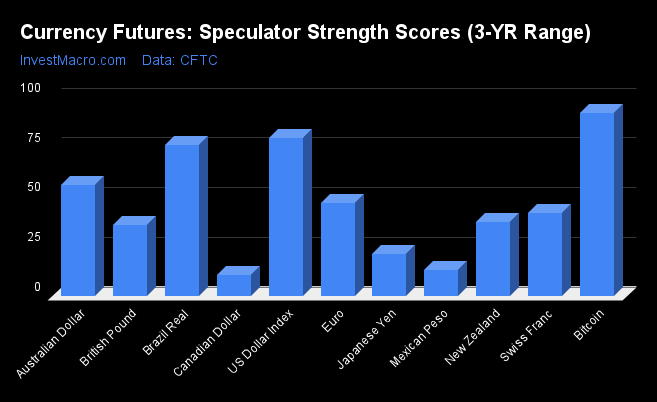
Strength Scores led by Platinum and Copper
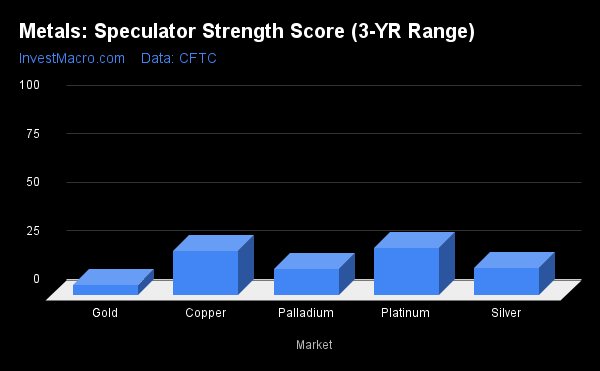
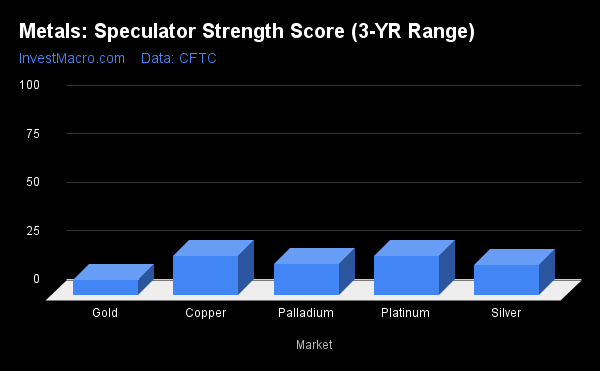
Strength scores (a measure of the 3-Year range of Speculator positions, from 0 to 100 where above 80 is extreme bullish and below 20 is extreme bearish) show that Platinum (24.4 percent) and Copper (22.9 percent) lead the metals category.
On the downside, Gold (5.3 percent), Palladium (13.6 percent) and Silver (14.0 percent) are at the lowest strength levels currently and all are in extreme bearish positions (below 20 percent).
Strength Statistics:
Gold (5.3 percent) vs Gold previous week (8.2 percent)
Silver (14.0 percent) vs Silver previous week (15.5 percent)
Copper (22.9 percent) vs Copper previous week (20.2 percent)
Platinum (24.4 percent) vs Platinum previous week (20.5 percent)
Palladium (13.6 percent) vs Palladium previous week (16.7 percent)
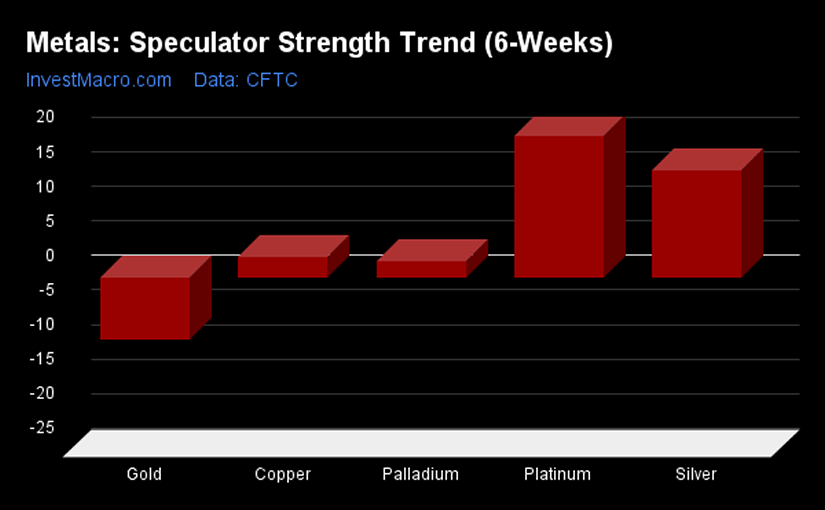
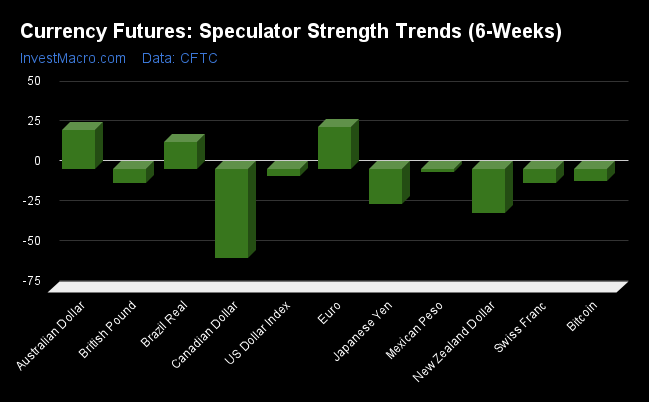
Platinum leads the Strength Trends
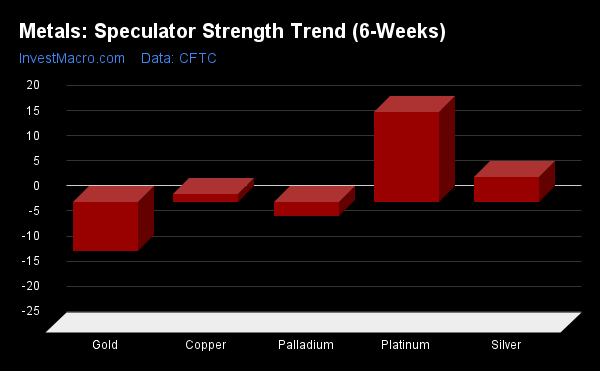
Strength Score Trends (or move index, calculates the 6-week changes in strength scores) show that Platinum (17.8 percent) leads the past six weeks trends for metals this week. Silver (5.0 percent) and Copper (1.6 percent) fill out the other positive movers in the latest trends data.
Gold (-9.7 percent) leads the downside trend scores currently while the next market with lower trend scores was Palladium (-2.8 percent).
Move Statistics:
Gold (-9.7 percent) vs Gold previous week (-8.9 percent)
Silver (5.0 percent) vs Silver previous week (15.5 percent)
Copper (1.6 percent) vs Copper previous week (2.9 percent)
Platinum (17.8 percent) vs Platinum previous week (20.5 percent)
Palladium (-2.8 percent) vs Palladium previous week (2.3 percent)
Individual Markets:
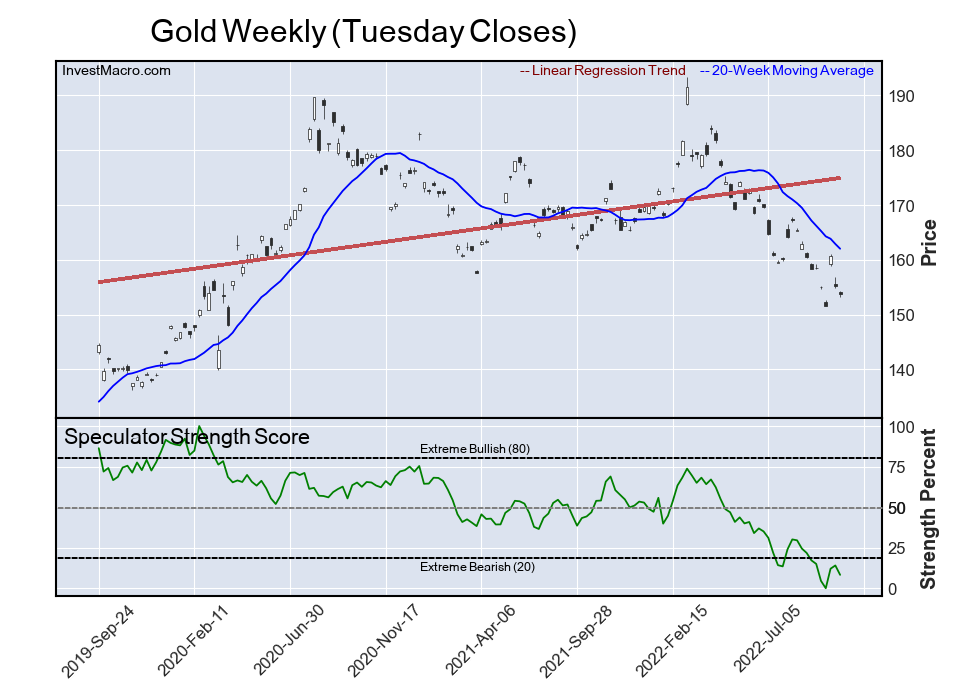
Gold Comex Futures:
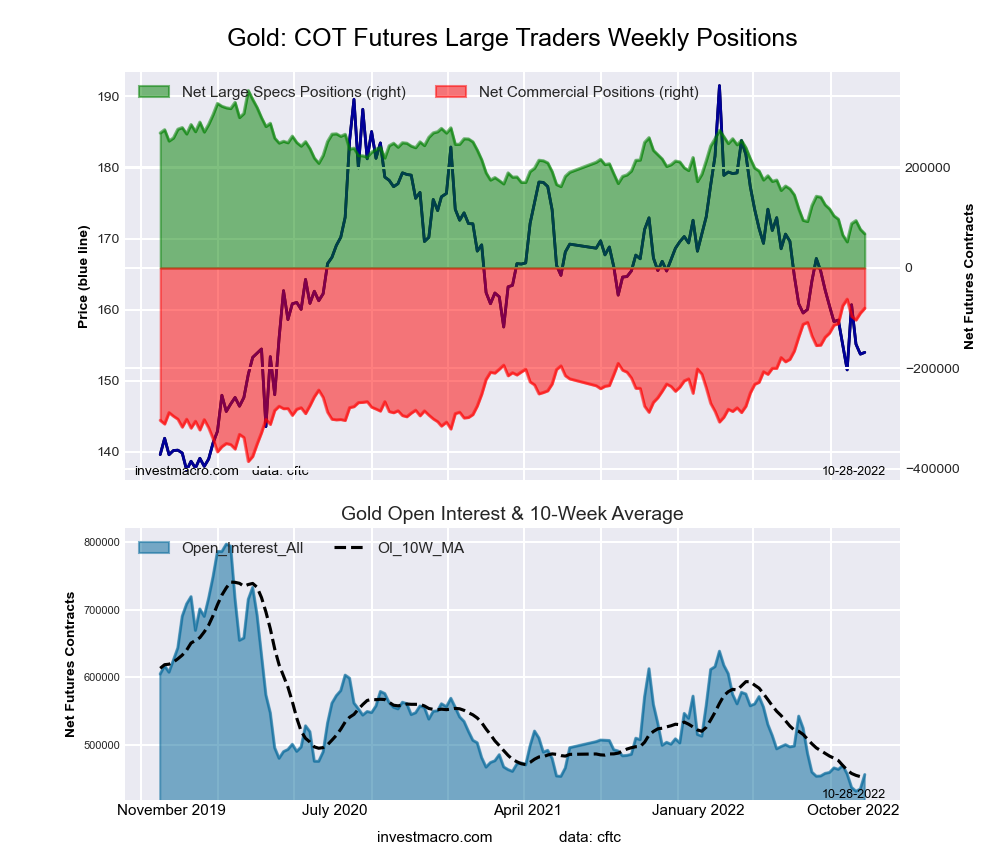 The Gold Comex Futures large speculator standing this week reached a net position of 68,032 contracts in the data reported through Tuesday. This was a weekly lowering of -8,924 contracts from the previous week which had a total of 76,956 net contracts.
This week’s current strength score (the trader positioning range over the past three years, measured from 0 to 100) shows the speculators are currently Bearish-Extreme with a score of 5.3 percent. The commercials are Bullish-Extreme with a score of 94.4 percent and the small traders (not shown in chart) are Bearish-Extreme with a score of 10.1 percent.
| Gold Futures Statistics | SPECULATORS | COMMERCIALS | SMALL TRADERS |
| – Percent of Open Interest Longs: | 46.7 | 27.0 | 8.7 |
| – Percent of Open Interest Shorts: | 31.8 | 44.6 | 6.0 |
| – Net Position: | 68,032 | -80,213 | 12,181 |
| – Gross Longs: | 212,853 | 123,085 | 39,637 |
| – Gross Shorts: | 144,821 | 203,298 | 27,456 |
| – Long to Short Ratio: | 1.5 to 1 | 0.6 to 1 | 1.4 to 1 |
| NET POSITION TREND: | |||
| – Strength Index Score (3 Year Range Pct): | 5.3 | 94.4 | 10.1 |
| – Strength Index Reading (3 Year Range): | Bearish-Extreme | Bullish-Extreme | Bearish-Extreme |
| NET POSITION MOVEMENT INDEX: | |||
| – 6-Week Change in Strength Index: | -9.7 | 9.5 | -3.6 |
Silver Comex Futures:
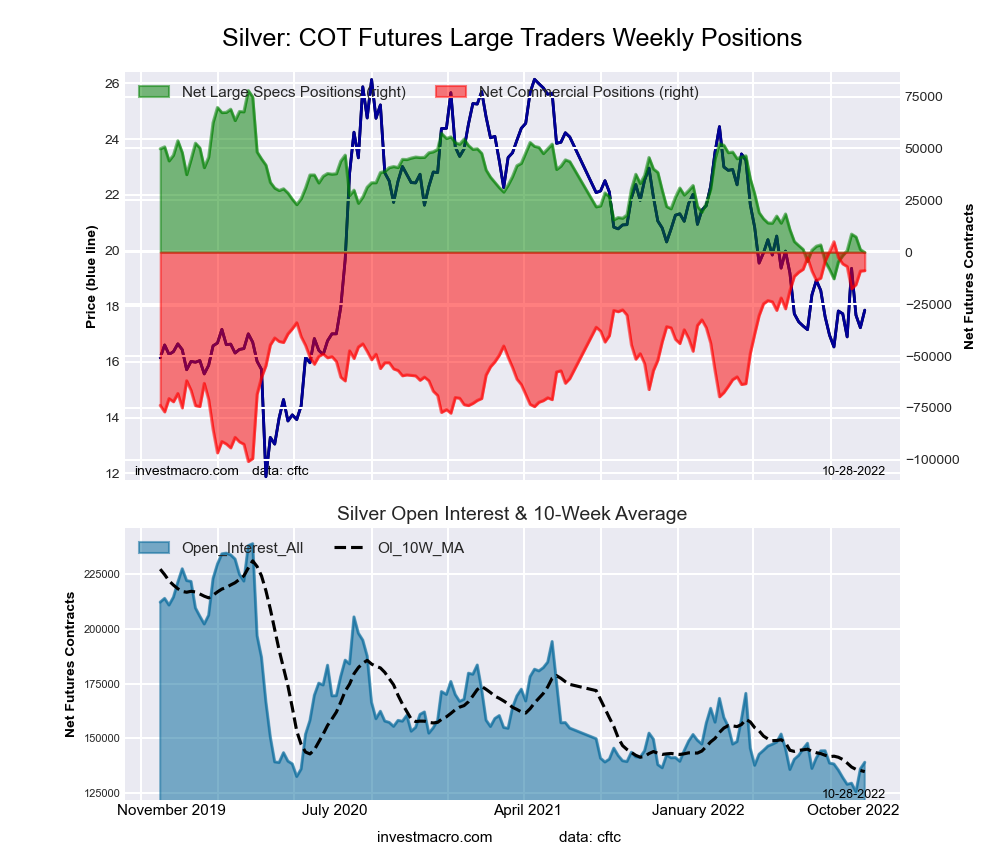 The Silver Comex Futures large speculator standing this week reached a net position of -101 contracts in the data reported through Tuesday. This was a weekly reduction of -1,368 contracts from the previous week which had a total of 1,267 net contracts.
This week’s current strength score (the trader positioning range over the past three years, measured from 0 to 100) shows the speculators are currently Bearish-Extreme with a score of 14.0 percent. The commercials are Bullish-Extreme with a score of 86.9 percent and the small traders (not shown in chart) are Bearish-Extreme with a score of 13.7 percent.
| Silver Futures Statistics | SPECULATORS | COMMERCIALS | SMALL TRADERS |
| – Percent of Open Interest Longs: | 36.8 | 38.1 | 16.1 |
| – Percent of Open Interest Shorts: | 36.9 | 44.4 | 9.6 |
| – Net Position: | -101 | -8,857 | 8,958 |
| – Gross Longs: | 51,163 | 52,952 | 22,331 |
| – Gross Shorts: | 51,264 | 61,809 | 13,373 |
| – Long to Short Ratio: | 1.0 to 1 | 0.9 to 1 | 1.7 to 1 |
| NET POSITION TREND: | |||
| – Strength Index Score (3 Year Range Pct): | 14.0 | 86.9 | 13.7 |
| – Strength Index Reading (3 Year Range): | Bearish-Extreme | Bullish-Extreme | Bearish-Extreme |
| NET POSITION MOVEMENT INDEX: | |||
| – 6-Week Change in Strength Index: | 5.0 | -6.0 | 8.5 |
Copper Grade #1 Futures:
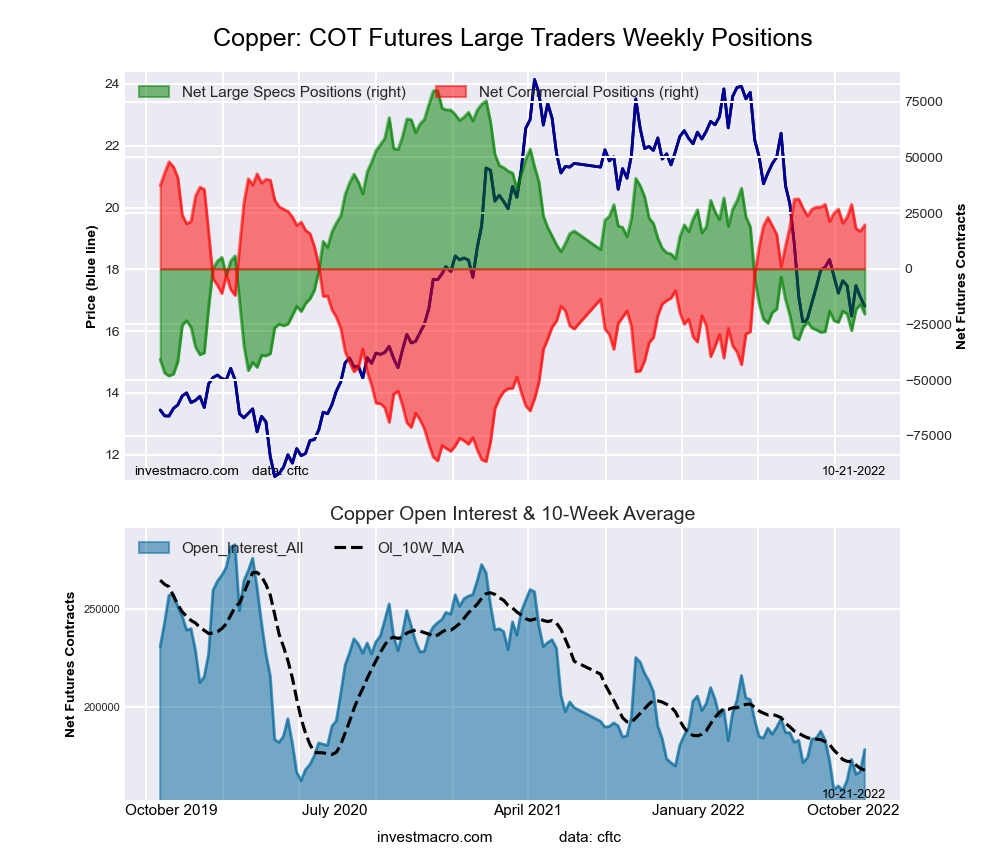
 The Copper Grade #1 Futures large speculator standing this week reached a net position of -16,919 contracts in the data reported through Tuesday. This was a weekly increase of 3,383 contracts from the previous week which had a total of -20,302 net contracts.
This week’s current strength score (the trader positioning range over the past three years, measured from 0 to 100) shows the speculators are currently Bearish with a score of 22.9 percent. The commercials are Bullish with a score of 79.3 percent and the small traders (not shown in chart) are Bearish with a score of 31.1 percent.
| Copper Futures Statistics | SPECULATORS | COMMERCIALS | SMALL TRADERS |
| – Percent of Open Interest Longs: | 27.9 | 44.5 | 8.6 |
| – Percent of Open Interest Shorts: | 37.3 | 35.6 | 8.0 |
| – Net Position: | -16,919 | 15,907 | 1,012 |
| – Gross Longs: | 50,000 | 79,742 | 15,339 |
| – Gross Shorts: | 66,919 | 63,835 | 14,327 |
| – Long to Short Ratio: | 0.7 to 1 | 1.2 to 1 | 1.1 to 1 |
| NET POSITION TREND: | |||
| – Strength Index Score (3 Year Range Pct): | 22.9 | 79.3 | 31.1 |
| – Strength Index Reading (3 Year Range): | Bearish | Bullish | Bearish |
| NET POSITION MOVEMENT INDEX: | |||
| – 6-Week Change in Strength Index: | 1.6 | -3.6 | 14.7 |
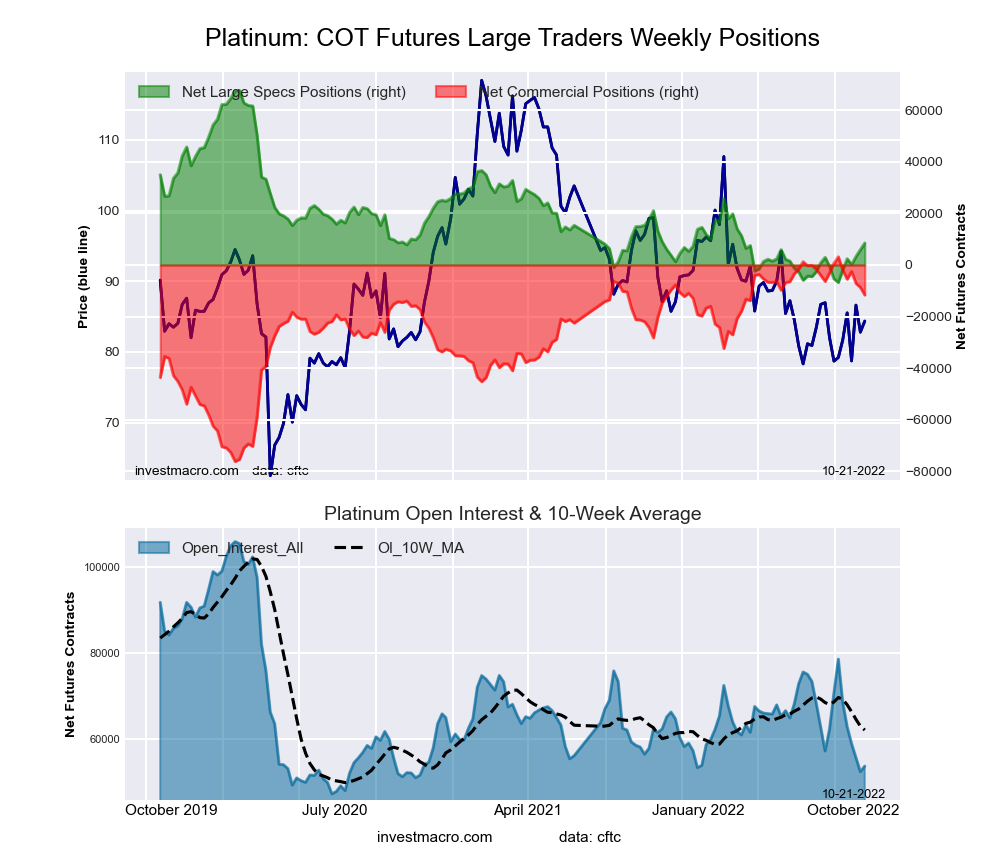
Platinum Futures:
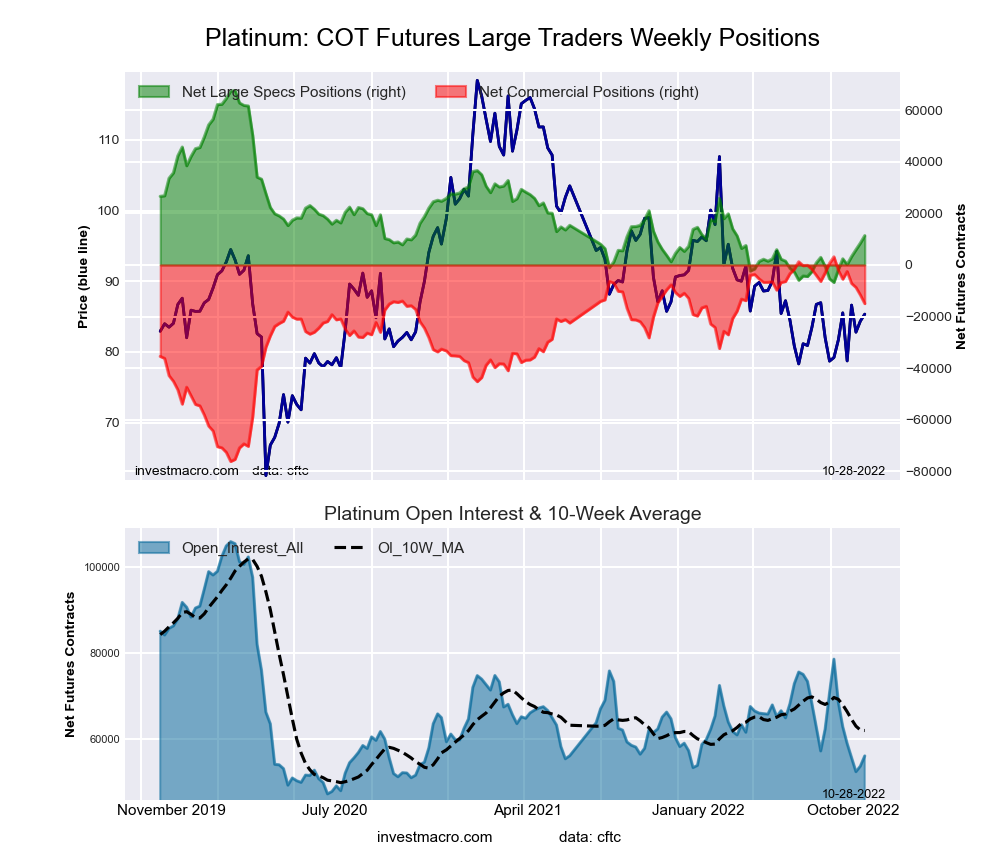 The Platinum Futures large speculator standing this week reached a net position of 11,381 contracts in the data reported through Tuesday. This was a weekly boost of 2,887 contracts from the previous week which had a total of 8,494 net contracts.
This week’s current strength score (the trader positioning range over the past three years, measured from 0 to 100) shows the speculators are currently Bearish with a score of 24.4 percent. The commercials are Bullish with a score of 77.1 percent and the small traders (not shown in chart) are Bearish-Extreme with a score of 16.3 percent.
| Platinum Futures Statistics | SPECULATORS | COMMERCIALS | SMALL TRADERS |
| – Percent of Open Interest Longs: | 50.7 | 33.3 | 12.2 |
| – Percent of Open Interest Shorts: | 30.5 | 60.0 | 5.8 |
| – Net Position: | 11,381 | -14,971 | 3,590 |
| – Gross Longs: | 28,471 | 18,686 | 6,825 |
| – Gross Shorts: | 17,090 | 33,657 | 3,235 |
| – Long to Short Ratio: | 1.7 to 1 | 0.6 to 1 | 2.1 to 1 |
| NET POSITION TREND: | |||
| – Strength Index Score (3 Year Range Pct): | 24.4 | 77.1 | 16.3 |
| – Strength Index Reading (3 Year Range): | Bearish | Bullish | Bearish-Extreme |
| NET POSITION MOVEMENT INDEX: | |||
| – 6-Week Change in Strength Index: | 17.8 | -16.3 | -4.5 |
Palladium Futures:
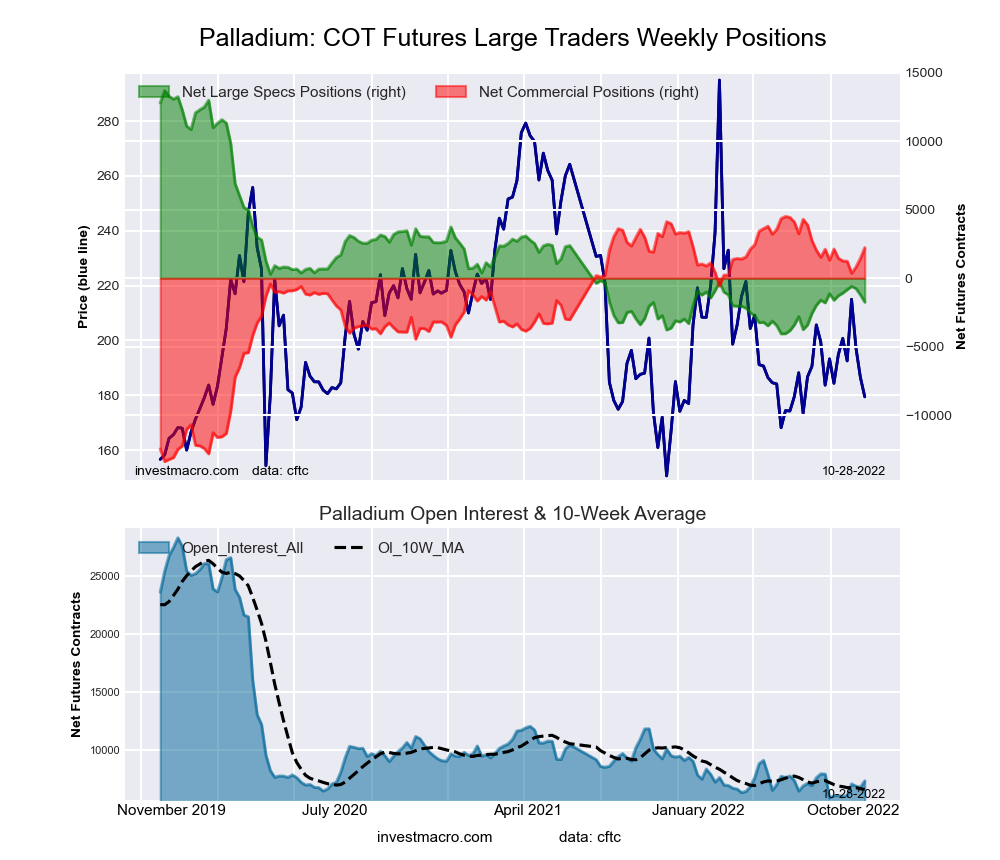 The Palladium Futures large speculator standing this week reached a net position of -1,745 contracts in the data reported through Tuesday. This was a weekly reduction of -536 contracts from the previous week which had a total of -1,209 net contracts.
This week’s current strength score (the trader positioning range over the past three years, measured from 0 to 100) shows the speculators are currently Bearish-Extreme with a score of 13.6 percent. The commercials are Bullish-Extreme with a score of 86.8 percent and the small traders (not shown in chart) are Bearish-Extreme with a score of 12.7 percent.
| Palladium Futures Statistics | SPECULATORS | COMMERCIALS | SMALL TRADERS |
| – Percent of Open Interest Longs: | 22.0 | 60.0 | 14.6 |
| – Percent of Open Interest Shorts: | 45.8 | 29.6 | 21.2 |
| – Net Position: | -1,745 | 2,228 | -483 |
| – Gross Longs: | 1,618 | 4,403 | 1,074 |
| – Gross Shorts: | 3,363 | 2,175 | 1,557 |
| – Long to Short Ratio: | 0.5 to 1 | 2.0 to 1 | 0.7 to 1 |
| NET POSITION TREND: | |||
| – Strength Index Score (3 Year Range Pct): | 13.6 | 86.8 | 12.7 |
| – Strength Index Reading (3 Year Range): | Bearish-Extreme | Bullish-Extreme | Bearish-Extreme |
| NET POSITION MOVEMENT INDEX: | |||
| – 6-Week Change in Strength Index: | -2.8 | 4.5 | -18.1 |
Article By InvestMacro – Receive our weekly COT Newsletter
*COT Report: The COT data, released weekly to the public each Friday, is updated through the most recent Tuesday (data is 3 days old) and shows a quick view of how large speculators or non-commercials (for-profit traders) were positioned in the futures markets.
The CFTC categorizes trader positions according to commercial hedgers (traders who use futures contracts for hedging as part of the business), non-commercials (large traders who speculate to realize trading profits) and nonreportable traders (usually small traders/speculators) as well as their open interest (contracts open in the market at time of reporting). See CFTC criteria here.


