
By InvestMacro
Here are the latest charts and statistics for the Commitment of Traders (COT) data published by the Commodities Futures Trading Commission (CFTC).
The latest COT data is updated through Tuesday September 27th and shows a quick view of how large traders (for-profit speculators and commercial entities) were positioned in the futures markets.
Weekly Speculator Changes led by S&P500 Mini and Nikkei 225
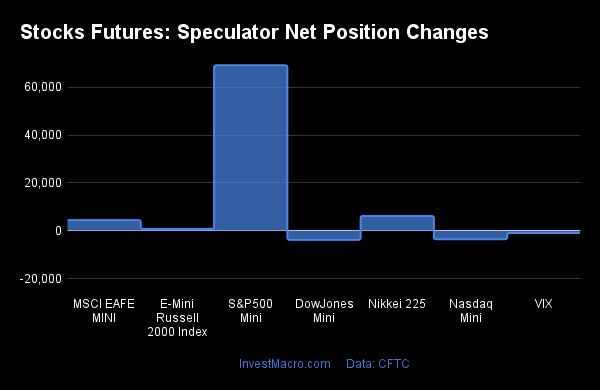
The COT stock market speculator bets were slightly higher this week as four out of the seven stock markets we cover had higher positioning on the week while the other three markets had lower contracts.
Free Reports:
 Sign Up for Our Stock Market Newsletter – Get updated on News, Charts & Rankings of Public Companies when you join our Stocks Newsletter
 Get our Weekly Commitment of Traders Reports - See where the biggest traders (Hedge Funds and Commercial Hedgers) are positioned in the futures markets on a weekly basis.
Leading the gains for stock markets was the S&P500 Mini (69,250 contracts) with the Nikkei 225 USD (6,161 contracts), MSCI EAFE Mini (4,434 contracts) and the Russell 2000 Mini (777 contracts) also showing positive weeks.
The stock markets leading the declines in speculator bets this week were the Dow Jones Industrial Average Mini (-3,796 contracts), Nasdaq Mini (-3,533 contracts) and the VIX (-926 contracts).
Highlighting the COT Stocks data this week is another week of big moves in the SP500-Mini speculator contracts. The SP500-Mini speculator bets rebounded sharply for a second straight week and gained by more than +60,000 contracts for the second consecutive week. The past 2-week rise in speculator bets now totals +130,803 contracts. The SP500-Mini speculator position is now below the -200,000 contracts for the first time since July 5th and at the least bearish level since June 28th. Despite the positive speculator sentiment last week, the SP500 index sold off sharply to end the week and closed at its lowest level since November of 2020.
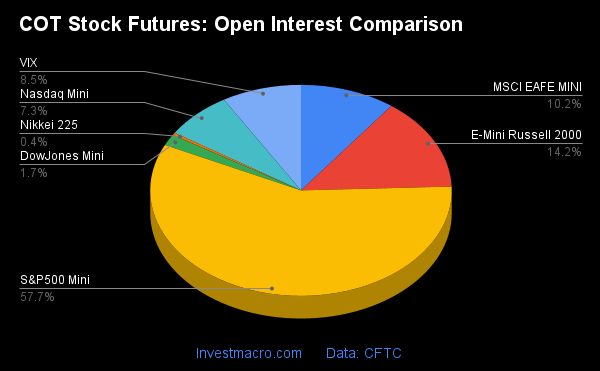
| Sep-27-2022 | OI | OI-Index | Spec-Net | Spec-Index | Com-Net | COM-Index | Smalls-Net | Smalls-Index |
|---|---|---|---|---|---|---|---|---|
| S&P500-Mini | 2,233,878 | 5 | -150,201 | 28 | 232,967 | 81 | -82,766 | 9 |
| Nikkei 225 | 14,070 | 10 | 1,520 | 85 | -1,541 | 22 | 21 | 29 |
| Nasdaq-Mini | 282,054 | 61 | -48 | 75 | 24,473 | 42 | -24,425 | 6 |
| DowJones-Mini | 67,055 | 24 | -19,230 | 14 | 20,428 | 86 | -1,198 | 32 |
| VIX | 331,042 | 36 | -82,724 | 68 | 90,378 | 33 | -7,654 | 54 |
| Nikkei 225 Yen | 43,115 | 19 | -650 | 32 | 14,383 | 67 | -13,733 | 47 |
Strength Scores
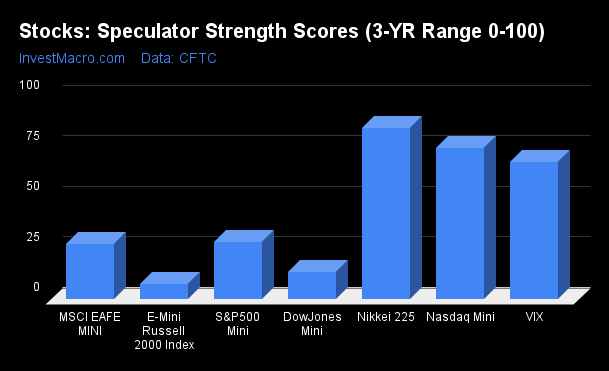
Strength Scores (a normalized measure of Speculator positions over a 3-Year range, from 0 to 100 where above 80 is extreme bullish and below 20 is extreme bearish) showed that the Nikkei USD (84.7 percent) leads the stock markets and is in a bullish extreme position (above 80 percent). The Nasdaq-Mini (75.0 percent) and the VIX (67.8 percent) come in as the next highest stock markets in strength scores.
On the downside, the Russell 2000-Mini (7.8 percent) comes in at the lowest strength level currently and is followed by the DowJones-Mini (13.8 percent) with both being in bearish extreme levels (below 20 percent).
Strength Statistics:
VIX (67.8 percent) vs VIX previous week (68.3 percent)
S&P500-Mini (28.4 percent) vs S&P500-Mini previous week (15.5 percent)
DowJones-Mini (13.8 percent) vs DowJones-Mini previous week (19.3 percent)
Nasdaq-Mini (75.0 percent) vs Nasdaq-Mini previous week (77.0 percent)
Russell2000-Mini (7.8 percent) vs Russell2000-Mini previous week (7.4 percent)
Nikkei USD (84.7 percent) vs Nikkei USD previous week (55.4 percent)
EAFE-Mini (27.3 percent) vs EAFE-Mini previous week (22.4 percent)
Strength Trends
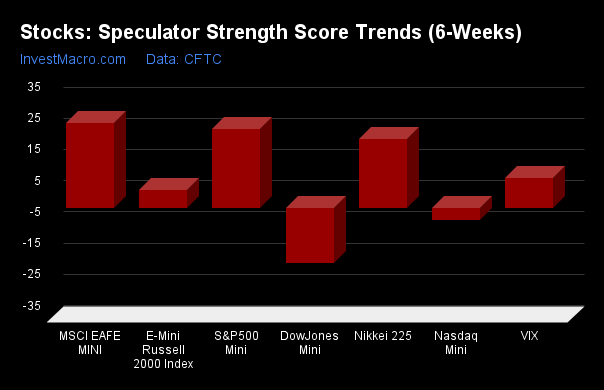
Strength Score Trends (or move index, calculates the 6-week changes in strength scores) showed that the EAFE-Mini (27.3 percent) and the S&P500-Mini (25.5 percent) lead the past six weeks trends for stocks. The Nikkei USD (22.1 percent), the VIX (9.7 percent) and the Russell 2000-Mini (5.8 percent) round out the other positive movers in the latest trends data.
The DowJones-Mini (-17.7 percent) leads the downside trend scores currently while the next market with lower trend scores was the Nasdaq-Mini (-3.9 percent).
Strength Trend Statistics:
VIX (9.7 percent) vs VIX previous week (8.2 percent)
S&P500-Mini (25.5 percent) vs S&P500-Mini previous week (4.6 percent)
DowJones-Mini (-17.7 percent) vs DowJones-Mini previous week (-3.9 percent)
Nasdaq-Mini (-3.9 percent) vs Nasdaq-Mini previous week (-9.8 percent)
Russell2000-Mini (5.8 percent) vs Russell2000-Mini previous week (3.4 percent)
Nikkei USD (22.1 percent) vs Nikkei USD previous week (-12.8 percent)
EAFE-Mini (27.3 percent) vs EAFE-Mini previous week (7.8 percent)
Individual Markets:
VIX Volatility Futures:
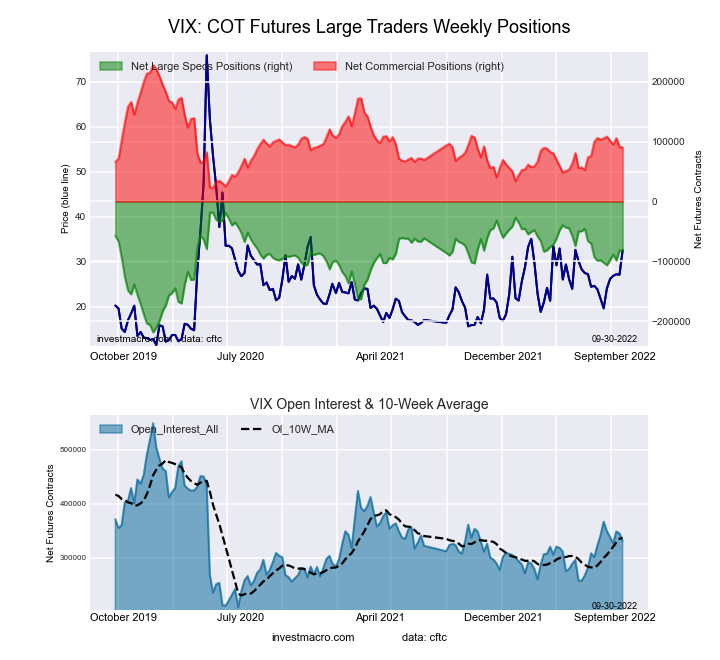 The VIX Volatility large speculator standing this week recorded a net position of -82,724 contracts in the data reported through Tuesday. This was a weekly fall of -926 contracts from the previous week which had a total of -81,798 net contracts.
This week’s current strength score (the trader positioning range over the past three years, measured from 0 to 100) shows the speculators are currently Bullish with a score of 67.8 percent. The commercials are Bearish with a score of 33.1 percent and the small traders (not shown in chart) are Bullish with a score of 54.2 percent.
| VIX Volatility Futures Statistics | SPECULATORS | COMMERCIALS | SMALL TRADERS |
| – Percent of Open Interest Longs: | 17.8 | 55.0 | 7.2 |
| – Percent of Open Interest Shorts: | 42.8 | 27.7 | 9.6 |
| – Net Position: | -82,724 | 90,378 | -7,654 |
| – Gross Longs: | 58,980 | 182,097 | 23,991 |
| – Gross Shorts: | 141,704 | 91,719 | 31,645 |
| – Long to Short Ratio: | 0.4 to 1 | 2.0 to 1 | 0.8 to 1 |
| NET POSITION TREND: | |||
| – Strength Index Score (3 Year Range Pct): | 67.8 | 33.1 | 54.2 |
| – Strength Index Reading (3 Year Range): | Bullish | Bearish | Bullish |
| NET POSITION MOVEMENT INDEX: | |||
| – 6-Week Change in Strength Index: | 9.7 | -7.3 | -22.0 |
S&P500 Mini Futures:
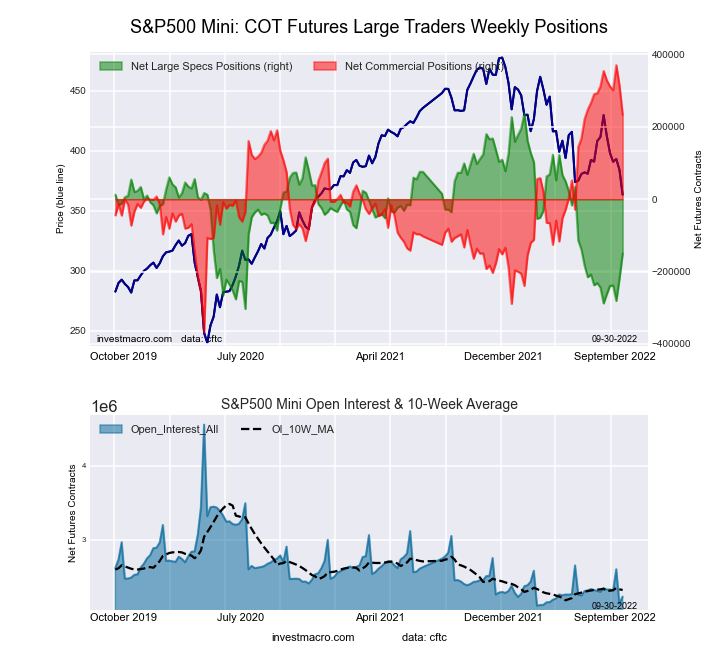 The S&P500 Mini large speculator standing this week recorded a net position of -150,201 contracts in the data reported through Tuesday. This was a weekly boost of 69,250 contracts from the previous week which had a total of -219,451 net contracts.
This week’s current strength score (the trader positioning range over the past three years, measured from 0 to 100) shows the speculators are currently Bearish with a score of 28.4 percent. The commercials are Bullish-Extreme with a score of 81.4 percent and the small traders (not shown in chart) are Bearish-Extreme with a score of 9.0 percent.
| S&P500 Mini Futures Statistics | SPECULATORS | COMMERCIALS | SMALL TRADERS |
| – Percent of Open Interest Longs: | 11.8 | 76.9 | 8.4 |
| – Percent of Open Interest Shorts: | 18.5 | 66.5 | 12.1 |
| – Net Position: | -150,201 | 232,967 | -82,766 |
| – Gross Longs: | 262,797 | 1,717,571 | 186,623 |
| – Gross Shorts: | 412,998 | 1,484,604 | 269,389 |
| – Long to Short Ratio: | 0.6 to 1 | 1.2 to 1 | 0.7 to 1 |
| NET POSITION TREND: | |||
| – Strength Index Score (3 Year Range Pct): | 28.4 | 81.4 | 9.0 |
| – Strength Index Reading (3 Year Range): | Bearish | Bullish-Extreme | Bearish-Extreme |
| NET POSITION MOVEMENT INDEX: | |||
| – 6-Week Change in Strength Index: | 25.5 | -16.4 | -3.5 |
Dow Jones Mini Futures:
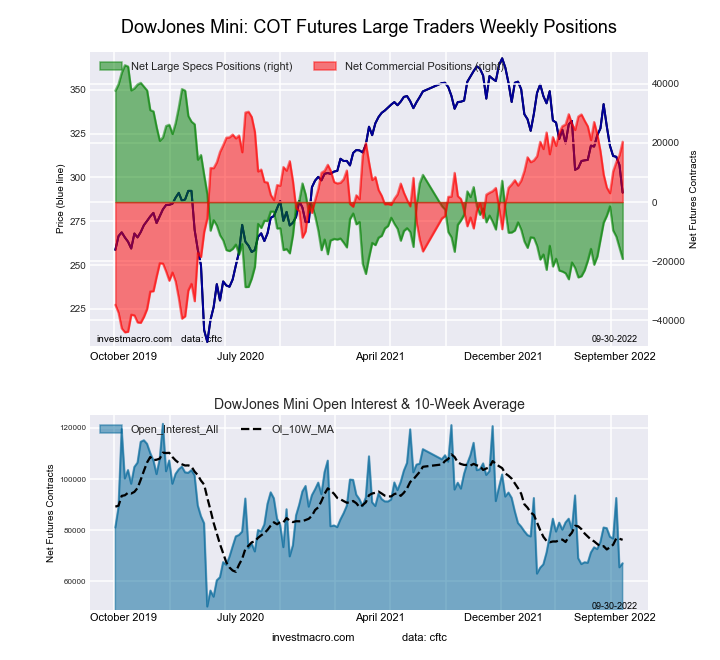 The Dow Jones Mini large speculator standing this week recorded a net position of -19,230 contracts in the data reported through Tuesday. This was a weekly decline of -3,796 contracts from the previous week which had a total of -15,434 net contracts.
This week’s current strength score (the trader positioning range over the past three years, measured from 0 to 100) shows the speculators are currently Bearish-Extreme with a score of 13.8 percent. The commercials are Bullish-Extreme with a score of 85.8 percent and the small traders (not shown in chart) are Bearish with a score of 32.1 percent.
| Dow Jones Mini Futures Statistics | SPECULATORS | COMMERCIALS | SMALL TRADERS |
| – Percent of Open Interest Longs: | 21.3 | 60.6 | 17.3 |
| – Percent of Open Interest Shorts: | 50.0 | 30.1 | 19.1 |
| – Net Position: | -19,230 | 20,428 | -1,198 |
| – Gross Longs: | 14,309 | 40,632 | 11,590 |
| – Gross Shorts: | 33,539 | 20,204 | 12,788 |
| – Long to Short Ratio: | 0.4 to 1 | 2.0 to 1 | 0.9 to 1 |
| NET POSITION TREND: | |||
| – Strength Index Score (3 Year Range Pct): | 13.8 | 85.8 | 32.1 |
| – Strength Index Reading (3 Year Range): | Bearish-Extreme | Bullish-Extreme | Bearish |
| NET POSITION MOVEMENT INDEX: | |||
| – 6-Week Change in Strength Index: | -17.7 | 15.5 | 6.4 |
Nasdaq Mini Futures:
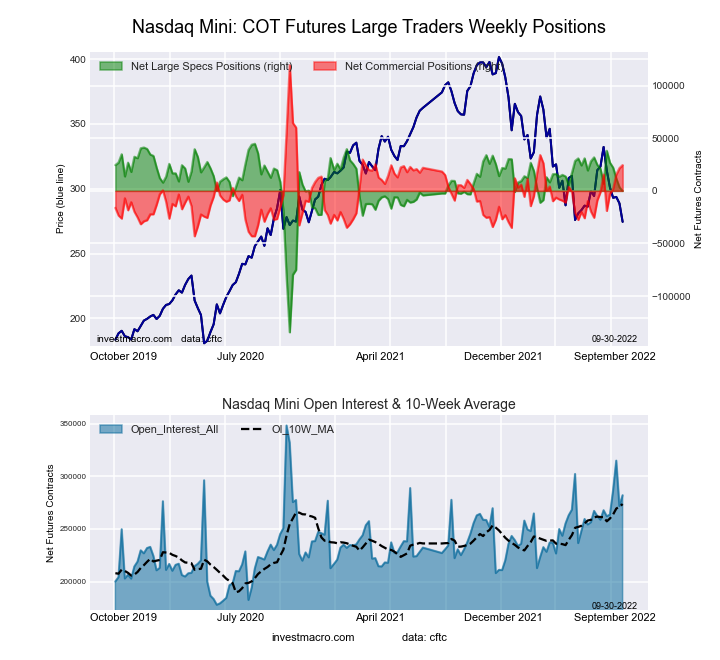 The Nasdaq Mini large speculator standing this week recorded a net position of -48 contracts in the data reported through Tuesday. This was a weekly fall of -3,533 contracts from the previous week which had a total of 3,485 net contracts.
This week’s current strength score (the trader positioning range over the past three years, measured from 0 to 100) shows the speculators are currently Bullish with a score of 75.0 percent. The commercials are Bearish with a score of 41.6 percent and the small traders (not shown in chart) are Bearish-Extreme with a score of 5.6 percent.
| Nasdaq Mini Futures Statistics | SPECULATORS | COMMERCIALS | SMALL TRADERS |
| – Percent of Open Interest Longs: | 26.5 | 60.4 | 11.6 |
| – Percent of Open Interest Shorts: | 26.5 | 51.7 | 20.3 |
| – Net Position: | -48 | 24,473 | -24,425 |
| – Gross Longs: | 74,731 | 170,352 | 32,818 |
| – Gross Shorts: | 74,779 | 145,879 | 57,243 |
| – Long to Short Ratio: | 1.0 to 1 | 1.2 to 1 | 0.6 to 1 |
| NET POSITION TREND: | |||
| – Strength Index Score (3 Year Range Pct): | 75.0 | 41.6 | 5.6 |
| – Strength Index Reading (3 Year Range): | Bullish | Bearish | Bearish-Extreme |
| NET POSITION MOVEMENT INDEX: | |||
| – 6-Week Change in Strength Index: | -3.9 | 5.5 | -3.9 |
Russell 2000 Mini Futures:
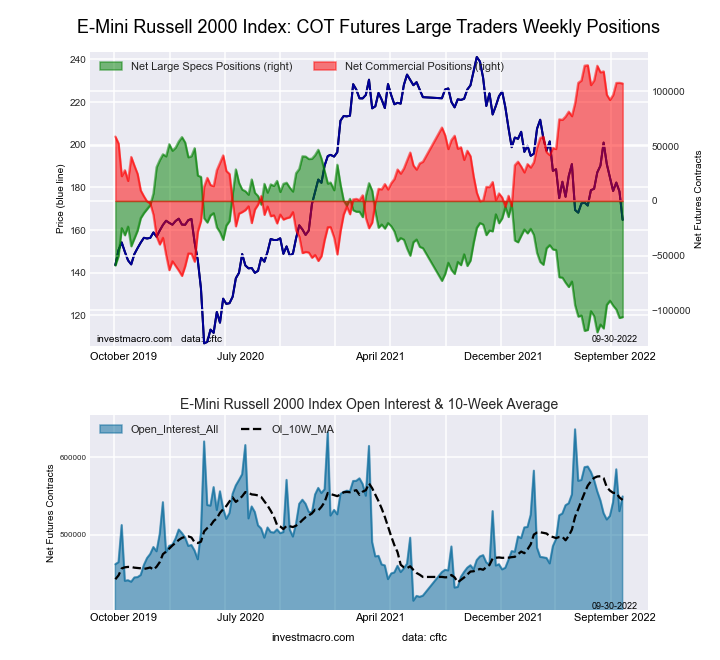 The Russell 2000 Mini large speculator standing this week recorded a net position of -106,061 contracts in the data reported through Tuesday. This was a weekly advance of 777 contracts from the previous week which had a total of -106,838 net contracts.
This week’s current strength score (the trader positioning range over the past three years, measured from 0 to 100) shows the speculators are currently Bearish-Extreme with a score of 7.8 percent. The commercials are Bullish-Extreme with a score of 91.3 percent and the small traders (not shown in chart) are Bearish with a score of 23.5 percent.
| Russell 2000 Mini Futures Statistics | SPECULATORS | COMMERCIALS | SMALL TRADERS |
| – Percent of Open Interest Longs: | 7.9 | 87.3 | 3.8 |
| – Percent of Open Interest Shorts: | 27.2 | 67.8 | 4.0 |
| – Net Position: | -106,061 | 107,336 | -1,275 |
| – Gross Longs: | 43,291 | 479,622 | 20,778 |
| – Gross Shorts: | 149,352 | 372,286 | 22,053 |
| – Long to Short Ratio: | 0.3 to 1 | 1.3 to 1 | 0.9 to 1 |
| NET POSITION TREND: | |||
| – Strength Index Score (3 Year Range Pct): | 7.8 | 91.3 | 23.5 |
| – Strength Index Reading (3 Year Range): | Bearish-Extreme | Bullish-Extreme | Bearish |
| NET POSITION MOVEMENT INDEX: | |||
| – 6-Week Change in Strength Index: | 5.8 | -5.7 | 1.9 |
Nikkei Stock Average (USD) Futures:
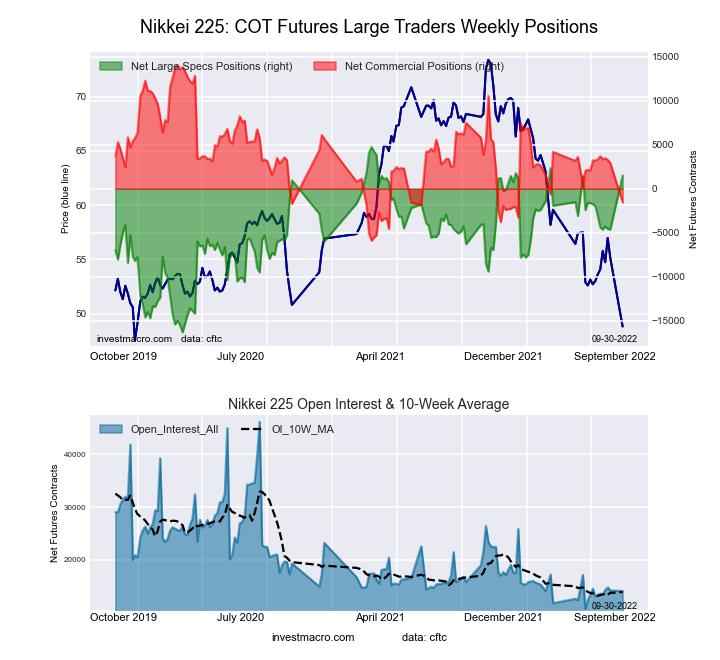 The Nikkei Stock Average (USD) large speculator standing this week recorded a net position of 1,520 contracts in the data reported through Tuesday. This was a weekly gain of 6,161 contracts from the previous week which had a total of -4,641 net contracts.
This week’s current strength score (the trader positioning range over the past three years, measured from 0 to 100) shows the speculators are currently Bullish-Extreme with a score of 84.7 percent. The commercials are Bearish with a score of 21.9 percent and the small traders (not shown in chart) are Bearish with a score of 28.6 percent.
| Nikkei Stock Average Futures Statistics | SPECULATORS | COMMERCIALS | SMALL TRADERS |
| – Percent of Open Interest Longs: | 34.5 | 46.7 | 18.6 |
| – Percent of Open Interest Shorts: | 23.7 | 57.6 | 18.4 |
| – Net Position: | 1,520 | -1,541 | 21 |
| – Gross Longs: | 4,860 | 6,569 | 2,611 |
| – Gross Shorts: | 3,340 | 8,110 | 2,590 |
| – Long to Short Ratio: | 1.5 to 1 | 0.8 to 1 | 1.0 to 1 |
| NET POSITION TREND: | |||
| – Strength Index Score (3 Year Range Pct): | 84.7 | 21.9 | 28.6 |
| – Strength Index Reading (3 Year Range): | Bullish-Extreme | Bearish | Bearish |
| NET POSITION MOVEMENT INDEX: | |||
| – 6-Week Change in Strength Index: | 22.1 | -24.5 | 3.0 |
MSCI EAFE Mini Futures:
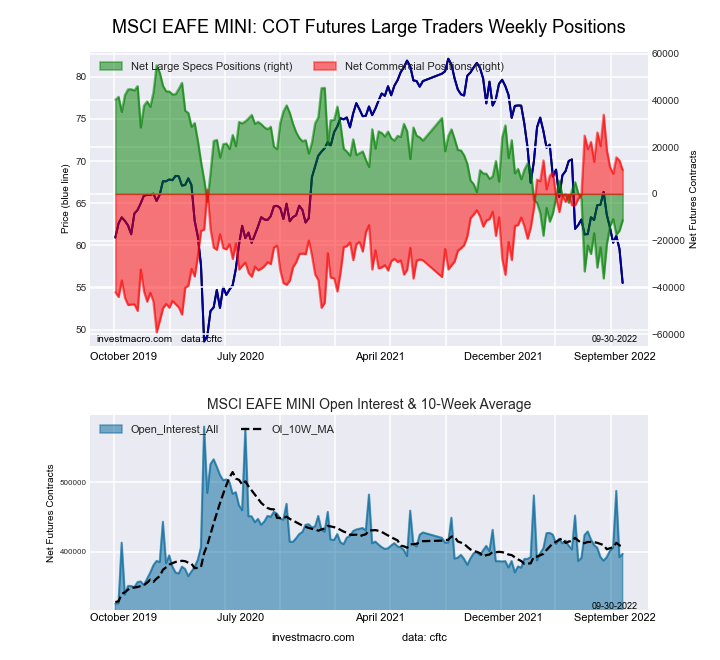 The MSCI EAFE Mini large speculator standing this week recorded a net position of -11,275 contracts in the data reported through Tuesday. This was a weekly lift of 4,434 contracts from the previous week which had a total of -15,709 net contracts.
This week’s current strength score (the trader positioning range over the past three years, measured from 0 to 100) shows the speculators are currently Bearish with a score of 27.3 percent. The commercials are Bullish with a score of 74.5 percent and the small traders (not shown in chart) are Bearish with a score of 29.0 percent.
| MSCI EAFE Mini Futures Statistics | SPECULATORS | COMMERCIALS | SMALL TRADERS |
| – Percent of Open Interest Longs: | 5.0 | 92.2 | 2.1 |
| – Percent of Open Interest Shorts: | 7.9 | 89.6 | 1.8 |
| – Net Position: | -11,275 | 10,118 | 1,157 |
| – Gross Longs: | 19,991 | 365,741 | 8,306 |
| – Gross Shorts: | 31,266 | 355,623 | 7,149 |
| – Long to Short Ratio: | 0.6 to 1 | 1.0 to 1 | 1.2 to 1 |
| NET POSITION TREND: | |||
| – Strength Index Score (3 Year Range Pct): | 27.3 | 74.5 | 29.0 |
| – Strength Index Reading (3 Year Range): | Bearish | Bullish | Bearish |
| NET POSITION MOVEMENT INDEX: | |||
| – 6-Week Change in Strength Index: | 27.3 | -25.5 | -10.0 |
Article By InvestMacro – Receive our weekly COT Newsletter
*COT Report: The COT data, released weekly to the public each Friday, is updated through the most recent Tuesday (data is 3 days old) and shows a quick view of how large speculators or non-commercials (for-profit traders) were positioned in the futures markets.
The CFTC categorizes trader positions according to commercial hedgers (traders who use futures contracts for hedging as part of the business), non-commercials (large traders who speculate to realize trading profits) and nonreportable traders (usually small traders/speculators) as well as their open interest (contracts open in the market at time of reporting). See CFTC criteria here.

- Geopolitical and macroeconomic conditions continue to pressure market sentiment Jul 20, 2026
- USD/JPY Poised to Continue Gains as Expensive Oil and Lack of Support Weigh on Yen Jul 20, 2026
- COT Metals Charts: Weekly Speculator Bets led by Copper & Steel Jul 18, 2026
- COT Bonds Charts: Weekly Speculator Bets led by 2-Year, SOFR 3M & 5-Year Bonds Jul 18, 2026
- COT Energy Charts: Weekly Speculator Bets led by Brent Oil & Heating Oil Jul 18, 2026
- COT Soft Commodities Charts: Weekly Speculator Bets led by Wheat, Corn & Soybean Meal Jul 18, 2026
- The Bank of Canada kept its interest rate unchanged. Platinum prices reached a three‑week high Jul 16, 2026
- Stock indices rose after the release of US inflation data. China’s GDP slowed sharply Jul 15, 2026
- GBP/USD Awaits Political News: What Will Happen Next Jul 15, 2026
- USD/JPY Holds at Highs: Pressure Lingers on Yen Jul 14, 2026