
By InvestMacro
Here are the latest charts and statistics for the Commitment of Traders (COT) reports data published by the Commodities Futures Trading Commission (CFTC).
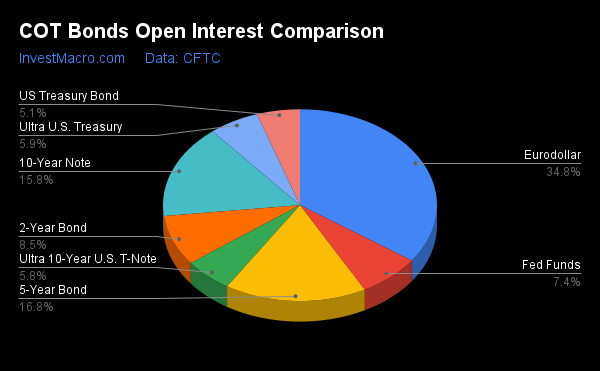
The latest COT data is updated through Tuesday September 27th and shows a quick view of how large traders (for-profit speculators and commercial hedgers) were positioned in the futures markets.
Weekly Speculator Changes sees large drop for 10-Year Bond
The COT bond market speculator bets were slightly higher this week as five out of the eight bond markets we cover had higher positioning this week while three markets had lower contracts.
Free Reports:
 Download Our Metatrader 4 Indicators – Put Our Free MetaTrader 4 Custom Indicators on your charts when you join our Weekly Newsletter
 Get our Weekly Commitment of Traders Reports - See where the biggest traders (Hedge Funds and Commercial Hedgers) are positioned in the futures markets on a weekly basis.
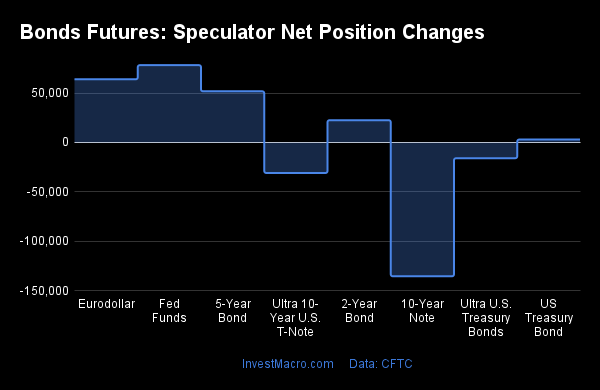
Leading the gains for the bond markets was the Fed Funds (78,319 contracts) and the Eurodollar (63,996 contracts) with the 5-Year Bond (51,838 contracts), the 2-Year Bond (22,538 contracts) and the Long US Bond (2,987 contracts) also showing positive weeks.
The bond markets leading the declines in speculator bets this week was the 10-Year Bond (-135,602 contracts) with the Ultra 10-Year (-30,952 contracts) and the Ultra US Bond (-15,994 contracts) also registering lower bets on the week.
Highlighting the COT Bonds data is the sharp drop in the 10-Year Bond large speculator contracts this week. Speculator bets fell sharply by over -135,000 contracts and halted a 3-week streak of improving speculator positions. The recent improvement in positioning brought the overall speculator standing to the least bearish level in eight weeks (dipping below -230,000 contracts last week). This week’s sentiment decline pushes the overall spec level back above the -350,000 contract threshold and the speculator position remains in a bearish extreme level compared to the past three years (see strength scores in sections below). The bond market prices have continued to sell off as the Federal Reserve (and global central banks) have been sharply and consistently raising their benchmark interest rates to fight the effects of inflation. The 10-Year futures price this week closed at the lowest level since 2008 while the 10-Year yield is currently at 3.83 percent (as bond prices fall, yields rise).
| Sep-27-2022 | OI | OI-Index | Spec-Net | Spec-Index | Com-Net | COM-Index | Smalls-Net | Smalls-Index |
|---|---|---|---|---|---|---|---|---|
| Eurodollar | 8,302,517 | 0 | -2,159,775 | 13 | 2,415,330 | 84 | -255,555 | 48 |
| FedFunds | 1,756,969 | 61 | 102,483 | 52 | -86,405 | 49 | -16,078 | 19 |
| 2-Year | 2,028,931 | 11 | -319,877 | 18 | 425,570 | 98 | -105,693 | 5 |
| Long T-Bond | 1,213,680 | 47 | -96,552 | 53 | 68,268 | 35 | 28,284 | 75 |
| 10-Year | 3,766,782 | 48 | -365,192 | 17 | 409,938 | 71 | -44,746 | 69 |
| 5-Year | 3,999,390 | 51 | -441,966 | 19 | 567,488 | 82 | -125,522 | 46 |
Strength Scores
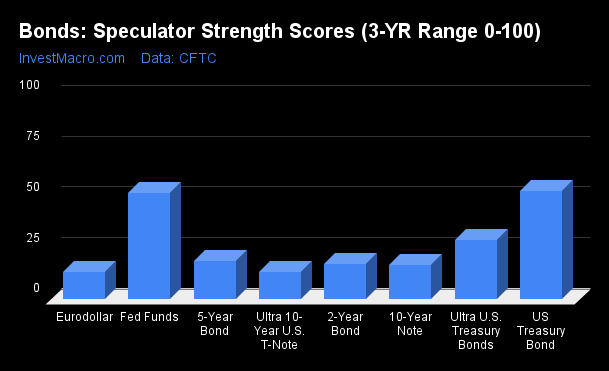
Strength Scores (a normalized measure of Speculator positions over a 3-Year range, from 0 to 100 where above 80 is extreme bullish and below 20 is extreme bearish) showed that the US Treasury Bond (53.2 percent) and the Fed Funds (52.3 percent) lead the bonds and are the only two markets above their 3-year midpoint (50 percent is the midpoint).
On the downside, the Ultra 10-Year Bond (13.3 percent) and the Eurodollar (13.4 percent) come in at the lowest strength levels currently followed by the 10-Year Bond (16.9 percent) and the 2-Year Bond (17.7 percent). All four of these markets are in extreme bearish strength levels at scores below 20 percent.
Strength Statistics:
Fed Funds (52.3 percent) vs Fed Funds previous week (42.6 percent)
2-Year Bond (17.7 percent) vs 2-Year Bond previous week (13.1 percent)
5-Year Bond (18.7 percent) vs 5-Year Bond previous week (10.8 percent)
10-Year Bond (16.9 percent) vs 10-Year Bond previous week (37.5 percent)
Ultra 10-Year Bond (13.3 percent) vs Ultra 10-Year Bond previous week (21.3 percent)
US Treasury Bond (53.2 percent) vs US Treasury Bond previous week (52.2 percent)
Ultra US Treasury Bond (29.4 percent) vs Ultra US Treasury Bond previous week (35.9 percent)
Eurodollar (13.4 percent) vs Eurodollar previous week (12.2 percent)
Strength Trends
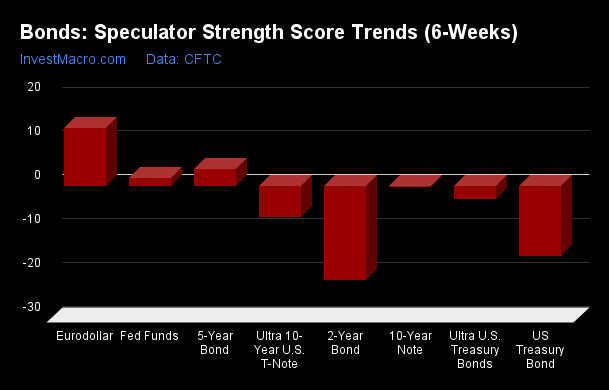
Strength Score Trends (or move index, calculates the 6-week changes in strength scores) showed that the Eurodollar (13.1 percent) leads the past six weeks trends for bonds this week. The 5-Year Bond (3.8 percent) and the Fed Funds (1.7 percent) fill out the other positive movers in the latest trends data.
The 2-Year Bond (-21.4 percent) leads the downside trend scores currently while the next markets with lower trend scores were the US Treasury Bond (-16.0 percent), the Ultra 10-Year Bond (-7.2 percent) and the Ultra US Treasury Bond (-2.9 percent).
Strength Trend Statistics:
Fed Funds (1.7 percent) vs Fed Funds previous week (2.9 percent)
2-Year Bond (-21.4 percent) vs 2-Year Bond previous week (-34.4 percent)
5-Year Bond (3.8 percent) vs 5-Year Bond previous week (-21.6 percent)
10-Year Bond (-0.3 percent) vs 10-Year Bond previous week (8.6 percent)
Ultra 10-Year Bond (-7.2 percent) vs Ultra 10-Year Bond previous week (4.6 percent)
US Treasury Bond (-16.0 percent) vs US Treasury Bond previous week (-16.9 percent)
Ultra US Treasury Bond (-2.9 percent) vs Ultra US Treasury Bond previous week (-1.9 percent)
Eurodollar (13.1 percent) vs Eurodollar previous week (12.2 percent)
Individual Markets:
3-Month Eurodollars Futures:
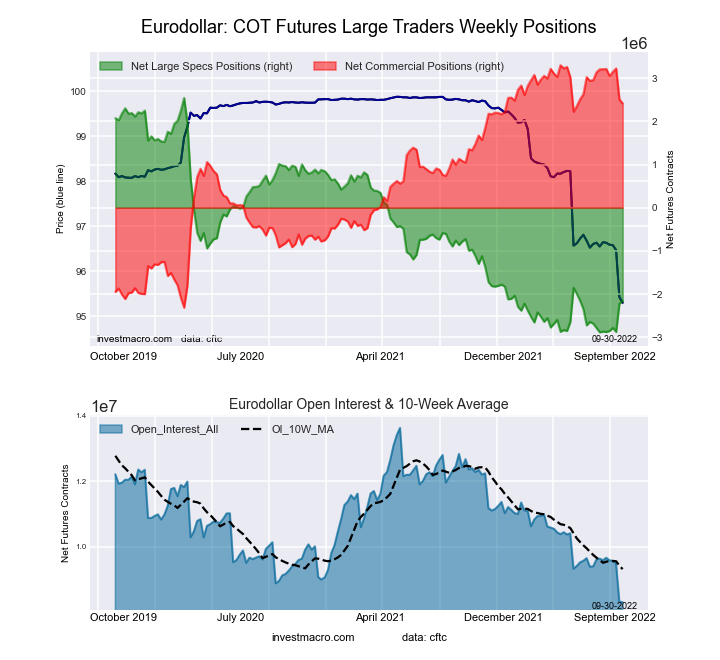 The 3-Month Eurodollars large speculator standing this week came in at a net position of -2,159,775 contracts in the data reported through Tuesday. This was a weekly lift of 63,996 contracts from the previous week which had a total of -2,223,771 net contracts.
This week’s current strength score (the trader positioning range over the past three years, measured from 0 to 100) shows the speculators are currently Bearish-Extreme with a score of 13.4 percent. The commercials are Bullish-Extreme with a score of 84.2 percent and the small traders (not shown in chart) are Bearish with a score of 48.2 percent.
| 3-Month Eurodollars Statistics | SPECULATORS | COMMERCIALS | SMALL TRADERS |
| – Percent of Open Interest Longs: | 7.5 | 68.8 | 4.8 |
| – Percent of Open Interest Shorts: | 33.5 | 39.7 | 7.9 |
| – Net Position: | -2,159,775 | 2,415,330 | -255,555 |
| – Gross Longs: | 622,892 | 5,714,545 | 397,316 |
| – Gross Shorts: | 2,782,667 | 3,299,215 | 652,871 |
| – Long to Short Ratio: | 0.2 to 1 | 1.7 to 1 | 0.6 to 1 |
| NET POSITION TREND: | |||
| – Strength Index Score (3 Year Range Pct): | 13.4 | 84.2 | 48.2 |
| – Strength Index Reading (3 Year Range): | Bearish-Extreme | Bullish-Extreme | Bearish |
| NET POSITION MOVEMENT INDEX: | |||
| – 6-Week Change in Strength Index: | 13.1 | -14.1 | 18.3 |
30-Day Federal Funds Futures:
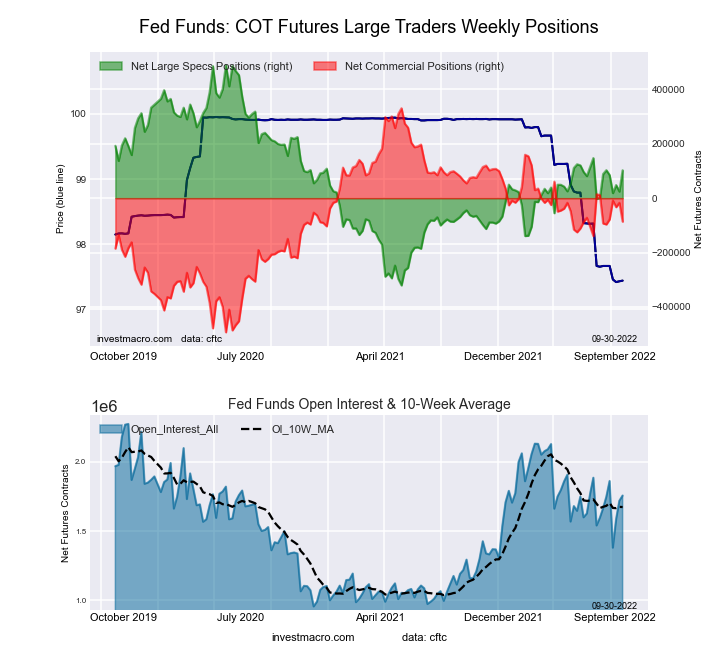 The 30-Day Federal Funds large speculator standing this week came in at a net position of 102,483 contracts in the data reported through Tuesday. This was a weekly gain of 78,319 contracts from the previous week which had a total of 24,164 net contracts.
This week’s current strength score (the trader positioning range over the past three years, measured from 0 to 100) shows the speculators are currently Bullish with a score of 52.3 percent. The commercials are Bearish with a score of 49.4 percent and the small traders (not shown in chart) are Bearish-Extreme with a score of 18.7 percent.
| 30-Day Federal Funds Statistics | SPECULATORS | COMMERCIALS | SMALL TRADERS |
| – Percent of Open Interest Longs: | 15.1 | 71.5 | 1.7 |
| – Percent of Open Interest Shorts: | 9.3 | 76.5 | 2.6 |
| – Net Position: | 102,483 | -86,405 | -16,078 |
| – Gross Longs: | 265,540 | 1,257,032 | 29,182 |
| – Gross Shorts: | 163,057 | 1,343,437 | 45,260 |
| – Long to Short Ratio: | 1.6 to 1 | 0.9 to 1 | 0.6 to 1 |
| NET POSITION TREND: | |||
| – Strength Index Score (3 Year Range Pct): | 52.3 | 49.4 | 18.7 |
| – Strength Index Reading (3 Year Range): | Bullish | Bearish | Bearish-Extreme |
| NET POSITION MOVEMENT INDEX: | |||
| – 6-Week Change in Strength Index: | 1.7 | 0.8 | -52.4 |
2-Year Treasury Note Futures:
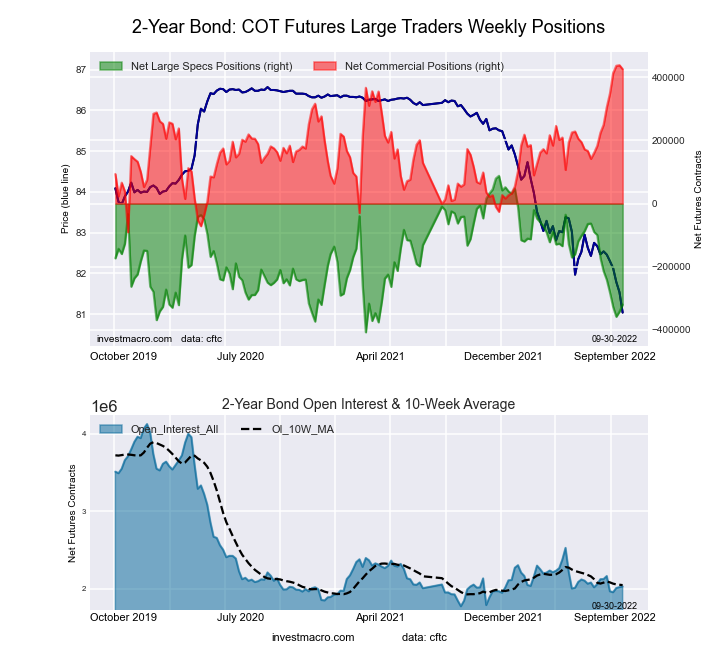 The 2-Year Treasury Note large speculator standing this week came in at a net position of -319,877 contracts in the data reported through Tuesday. This was a weekly increase of 22,538 contracts from the previous week which had a total of -342,415 net contracts.
This week’s current strength score (the trader positioning range over the past three years, measured from 0 to 100) shows the speculators are currently Bearish-Extreme with a score of 17.7 percent. The commercials are Bullish-Extreme with a score of 97.5 percent and the small traders (not shown in chart) are Bearish-Extreme with a score of 4.8 percent.
| 2-Year Treasury Note Statistics | SPECULATORS | COMMERCIALS | SMALL TRADERS |
| – Percent of Open Interest Longs: | 7.6 | 82.4 | 7.7 |
| – Percent of Open Interest Shorts: | 23.4 | 61.4 | 12.9 |
| – Net Position: | -319,877 | 425,570 | -105,693 |
| – Gross Longs: | 154,887 | 1,671,856 | 156,986 |
| – Gross Shorts: | 474,764 | 1,246,286 | 262,679 |
| – Long to Short Ratio: | 0.3 to 1 | 1.3 to 1 | 0.6 to 1 |
| NET POSITION TREND: | |||
| – Strength Index Score (3 Year Range Pct): | 17.7 | 97.5 | 4.8 |
| – Strength Index Reading (3 Year Range): | Bearish-Extreme | Bullish-Extreme | Bearish-Extreme |
| NET POSITION MOVEMENT INDEX: | |||
| – 6-Week Change in Strength Index: | -21.4 | 34.5 | -30.6 |
5-Year Treasury Note Futures:
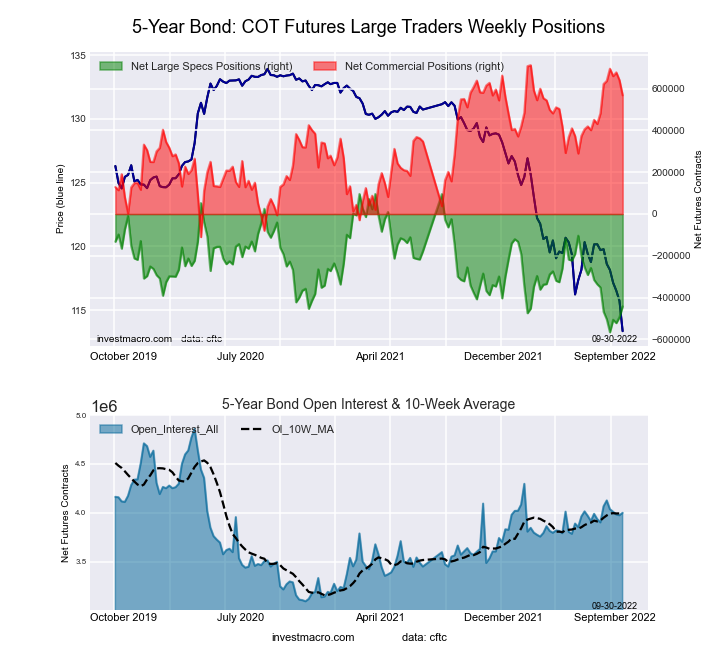 The 5-Year Treasury Note large speculator standing this week came in at a net position of -441,966 contracts in the data reported through Tuesday. This was a weekly increase of 51,838 contracts from the previous week which had a total of -493,804 net contracts.
This week’s current strength score (the trader positioning range over the past three years, measured from 0 to 100) shows the speculators are currently Bearish-Extreme with a score of 18.7 percent. The commercials are Bullish-Extreme with a score of 82.5 percent and the small traders (not shown in chart) are Bearish with a score of 46.5 percent.
| 5-Year Treasury Note Statistics | SPECULATORS | COMMERCIALS | SMALL TRADERS |
| – Percent of Open Interest Longs: | 7.2 | 84.2 | 7.5 |
| – Percent of Open Interest Shorts: | 18.2 | 70.0 | 10.7 |
| – Net Position: | -441,966 | 567,488 | -125,522 |
| – Gross Longs: | 286,492 | 3,365,684 | 300,659 |
| – Gross Shorts: | 728,458 | 2,798,196 | 426,181 |
| – Long to Short Ratio: | 0.4 to 1 | 1.2 to 1 | 0.7 to 1 |
| NET POSITION TREND: | |||
| – Strength Index Score (3 Year Range Pct): | 18.7 | 82.5 | 46.5 |
| – Strength Index Reading (3 Year Range): | Bearish-Extreme | Bullish-Extreme | Bearish |
| NET POSITION MOVEMENT INDEX: | |||
| – 6-Week Change in Strength Index: | 3.8 | -6.6 | 7.8 |
10-Year Treasury Note Futures:
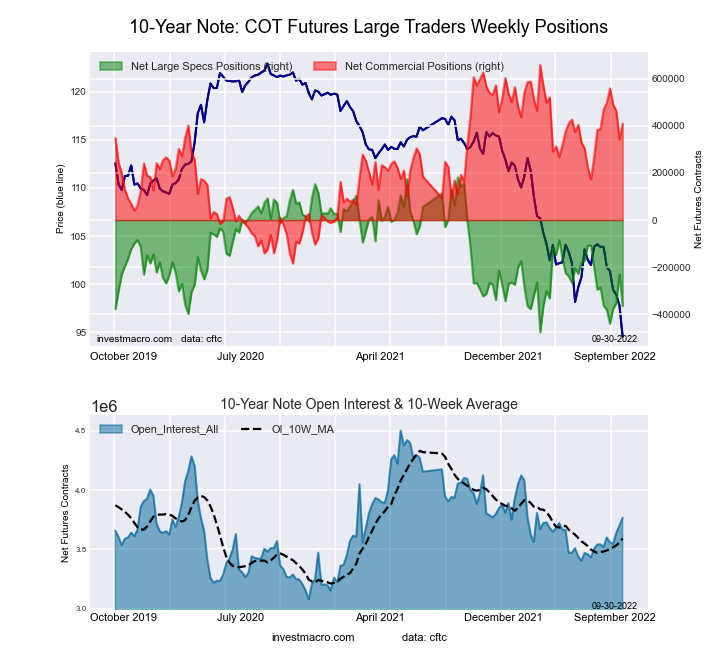 The 10-Year Treasury Note large speculator standing this week came in at a net position of -365,192 contracts in the data reported through Tuesday. This was a weekly decrease of -135,602 contracts from the previous week which had a total of -229,590 net contracts.
This week’s current strength score (the trader positioning range over the past three years, measured from 0 to 100) shows the speculators are currently Bearish-Extreme with a score of 16.9 percent. The commercials are Bullish with a score of 70.6 percent and the small traders (not shown in chart) are Bullish with a score of 69.4 percent.
| 10-Year Treasury Note Statistics | SPECULATORS | COMMERCIALS | SMALL TRADERS |
| – Percent of Open Interest Longs: | 8.4 | 79.6 | 9.8 |
| – Percent of Open Interest Shorts: | 18.1 | 68.7 | 11.0 |
| – Net Position: | -365,192 | 409,938 | -44,746 |
| – Gross Longs: | 316,478 | 2,998,569 | 367,874 |
| – Gross Shorts: | 681,670 | 2,588,631 | 412,620 |
| – Long to Short Ratio: | 0.5 to 1 | 1.2 to 1 | 0.9 to 1 |
| NET POSITION TREND: | |||
| – Strength Index Score (3 Year Range Pct): | 16.9 | 70.6 | 69.4 |
| – Strength Index Reading (3 Year Range): | Bearish-Extreme | Bullish | Bullish |
| NET POSITION MOVEMENT INDEX: | |||
| – 6-Week Change in Strength Index: | -0.3 | -7.2 | 14.9 |
Ultra 10-Year Notes Futures:
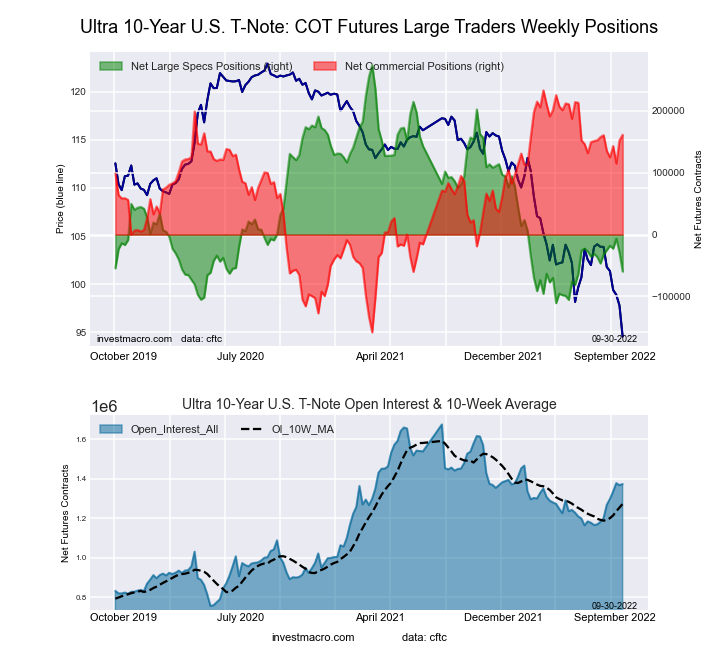 The Ultra 10-Year Notes large speculator standing this week came in at a net position of -59,760 contracts in the data reported through Tuesday. This was a weekly fall of -30,952 contracts from the previous week which had a total of -28,808 net contracts.
This week’s current strength score (the trader positioning range over the past three years, measured from 0 to 100) shows the speculators are currently Bearish-Extreme with a score of 13.3 percent. The commercials are Bullish-Extreme with a score of 81.7 percent and the small traders (not shown in chart) are Bullish with a score of 59.8 percent.
| Ultra 10-Year Notes Statistics | SPECULATORS | COMMERCIALS | SMALL TRADERS |
| – Percent of Open Interest Longs: | 7.2 | 82.8 | 9.6 |
| – Percent of Open Interest Shorts: | 11.5 | 71.0 | 17.0 |
| – Net Position: | -59,760 | 161,207 | -101,447 |
| – Gross Longs: | 98,776 | 1,136,474 | 132,163 |
| – Gross Shorts: | 158,536 | 975,267 | 233,610 |
| – Long to Short Ratio: | 0.6 to 1 | 1.2 to 1 | 0.6 to 1 |
| NET POSITION TREND: | |||
| – Strength Index Score (3 Year Range Pct): | 13.3 | 81.7 | 59.8 |
| – Strength Index Reading (3 Year Range): | Bearish-Extreme | Bullish-Extreme | Bullish |
| NET POSITION MOVEMENT INDEX: | |||
| – 6-Week Change in Strength Index: | -7.2 | 0.2 | 17.9 |
US Treasury Bonds Futures:
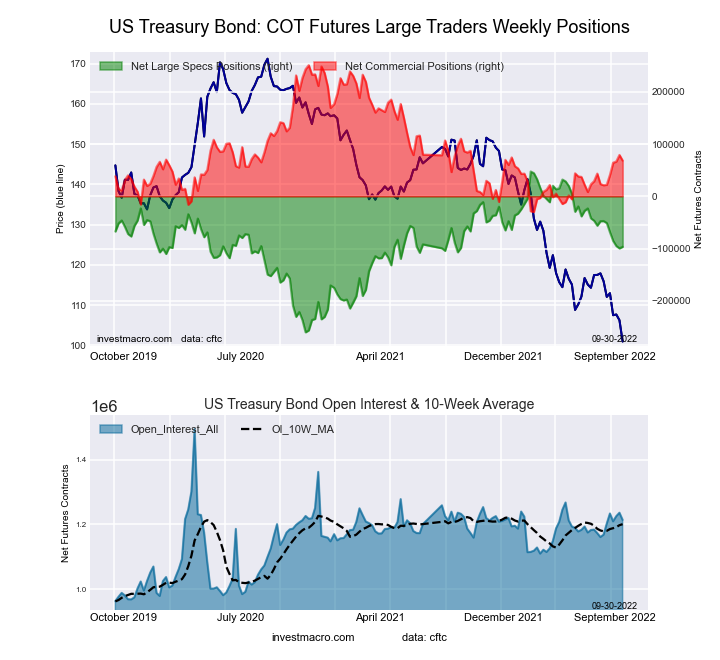 The US Treasury Bonds large speculator standing this week came in at a net position of -96,552 contracts in the data reported through Tuesday. This was a weekly boost of 2,987 contracts from the previous week which had a total of -99,539 net contracts.
This week’s current strength score (the trader positioning range over the past three years, measured from 0 to 100) shows the speculators are currently Bullish with a score of 53.2 percent. The commercials are Bearish with a score of 35.0 percent and the small traders (not shown in chart) are Bullish with a score of 75.0 percent.
| US Treasury Bonds Statistics | SPECULATORS | COMMERCIALS | SMALL TRADERS |
| – Percent of Open Interest Longs: | 5.9 | 78.3 | 14.2 |
| – Percent of Open Interest Shorts: | 13.8 | 72.7 | 11.9 |
| – Net Position: | -96,552 | 68,268 | 28,284 |
| – Gross Longs: | 71,317 | 950,661 | 172,811 |
| – Gross Shorts: | 167,869 | 882,393 | 144,527 |
| – Long to Short Ratio: | 0.4 to 1 | 1.1 to 1 | 1.2 to 1 |
| NET POSITION TREND: | |||
| – Strength Index Score (3 Year Range Pct): | 53.2 | 35.0 | 75.0 |
| – Strength Index Reading (3 Year Range): | Bullish | Bearish | Bullish |
| NET POSITION MOVEMENT INDEX: | |||
| – 6-Week Change in Strength Index: | -16.0 | 16.8 | 1.7 |
Ultra US Treasury Bonds Futures:
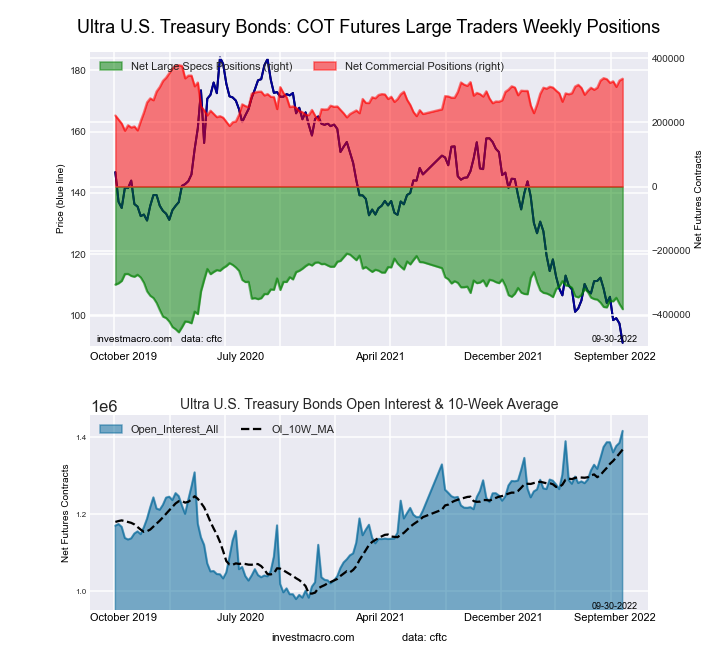 The Ultra US Treasury Bonds large speculator standing this week came in at a net position of -381,907 contracts in the data reported through Tuesday. This was a weekly decline of -15,994 contracts from the previous week which had a total of -365,913 net contracts.
This week’s current strength score (the trader positioning range over the past three years, measured from 0 to 100) shows the speculators are currently Bearish with a score of 29.4 percent. The commercials are Bullish with a score of 79.3 percent and the small traders (not shown in chart) are Bullish with a score of 61.3 percent.
| Ultra US Treasury Bonds Statistics | SPECULATORS | COMMERCIALS | SMALL TRADERS |
| – Percent of Open Interest Longs: | 5.2 | 83.1 | 11.0 |
| – Percent of Open Interest Shorts: | 32.2 | 59.4 | 7.8 |
| – Net Position: | -381,907 | 335,912 | 45,995 |
| – Gross Longs: | 73,402 | 1,176,845 | 156,277 |
| – Gross Shorts: | 455,309 | 840,933 | 110,282 |
| – Long to Short Ratio: | 0.2 to 1 | 1.4 to 1 | 1.4 to 1 |
| NET POSITION TREND: | |||
| – Strength Index Score (3 Year Range Pct): | 29.4 | 79.3 | 61.3 |
| – Strength Index Reading (3 Year Range): | Bearish | Bullish | Bullish |
| NET POSITION MOVEMENT INDEX: | |||
| – 6-Week Change in Strength Index: | -2.9 | -0.8 | 6.2 |
Article By InvestMacro – Receive our weekly COT Newsletter
*COT Report: The COT data, released weekly to the public each Friday, is updated through the most recent Tuesday (data is 3 days old) and shows a quick view of how large speculators or non-commercials (for-profit traders) were positioned in the futures markets.
The CFTC categorizes trader positions according to commercial hedgers (traders who use futures contracts for hedging as part of the business), non-commercials (large traders who speculate to realize trading profits) and nonreportable traders (usually small traders/speculators) as well as their open interest (contracts open in the market at time of reporting). See CFTC criteria here.

- Oil prices jumped 4% amid a new wave of escalation between the US and Iran Jul 13, 2026
- EUR/USD: US Inflation Will Determine Everything Jul 13, 2026
- COT Metals Charts: Weekly Speculator Bets see small gains for Silver & Gold Jul 12, 2026
- COT Bonds Charts: Speculator Bets led by SOFR 3-Months & 2-Year Bonds Jul 12, 2026
- COT Energy Charts: Weekly Speculator Changes led by Brent Oil Jul 12, 2026
- COT Soft Commodities Charts: Weekly Speculator Changes led by Sugar, Corn & Soybeans Jul 12, 2026
- The US and European stock indices are rising again amid renewed investor interest in the AI industry. Jul 10, 2026
- USD/JPY Falls as Yen Recovers Weekly Losses Jul 10, 2026
- Crude oil prices surged sharply by 7% in reaction to the rapid escalation of the conflict in the Middle East Jul 9, 2026
- Middle East Tensions Weigh on Gold Jul 9, 2026