
By InvestMacro
Here are the latest charts and statistics for the Commitment of Traders (COT) reports data published by the Commodities Futures Trading Commission (CFTC).
The latest COT data is updated through Tuesday October 4th and shows a quick view of how large traders (for-profit speculators and commercial hedgers) were positioned in the futures markets.
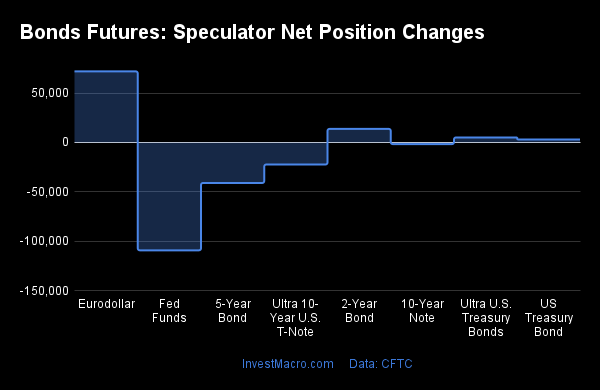
Weekly Speculator Changes led by Eurodollar and 2-Year Bond
The COT bond market speculator bets were mixed this week as four out of the eight bond markets we cover had higher positioning this week while four markets had lower contracts.
Leading the gains for the bond markets was the Eurodollar (72,027 contracts) with the 2-Year Bond (13,743 contracts), the Ultra US Bond (5,084 contracts) and the Long US Bond (2,987 contracts) also showing a positive week.
Free Reports:
 Sign Up for Our Stock Market Newsletter – Get updated on News, Charts & Rankings of Public Companies when you join our Stocks Newsletter
 Get our Weekly Commitment of Traders Reports - See where the biggest traders (Hedge Funds and Commercial Hedgers) are positioned in the futures markets on a weekly basis.
The bond markets leading the declines in speculator bets this week was the Fed Funds (-109,287 contracts) with the 5-Year Bond (-41,066 contracts), the Ultra 10-Year (-22,331 contracts) and the 10-Year Bond (-1,680 contracts) also registering lower bets on the week.
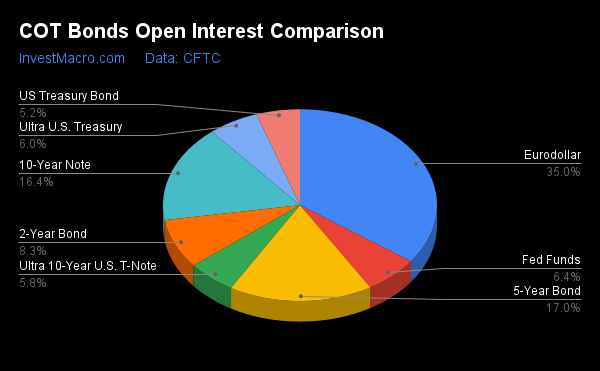
| Oct-04-2022 | OI | OI-Index | Spec-Net | Spec-Index | Com-Net | COM-Index | Smalls-Net | Smalls-Index |
|---|---|---|---|---|---|---|---|---|
| Eurodollar | 8,226,075 | 0 | -2,087,748 | 15 | 2,343,911 | 83 | -256,163 | 48 |
| FedFunds | 1,516,168 | 43 | -6,804 | 39 | 24,908 | 63 | -18,104 | 14 |
| 2-Year | 1,963,479 | 8 | -306,134 | 20 | 394,727 | 91 | -88,593 | 12 |
| Long T-Bond | 1,213,680 | 47 | -96,552 | 53 | 68,268 | 35 | 28,284 | 75 |
| 10-Year | 3,850,494 | 54 | -366,872 | 17 | 416,628 | 71 | -49,756 | 68 |
| 5-Year | 3,995,725 | 51 | -483,032 | 12 | 625,173 | 89 | -142,141 | 42 |
US Treasury Bond remains highest in Strength Scores
Strength Scores (a normalized measure of Speculator positions over a 3-Year range, from 0 to 100 where above 80 is extreme bullish and below 20 is extreme bearish) show that the US Treasury Bond (53.2 percent) leads the bonds markets currently and is the only market with a score above 50 percent (3-Year midpoint of range). The Fed Funds (38.8 percent) comes in as the next highest bonds market in strength scores.
On the downside, the Ultra 10-Year Bond (7.4 percent) comes in at the lowest strength level currently and is followed by the 5-Year Bond (12.5 percent), the Eurodollar (14.7 percent) and the 10-Year Bond (16.7 percent). All of these markets are currently in bearish extreme levels with scores below 20 percent.
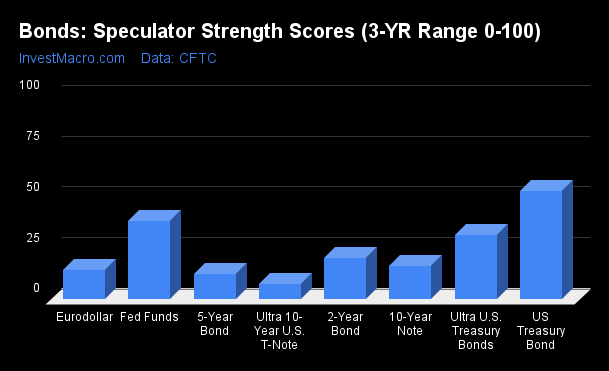
Strength Statistics:
Fed Funds (38.8 percent) vs Fed Funds previous week (52.3 percent)
2-Year Bond (20.4 percent) vs 2-Year Bond previous week (17.7 percent)
5-Year Bond (12.5 percent) vs 5-Year Bond previous week (18.7 percent)
10-Year Bond (16.7 percent) vs 10-Year Bond previous week (16.9 percent)
Ultra 10-Year Bond (7.4 percent) vs Ultra 10-Year Bond previous week (13.3 percent)
US Treasury Bond (53.2 percent) vs US Treasury Bond previous week (52.2 percent)
Ultra US Treasury Bond (31.5 percent) vs Ultra US Treasury Bond previous week (29.4 percent)
Eurodollar (14.7 percent) vs Eurodollar previous week (13.4 percent)
Strength Trends led by Eurodollar
Strength Score Trends (or move index, calculates the 6-week changes in strength scores) show that the Eurodollar (14.6 percent) leads the past six weeks trends for bonds this week. The 5-Year Bond (3.1 percent) and the 10-Year Bond (2.2 percent) fill out the other positive movers in the latest trends data.
The US Treasury Bond (-16.0 percent) leads the downside trend scores currently while the next markets with lower trend scores were the Ultra 10-Year Bond (-14.8 percent), Fed Funds (-13.5 percent) and the 2-Year Bond (-13.1 percent).
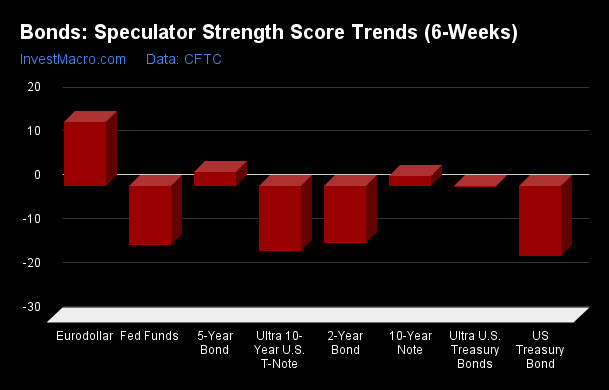
Strength Trend Statistics:
Fed Funds (-13.5 percent) vs Fed Funds previous week (1.7 percent)
2-Year Bond (-13.1 percent) vs 2-Year Bond previous week (-21.4 percent)
5-Year Bond (3.1 percent) vs 5-Year Bond previous week (3.8 percent)
10-Year Bond (2.2 percent) vs 10-Year Bond previous week (-0.3 percent)
Ultra 10-Year Bond (-14.8 percent) vs Ultra 10-Year Bond previous week (-7.2 percent)
US Treasury Bond (-16.0 percent) vs US Treasury Bond previous week (-16.9 percent)
Ultra US Treasury Bond (-0.2 percent) vs Ultra US Treasury Bond previous week (-2.9 percent)
Eurodollar (14.6 percent) vs Eurodollar previous week (13.1 percent)
Individual Markets:
3-Month Eurodollars Futures:
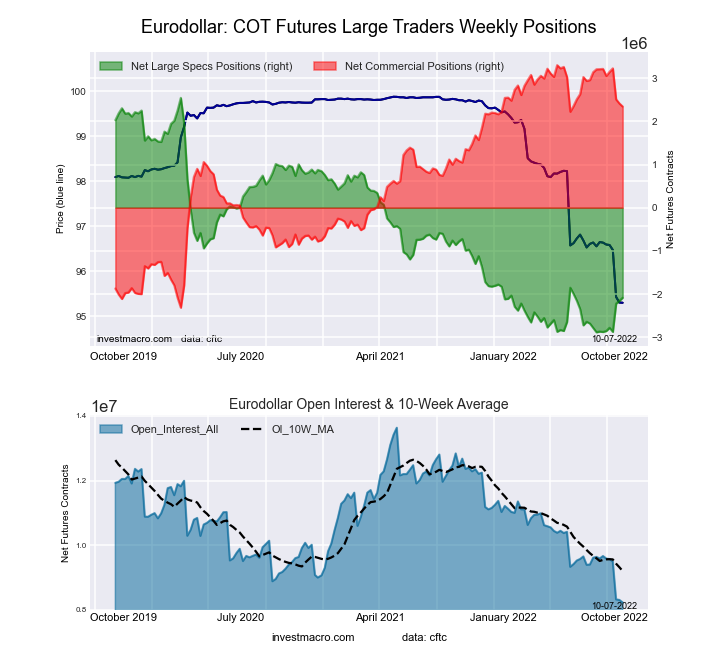 The 3-Month Eurodollars large speculator standing this week equaled a net position of -2,087,748 contracts in the data reported through Tuesday. This was a weekly gain of 72,027 contracts from the previous week which had a total of -2,159,775 net contracts.
This week’s current strength score (the trader positioning range over the past three years, measured from 0 to 100) shows the speculators are currently Bearish-Extreme with a score of 14.7 percent. The commercials are Bullish-Extreme with a score of 83.0 percent and the small traders (not shown in chart) are Bearish with a score of 48.1 percent.
| 3-Month Eurodollars Statistics | SPECULATORS | COMMERCIALS | SMALL TRADERS |
| – Percent of Open Interest Longs: | 8.2 | 68.2 | 4.9 |
| – Percent of Open Interest Shorts: | 33.6 | 39.7 | 8.0 |
| – Net Position: | -2,087,748 | 2,343,911 | -256,163 |
| – Gross Longs: | 674,365 | 5,606,961 | 401,184 |
| – Gross Shorts: | 2,762,113 | 3,263,050 | 657,347 |
| – Long to Short Ratio: | 0.2 to 1 | 1.7 to 1 | 0.6 to 1 |
| NET POSITION TREND: | |||
| – Strength Index Score (3 Year Range Pct): | 14.7 | 83.0 | 48.1 |
| – Strength Index Reading (3 Year Range): | Bearish-Extreme | Bullish-Extreme | Bearish |
| NET POSITION MOVEMENT INDEX: | |||
| – 6-Week Change in Strength Index: | 14.6 | -15.5 | 17.5 |
30-Day Federal Funds Futures:
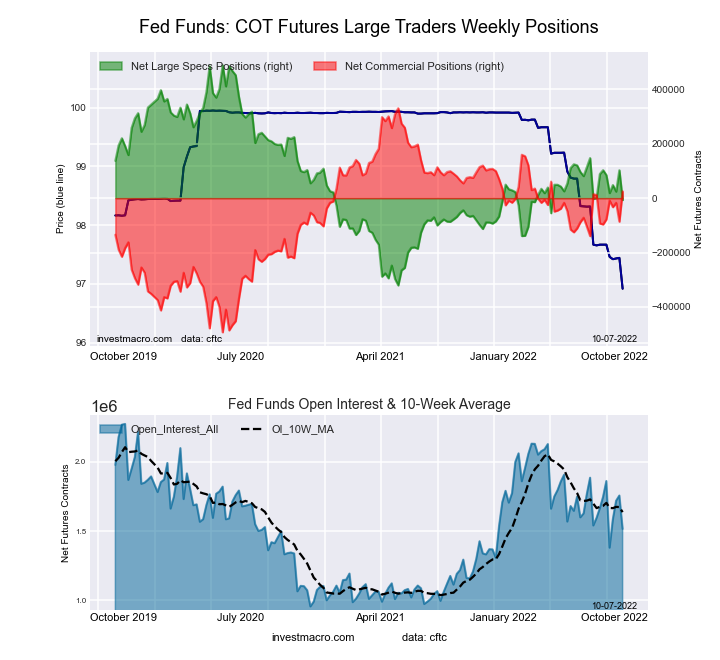 The 30-Day Federal Funds large speculator standing this week equaled a net position of -6,804 contracts in the data reported through Tuesday. This was a weekly decrease of -109,287 contracts from the previous week which had a total of 102,483 net contracts.
This week’s current strength score (the trader positioning range over the past three years, measured from 0 to 100) shows the speculators are currently Bearish with a score of 38.8 percent. The commercials are Bullish with a score of 62.9 percent and the small traders (not shown in chart) are Bearish-Extreme with a score of 13.5 percent.
| 30-Day Federal Funds Statistics | SPECULATORS | COMMERCIALS | SMALL TRADERS |
| – Percent of Open Interest Longs: | 10.0 | 74.5 | 1.7 |
| – Percent of Open Interest Shorts: | 10.5 | 72.8 | 2.9 |
| – Net Position: | -6,804 | 24,908 | -18,104 |
| – Gross Longs: | 151,759 | 1,129,098 | 25,617 |
| – Gross Shorts: | 158,563 | 1,104,190 | 43,721 |
| – Long to Short Ratio: | 1.0 to 1 | 1.0 to 1 | 0.6 to 1 |
| NET POSITION TREND: | |||
| – Strength Index Score (3 Year Range Pct): | 38.8 | 62.9 | 13.5 |
| – Strength Index Reading (3 Year Range): | Bearish | Bullish | Bearish-Extreme |
| NET POSITION MOVEMENT INDEX: | |||
| – 6-Week Change in Strength Index: | -13.5 | 14.8 | -31.0 |
2-Year Treasury Note Futures:
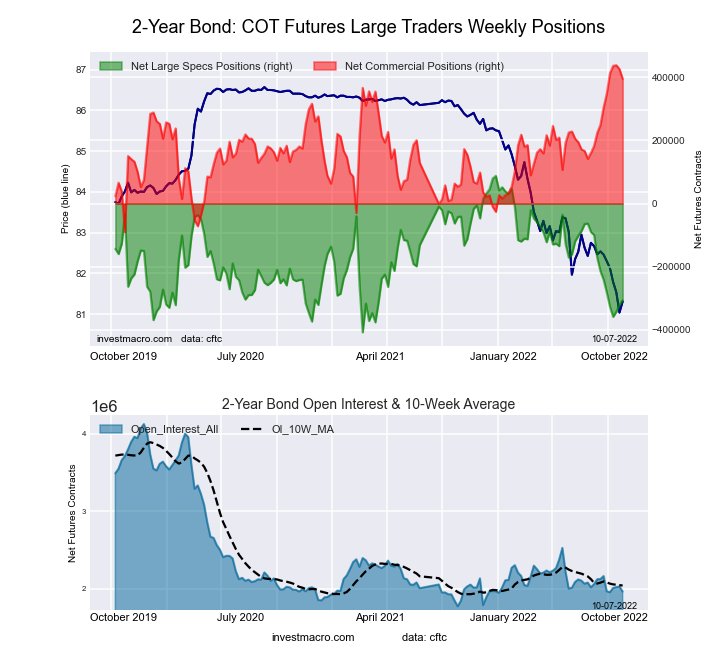 The 2-Year Treasury Note large speculator standing this week equaled a net position of -306,134 contracts in the data reported through Tuesday. This was a weekly rise of 13,743 contracts from the previous week which had a total of -319,877 net contracts.
This week’s current strength score (the trader positioning range over the past three years, measured from 0 to 100) shows the speculators are currently Bearish with a score of 20.4 percent. The commercials are Bullish-Extreme with a score of 91.5 percent and the small traders (not shown in chart) are Bearish-Extreme with a score of 12.5 percent.
| 2-Year Treasury Note Statistics | SPECULATORS | COMMERCIALS | SMALL TRADERS |
| – Percent of Open Interest Longs: | 7.9 | 82.3 | 8.0 |
| – Percent of Open Interest Shorts: | 23.5 | 62.2 | 12.5 |
| – Net Position: | -306,134 | 394,727 | -88,593 |
| – Gross Longs: | 154,321 | 1,616,300 | 156,188 |
| – Gross Shorts: | 460,455 | 1,221,573 | 244,781 |
| – Long to Short Ratio: | 0.3 to 1 | 1.3 to 1 | 0.6 to 1 |
| NET POSITION TREND: | |||
| – Strength Index Score (3 Year Range Pct): | 20.4 | 91.5 | 12.5 |
| – Strength Index Reading (3 Year Range): | Bearish | Bullish-Extreme | Bearish-Extreme |
| NET POSITION MOVEMENT INDEX: | |||
| – 6-Week Change in Strength Index: | -13.1 | 17.6 | -11.1 |
5-Year Treasury Note Futures:
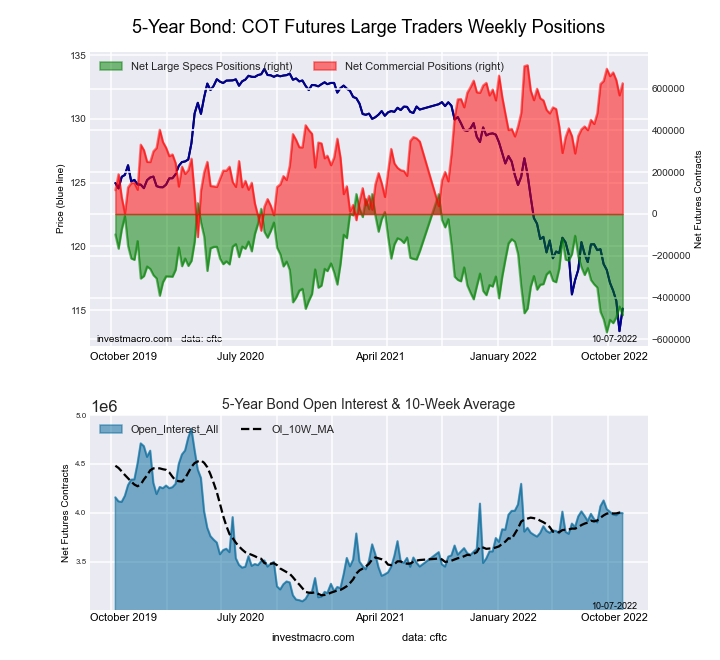 The 5-Year Treasury Note large speculator standing this week equaled a net position of -483,032 contracts in the data reported through Tuesday. This was a weekly decrease of -41,066 contracts from the previous week which had a total of -441,966 net contracts.
This week’s current strength score (the trader positioning range over the past three years, measured from 0 to 100) shows the speculators are currently Bearish-Extreme with a score of 12.5 percent. The commercials are Bullish-Extreme with a score of 89.5 percent and the small traders (not shown in chart) are Bearish with a score of 41.9 percent.
| 5-Year Treasury Note Statistics | SPECULATORS | COMMERCIALS | SMALL TRADERS |
| – Percent of Open Interest Longs: | 5.9 | 85.7 | 7.4 |
| – Percent of Open Interest Shorts: | 18.0 | 70.1 | 11.0 |
| – Net Position: | -483,032 | 625,173 | -142,141 |
| – Gross Longs: | 234,418 | 3,425,691 | 296,148 |
| – Gross Shorts: | 717,450 | 2,800,518 | 438,289 |
| – Long to Short Ratio: | 0.3 to 1 | 1.2 to 1 | 0.7 to 1 |
| NET POSITION TREND: | |||
| – Strength Index Score (3 Year Range Pct): | 12.5 | 89.5 | 41.9 |
| – Strength Index Reading (3 Year Range): | Bearish-Extreme | Bullish-Extreme | Bearish |
| NET POSITION MOVEMENT INDEX: | |||
| – 6-Week Change in Strength Index: | 3.1 | -1.4 | -2.6 |
10-Year Treasury Note Futures:
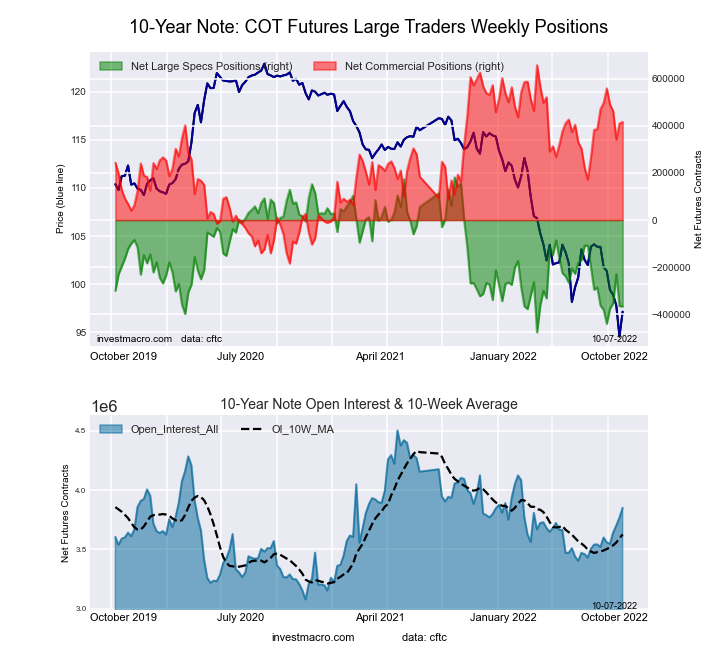 The 10-Year Treasury Note large speculator standing this week equaled a net position of -366,872 contracts in the data reported through Tuesday. This was a weekly lowering of -1,680 contracts from the previous week which had a total of -365,192 net contracts.
This week’s current strength score (the trader positioning range over the past three years, measured from 0 to 100) shows the speculators are currently Bearish-Extreme with a score of 16.7 percent. The commercials are Bullish with a score of 71.4 percent and the small traders (not shown in chart) are Bullish with a score of 68.2 percent.
| 10-Year Treasury Note Statistics | SPECULATORS | COMMERCIALS | SMALL TRADERS |
| – Percent of Open Interest Longs: | 9.7 | 79.0 | 8.8 |
| – Percent of Open Interest Shorts: | 19.2 | 68.2 | 10.1 |
| – Net Position: | -366,872 | 416,628 | -49,756 |
| – Gross Longs: | 373,634 | 3,041,673 | 340,013 |
| – Gross Shorts: | 740,506 | 2,625,045 | 389,769 |
| – Long to Short Ratio: | 0.5 to 1 | 1.2 to 1 | 0.9 to 1 |
| NET POSITION TREND: | |||
| – Strength Index Score (3 Year Range Pct): | 16.7 | 71.4 | 68.2 |
| – Strength Index Reading (3 Year Range): | Bearish-Extreme | Bullish | Bullish |
| NET POSITION MOVEMENT INDEX: | |||
| – 6-Week Change in Strength Index: | 2.2 | -9.5 | 15.6 |
Ultra 10-Year Notes Futures:
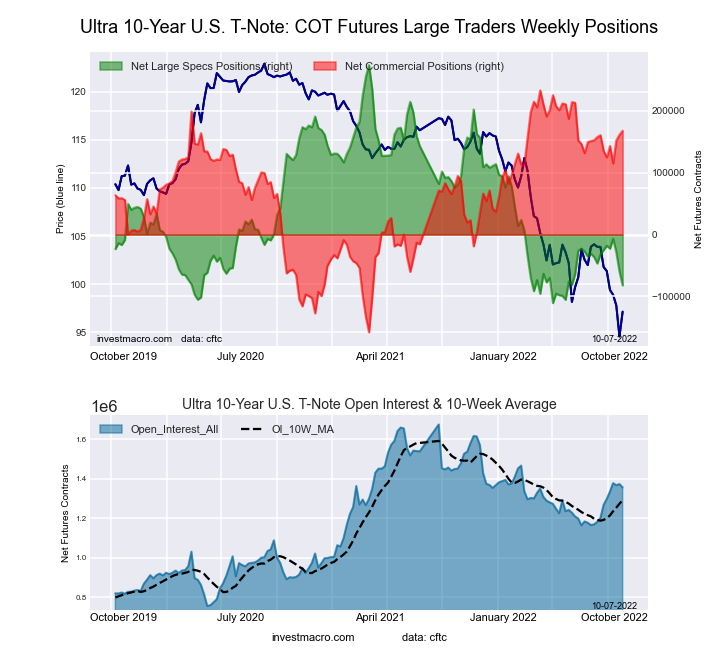 The Ultra 10-Year Notes large speculator standing this week equaled a net position of -82,091 contracts in the data reported through Tuesday. This was a weekly lowering of -22,331 contracts from the previous week which had a total of -59,760 net contracts.
This week’s current strength score (the trader positioning range over the past three years, measured from 0 to 100) shows the speculators are currently Bearish-Extreme with a score of 7.4 percent. The commercials are Bullish-Extreme with a score of 83.3 percent and the small traders (not shown in chart) are Bullish with a score of 70.2 percent.
| Ultra 10-Year Notes Statistics | SPECULATORS | COMMERCIALS | SMALL TRADERS |
| – Percent of Open Interest Longs: | 6.2 | 82.1 | 11.0 |
| – Percent of Open Interest Shorts: | 12.3 | 69.8 | 17.3 |
| – Net Position: | -82,091 | 167,665 | -85,574 |
| – Gross Longs: | 84,183 | 1,113,708 | 149,111 |
| – Gross Shorts: | 166,274 | 946,043 | 234,685 |
| – Long to Short Ratio: | 0.5 to 1 | 1.2 to 1 | 0.6 to 1 |
| NET POSITION TREND: | |||
| – Strength Index Score (3 Year Range Pct): | 7.4 | 83.3 | 70.2 |
| – Strength Index Reading (3 Year Range): | Bearish-Extreme | Bullish-Extreme | Bullish |
| NET POSITION MOVEMENT INDEX: | |||
| – 6-Week Change in Strength Index: | -14.8 | 8.3 | 16.1 |
US Treasury Bonds Futures:
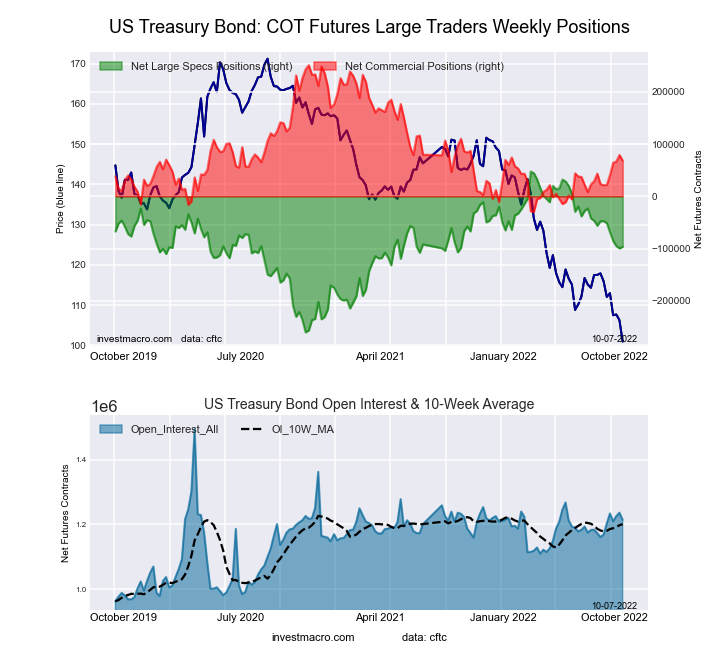 The US Treasury Bonds large speculator standing this week equaled a net position of -96,552 contracts in the data reported through Tuesday. This was a weekly rise of 2,987 contracts from the previous week which had a total of -99,539 net contracts.
This week’s current strength score (the trader positioning range over the past three years, measured from 0 to 100) shows the speculators are currently Bullish with a score of 53.2 percent. The commercials are Bearish with a score of 35.0 percent and the small traders (not shown in chart) are Bullish with a score of 75.0 percent.
| US Treasury Bonds Statistics | SPECULATORS | COMMERCIALS | SMALL TRADERS |
| – Percent of Open Interest Longs: | 5.9 | 78.3 | 14.2 |
| – Percent of Open Interest Shorts: | 13.8 | 72.7 | 11.9 |
| – Net Position: | -96,552 | 68,268 | 28,284 |
| – Gross Longs: | 71,317 | 950,661 | 172,811 |
| – Gross Shorts: | 167,869 | 882,393 | 144,527 |
| – Long to Short Ratio: | 0.4 to 1 | 1.1 to 1 | 1.2 to 1 |
| NET POSITION TREND: | |||
| – Strength Index Score (3 Year Range Pct): | 53.2 | 35.0 | 75.0 |
| – Strength Index Reading (3 Year Range): | Bullish | Bearish | Bullish |
| NET POSITION MOVEMENT INDEX: | |||
| – 6-Week Change in Strength Index: | -16.0 | 16.8 | 1.7 |
Ultra US Treasury Bonds Futures:
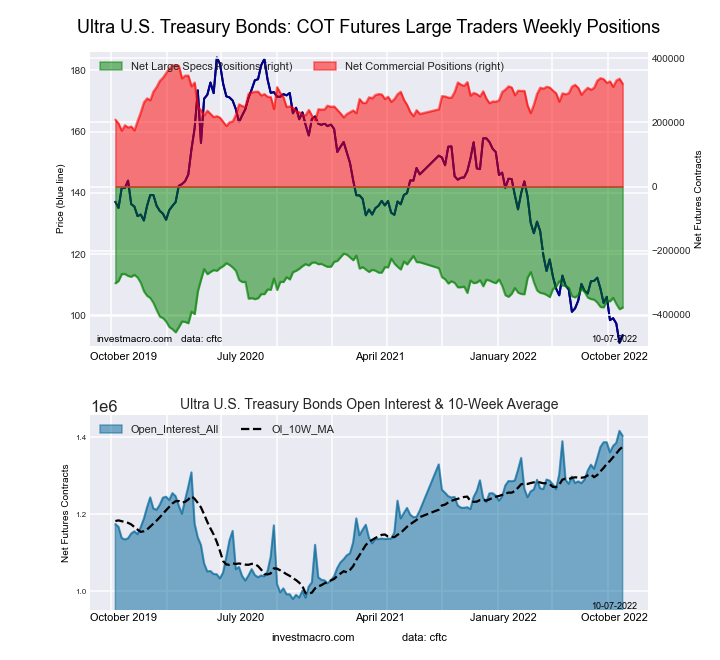 The Ultra US Treasury Bonds large speculator standing this week equaled a net position of -376,823 contracts in the data reported through Tuesday. This was a weekly advance of 5,084 contracts from the previous week which had a total of -381,907 net contracts.
This week’s current strength score (the trader positioning range over the past three years, measured from 0 to 100) shows the speculators are currently Bearish with a score of 31.5 percent. The commercials are Bullish with a score of 71.5 percent and the small traders (not shown in chart) are Bullish with a score of 69.0 percent.
| Ultra US Treasury Bonds Statistics | SPECULATORS | COMMERCIALS | SMALL TRADERS |
| – Percent of Open Interest Longs: | 4.8 | 83.3 | 11.4 |
| – Percent of Open Interest Shorts: | 31.6 | 60.5 | 7.3 |
| – Net Position: | -376,823 | 320,058 | 56,765 |
| – Gross Longs: | 66,911 | 1,169,527 | 159,344 |
| – Gross Shorts: | 443,734 | 849,469 | 102,579 |
| – Long to Short Ratio: | 0.2 to 1 | 1.4 to 1 | 1.6 to 1 |
| NET POSITION TREND: | |||
| – Strength Index Score (3 Year Range Pct): | 31.5 | 71.5 | 69.0 |
| – Strength Index Reading (3 Year Range): | Bearish | Bullish | Bullish |
| NET POSITION MOVEMENT INDEX: | |||
| – 6-Week Change in Strength Index: | -0.2 | -7.1 | 10.8 |
Article By InvestMacro – Receive our weekly COT Newsletter
*COT Report: The COT data, released weekly to the public each Friday, is updated through the most recent Tuesday (data is 3 days old) and shows a quick view of how large speculators or non-commercials (for-profit traders) were positioned in the futures markets.
The CFTC categorizes trader positions according to commercial hedgers (traders who use futures contracts for hedging as part of the business), non-commercials (large traders who speculate to realize trading profits) and nonreportable traders (usually small traders/speculators) as well as their open interest (contracts open in the market at time of reporting). See CFTC criteria here.

- Geopolitical and macroeconomic conditions continue to pressure market sentiment Jul 20, 2026
- USD/JPY Poised to Continue Gains as Expensive Oil and Lack of Support Weigh on Yen Jul 20, 2026
- COT Metals Charts: Weekly Speculator Bets led by Copper & Steel Jul 18, 2026
- COT Bonds Charts: Weekly Speculator Bets led by 2-Year, SOFR 3M & 5-Year Bonds Jul 18, 2026
- COT Energy Charts: Weekly Speculator Bets led by Brent Oil & Heating Oil Jul 18, 2026
- COT Soft Commodities Charts: Weekly Speculator Bets led by Wheat, Corn & Soybean Meal Jul 18, 2026
- The Bank of Canada kept its interest rate unchanged. Platinum prices reached a three‑week high Jul 16, 2026
- Stock indices rose after the release of US inflation data. China’s GDP slowed sharply Jul 15, 2026
- GBP/USD Awaits Political News: What Will Happen Next Jul 15, 2026
- USD/JPY Holds at Highs: Pressure Lingers on Yen Jul 14, 2026