
By InvestMacro
Here are the latest charts and statistics for the Commitment of Traders (COT) reports data published by the Commodities Futures Trading Commission (CFTC).
The latest COT data is updated through Tuesday September 27th and shows a quick view of how large traders (for-profit speculators and commercial entities) were positioned in the futures markets.
Weekly Speculator Changes go lower this week led by Soybean Meal, Lean Hogs & Live Cattle
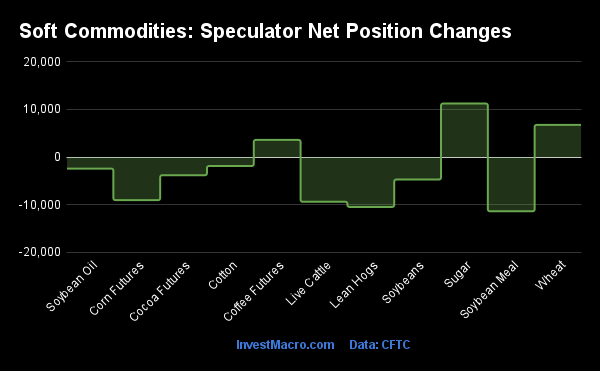
The COT soft commodities speculator bets were lower this week as three out of the eleven soft commodities markets we cover had higher positioning this week while the other eight markets had decreases in contracts.
Free Reports:
 Sign Up for Our Stock Market Newsletter – Get updated on News, Charts & Rankings of Public Companies when you join our Stocks Newsletter
 Get our Weekly Commitment of Traders Reports - See where the biggest traders (Hedge Funds and Commercial Hedgers) are positioned in the futures markets on a weekly basis.
Leading the gains for soft commodities markets was Sugar (11,256 contracts) with Wheat (6,764 contracts) and Coffee (3,608 contracts) also showing positive weeks.
The softs market leading the declines in speculator bets this week was Soybean Meal (-11,395 contracts) with Lean Hogs (-10,484 contracts), Live Cattle (-9,400 contracts), Corn (-9,055 contracts), Soybeans (-4,722 contracts), Cocoa (-3,818 contracts), Soybean Oil (-2,424 contracts) and Cotton (-1,875 contracts) also registering lower bets on the week.
| Sep-27-2022 | OI | OI-Index | Spec-Net | Spec-Index | Com-Net | COM-Index | Smalls-Net | Smalls-Index |
|---|---|---|---|---|---|---|---|---|
| WTI Crude | 1,504,991 | 3 | 226,080 | 4 | -246,872 | 98 | 20,792 | 35 |
| Gold | 457,061 | 1 | 52,081 | 0 | -62,138 | 100 | 10,057 | 1 |
| Silver | 129,000 | 0 | 758 | 15 | -6,860 | 89 | 6,102 | 0 |
| Copper | 173,661 | 13 | -27,756 | 16 | 28,884 | 86 | -1,128 | 19 |
| Palladium | 6,080 | 1 | -831 | 18 | 1,236 | 82 | -405 | 20 |
| Platinum | 58,994 | 20 | 161 | 9 | -2,525 | 93 | 2,364 | 0 |
| Natural Gas | 943,241 | 0 | -152,124 | 33 | 121,135 | 69 | 30,989 | 54 |
| Brent | 167,444 | 14 | -41,257 | 42 | 40,490 | 61 | 767 | 20 |
| Heating Oil | 290,265 | 31 | 11,414 | 59 | -21,625 | 48 | 10,211 | 34 |
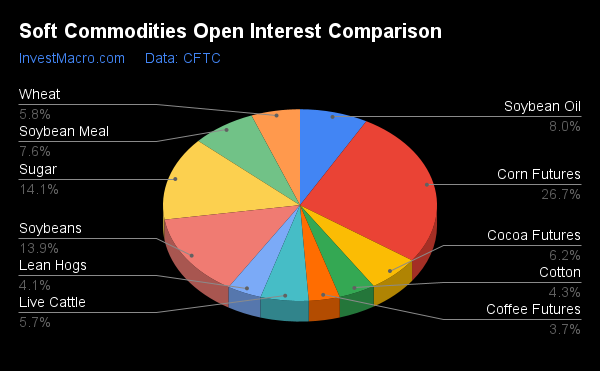
| Soybeans | 699,311 | 27 | 80,051 | 38 | -50,206 | 71 | -29,845 | 21 |
| Corn | 1,347,278 | 11 | 296,622 | 68 | -229,436 | 39 | -67,186 | 4 |
| Coffee | 185,149 | 1 | 44,680 | 77 | -46,664 | 27 | 1,984 | 18 |
| Sugar | 710,887 | 2 | 48,601 | 47 | -56,409 | 57 | 7,808 | 18 |
| Wheat | 290,771 | 2 | 2,735 | 23 | 4,675 | 66 | -7,410 | 72 |
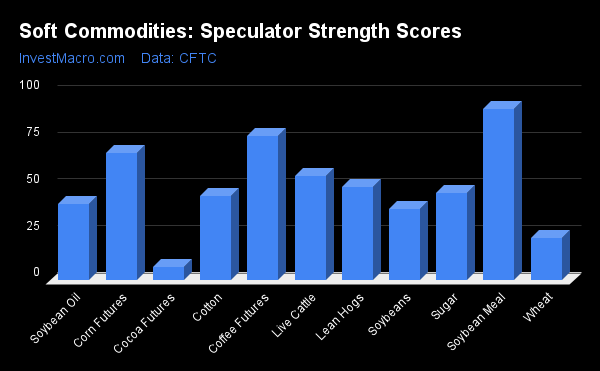
Strength Scores
Strength Scores (a normalized measure of Speculator positions over a 3-Year range, from 0 to 100 where above 80 is extreme bullish and below 20 is extreme bearish) showed that Soybean Meal (91.5 percent) leads the soft commodity markets and remains in a bullish extreme position (above 80 percent). Coffee (77.4 percent) and Corn (67.9 percent) come in as the next highest soft commodity markets in strength scores.
On the downside, Cocoa (7.2 percent) comes in at the lowest strength level currently and is in a bearish extreme position with a score below 20 percent. The next markets with the lowest scores are Wheat (22.6 percent) and Soybeans (37.9 percent).
Strength Statistics:
Corn (67.9 percent) vs Corn previous week (69.1 percent)
Sugar (46.6 percent) vs Sugar previous week (44.3 percent)
Coffee (77.4 percent) vs Coffee previous week (74.3 percent)
Soybeans (37.9 percent) vs Soybeans previous week (39.4 percent)
Soybean Oil (40.7 percent) vs Soybean Oil previous week (42.4 percent)
Soybean Meal (91.5 percent) vs Soybean Meal previous week (97.9 percent)
Live Cattle (55.8 percent) vs Live Cattle previous week (67.6 percent)
Lean Hogs (49.9 percent) vs Lean Hogs previous week (61.3 percent)
Cotton (45.2 percent) vs Cotton previous week (46.5 percent)
Cocoa (7.2 percent) vs Cocoa previous week (11.0 percent)
Wheat (22.6 percent) vs Wheat previous week (13.8 percent)
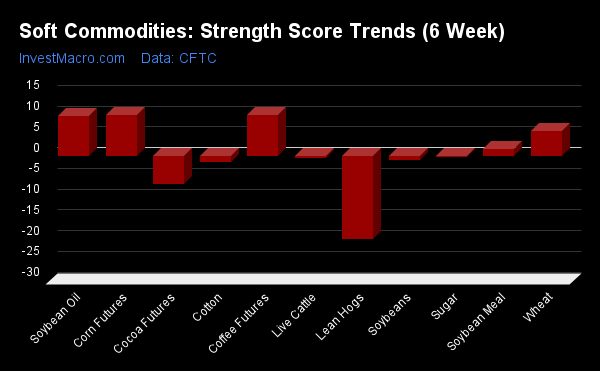
Strength Trends
Strength Score Trends (or move index, calculates the 6-week changes in strength scores) showed that Corn (9.8 percent), Coffee (9.7 percent) and Soybean Oil (9.6 percent) lead the past six weeks trends for soft commodity markets. Wheat (6.0 percent) and Soybean Meal (1.6 percent) round out the other positive movers in the latest trends data.
Lean Hogs (-20.0 percent) leads the downside trend scores currently while the next market with lower trend scores was Cocoa (-6.9 percent) followed by Cotton (-1.5 percent).
Strength Trend Statistics:
Corn (9.8 percent) vs Corn previous week (12.1 percent)
Sugar (-0.3 percent) vs Sugar previous week (2.3 percent)
Coffee (9.7 percent) vs Coffee previous week (9.2 percent)
Soybeans (-1.0 percent) vs Soybeans previous week (-1.3 percent)
Soybean Oil (9.6 percent) vs Soybean Oil previous week (18.2 percent)
Soybean Meal (1.6 percent) vs Soybean Meal previous week (8.0 percent)
Live Cattle (-0.5 percent) vs Live Cattle previous week (27.3 percent)
Lean Hogs (-20.0 percent) vs Lean Hogs previous week (-0.1 percent)
Cotton (-1.5 percent) vs Cotton previous week (5.3 percent)
Cocoa (-6.9 percent) vs Cocoa previous week (-0.4 percent)
Wheat (6.0 percent) vs Wheat previous week (-0.8 percent)
Individual Markets:
CORN Futures:
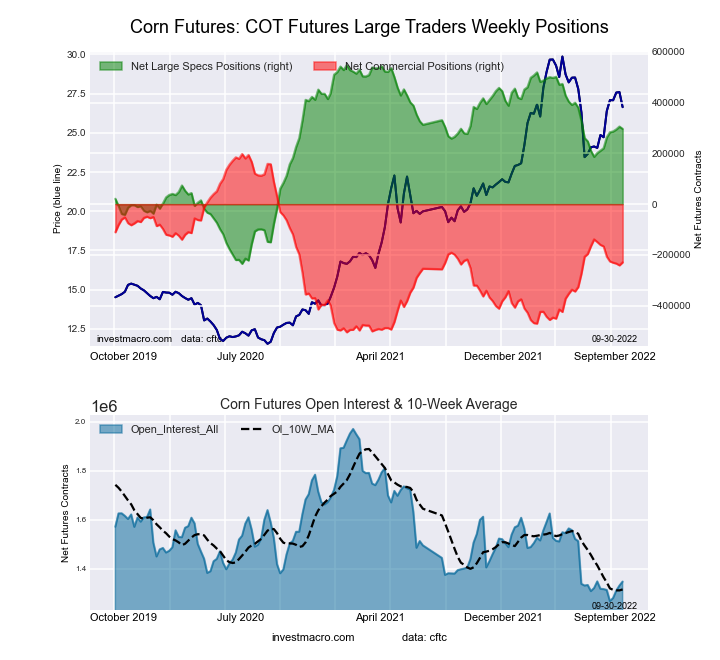 The CORN large speculator standing this week resulted in a net position of 296,622 contracts in the data reported through Tuesday. This was a weekly fall of -9,055 contracts from the previous week which had a total of 305,677 net contracts.
This week’s current strength score (the trader positioning range over the past three years, measured from 0 to 100) shows the speculators are currently Bullish with a score of 67.9 percent. The commercials are Bearish with a score of 39.2 percent and the small traders (not shown in chart) are Bearish-Extreme with a score of 4.4 percent.
| CORN Futures Statistics | SPECULATORS | COMMERCIALS | SMALL TRADERS |
| – Percent of Open Interest Longs: | 30.9 | 44.8 | 8.7 |
| – Percent of Open Interest Shorts: | 8.9 | 61.9 | 13.7 |
| – Net Position: | 296,622 | -229,436 | -67,186 |
| – Gross Longs: | 415,961 | 604,188 | 117,870 |
| – Gross Shorts: | 119,339 | 833,624 | 185,056 |
| – Long to Short Ratio: | 3.5 to 1 | 0.7 to 1 | 0.6 to 1 |
| NET POSITION TREND: | |||
| – Strength Index Score (3 Year Range Pct): | 67.9 | 39.2 | 4.4 |
| – Strength Index Reading (3 Year Range): | Bullish | Bearish | Bearish-Extreme |
| NET POSITION MOVEMENT INDEX: | |||
| – 6-Week Change in Strength Index: | 9.8 | -9.0 | -7.7 |
SUGAR Futures:
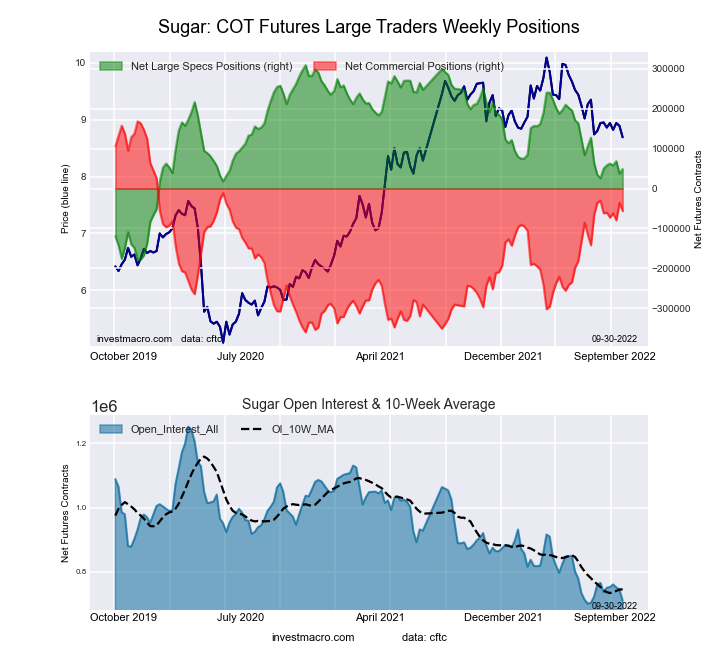 The SUGAR large speculator standing this week resulted in a net position of 48,601 contracts in the data reported through Tuesday. This was a weekly boost of 11,256 contracts from the previous week which had a total of 37,345 net contracts.
This week’s current strength score (the trader positioning range over the past three years, measured from 0 to 100) shows the speculators are currently Bearish with a score of 46.6 percent. The commercials are Bullish with a score of 57.5 percent and the small traders (not shown in chart) are Bearish-Extreme with a score of 17.5 percent.
| SUGAR Futures Statistics | SPECULATORS | COMMERCIALS | SMALL TRADERS |
| – Percent of Open Interest Longs: | 24.1 | 54.9 | 9.8 |
| – Percent of Open Interest Shorts: | 17.2 | 62.8 | 8.7 |
| – Net Position: | 48,601 | -56,409 | 7,808 |
| – Gross Longs: | 171,124 | 390,232 | 69,802 |
| – Gross Shorts: | 122,523 | 446,641 | 61,994 |
| – Long to Short Ratio: | 1.4 to 1 | 0.9 to 1 | 1.1 to 1 |
| NET POSITION TREND: | |||
| – Strength Index Score (3 Year Range Pct): | 46.6 | 57.5 | 17.5 |
| – Strength Index Reading (3 Year Range): | Bearish | Bullish | Bearish-Extreme |
| NET POSITION MOVEMENT INDEX: | |||
| – 6-Week Change in Strength Index: | -0.3 | 1.0 | -5.0 |
COFFEE Futures:
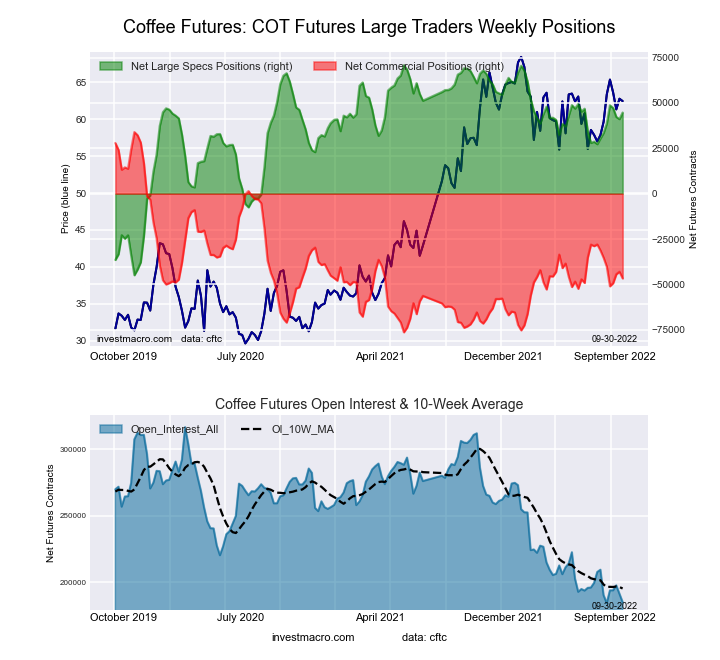 The COFFEE large speculator standing this week resulted in a net position of 44,680 contracts in the data reported through Tuesday. This was a weekly rise of 3,608 contracts from the previous week which had a total of 41,072 net contracts.
This week’s current strength score (the trader positioning range over the past three years, measured from 0 to 100) shows the speculators are currently Bullish with a score of 77.4 percent. The commercials are Bearish with a score of 26.9 percent and the small traders (not shown in chart) are Bearish-Extreme with a score of 17.7 percent.
| COFFEE Futures Statistics | SPECULATORS | COMMERCIALS | SMALL TRADERS |
| – Percent of Open Interest Longs: | 30.0 | 44.5 | 4.9 |
| – Percent of Open Interest Shorts: | 5.8 | 69.7 | 3.8 |
| – Net Position: | 44,680 | -46,664 | 1,984 |
| – Gross Longs: | 55,454 | 82,448 | 9,049 |
| – Gross Shorts: | 10,774 | 129,112 | 7,065 |
| – Long to Short Ratio: | 5.1 to 1 | 0.6 to 1 | 1.3 to 1 |
| NET POSITION TREND: | |||
| – Strength Index Score (3 Year Range Pct): | 77.4 | 26.9 | 17.7 |
| – Strength Index Reading (3 Year Range): | Bullish | Bearish | Bearish-Extreme |
| NET POSITION MOVEMENT INDEX: | |||
| – 6-Week Change in Strength Index: | 9.7 | -10.3 | 1.3 |
SOYBEANS Futures:
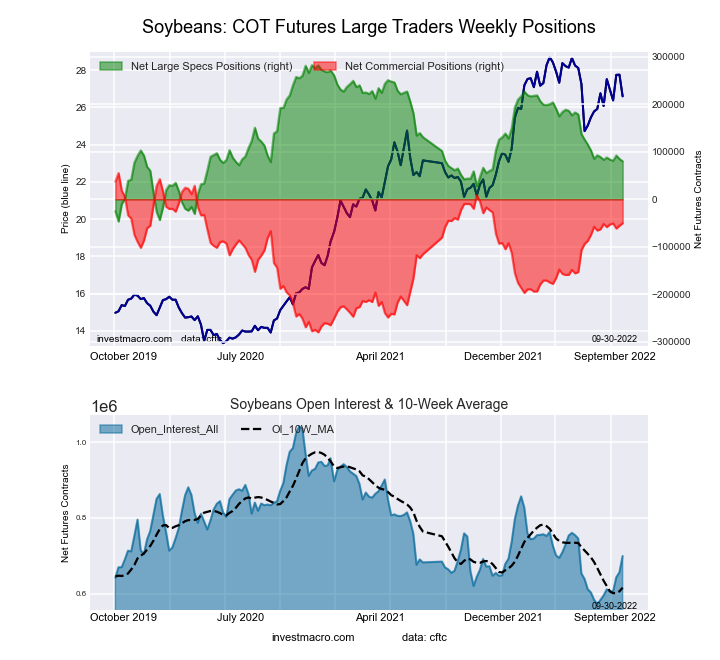 The SOYBEANS large speculator standing this week resulted in a net position of 80,051 contracts in the data reported through Tuesday. This was a weekly decline of -4,722 contracts from the previous week which had a total of 84,773 net contracts.
This week’s current strength score (the trader positioning range over the past three years, measured from 0 to 100) shows the speculators are currently Bearish with a score of 37.9 percent. The commercials are Bullish with a score of 71.2 percent and the small traders (not shown in chart) are Bearish with a score of 20.6 percent.
| SOYBEANS Futures Statistics | SPECULATORS | COMMERCIALS | SMALL TRADERS |
| – Percent of Open Interest Longs: | 21.4 | 52.6 | 6.2 |
| – Percent of Open Interest Shorts: | 10.0 | 59.8 | 10.4 |
| – Net Position: | 80,051 | -50,206 | -29,845 |
| – Gross Longs: | 149,774 | 367,744 | 43,219 |
| – Gross Shorts: | 69,723 | 417,950 | 73,064 |
| – Long to Short Ratio: | 2.1 to 1 | 0.9 to 1 | 0.6 to 1 |
| NET POSITION TREND: | |||
| – Strength Index Score (3 Year Range Pct): | 37.9 | 71.2 | 20.6 |
| – Strength Index Reading (3 Year Range): | Bearish | Bullish | Bearish |
| NET POSITION MOVEMENT INDEX: | |||
| – 6-Week Change in Strength Index: | -1.0 | 0.4 | 2.9 |
SOYBEAN OIL Futures:
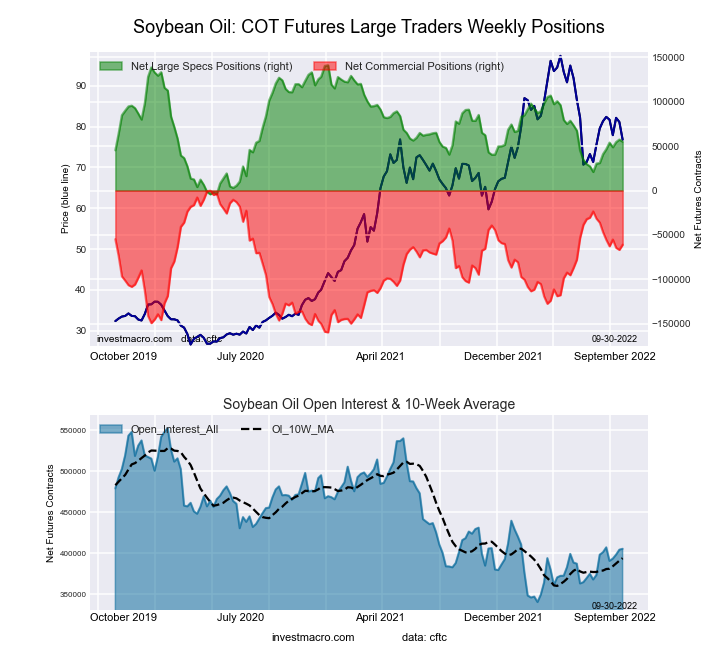 The SOYBEAN OIL large speculator standing this week resulted in a net position of 54,987 contracts in the data reported through Tuesday. This was a weekly decline of -2,424 contracts from the previous week which had a total of 57,411 net contracts.
This week’s current strength score (the trader positioning range over the past three years, measured from 0 to 100) shows the speculators are currently Bearish with a score of 40.7 percent. The commercials are Bullish with a score of 61.9 percent and the small traders (not shown in chart) are Bearish with a score of 35.7 percent.
| SOYBEAN OIL Futures Statistics | SPECULATORS | COMMERCIALS | SMALL TRADERS |
| – Percent of Open Interest Longs: | 22.5 | 48.4 | 6.9 |
| – Percent of Open Interest Shorts: | 8.9 | 63.5 | 5.4 |
| – Net Position: | 54,987 | -60,959 | 5,972 |
| – Gross Longs: | 91,132 | 196,322 | 28,053 |
| – Gross Shorts: | 36,145 | 257,281 | 22,081 |
| – Long to Short Ratio: | 2.5 to 1 | 0.8 to 1 | 1.3 to 1 |
| NET POSITION TREND: | |||
| – Strength Index Score (3 Year Range Pct): | 40.7 | 61.9 | 35.7 |
| – Strength Index Reading (3 Year Range): | Bearish | Bullish | Bearish |
| NET POSITION MOVEMENT INDEX: | |||
| – 6-Week Change in Strength Index: | 9.6 | -8.9 | 0.7 |
SOYBEAN MEAL Futures:
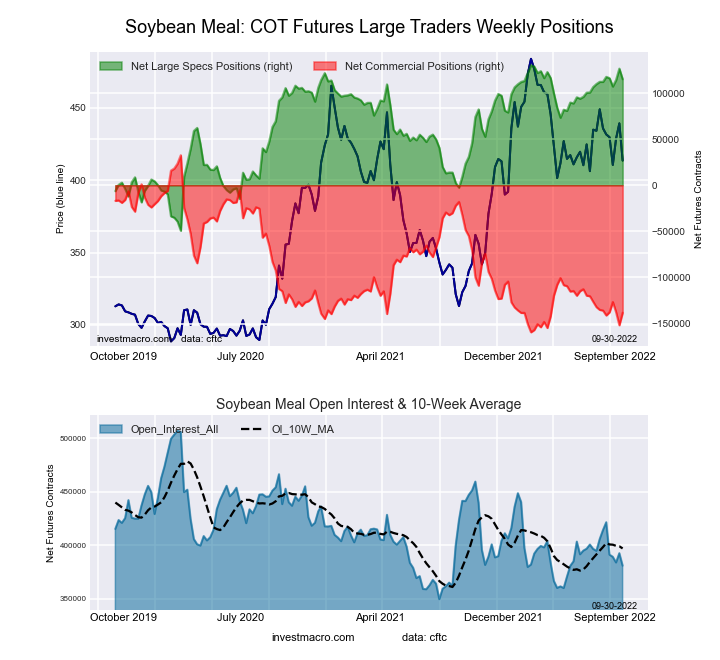 The SOYBEAN MEAL large speculator standing this week resulted in a net position of 115,075 contracts in the data reported through Tuesday. This was a weekly reduction of -11,395 contracts from the previous week which had a total of 126,470 net contracts.
This week’s current strength score (the trader positioning range over the past three years, measured from 0 to 100) shows the speculators are currently Bullish-Extreme with a score of 91.5 percent. The commercials are Bearish-Extreme with a score of 11.0 percent and the small traders (not shown in chart) are Bullish with a score of 53.6 percent.
| SOYBEAN MEAL Futures Statistics | SPECULATORS | COMMERCIALS | SMALL TRADERS |
| – Percent of Open Interest Longs: | 33.9 | 39.7 | 12.3 |
| – Percent of Open Interest Shorts: | 3.7 | 76.1 | 6.2 |
| – Net Position: | 115,075 | -138,371 | 23,296 |
| – Gross Longs: | 129,268 | 151,416 | 46,999 |
| – Gross Shorts: | 14,193 | 289,787 | 23,703 |
| – Long to Short Ratio: | 9.1 to 1 | 0.5 to 1 | 2.0 to 1 |
| NET POSITION TREND: | |||
| – Strength Index Score (3 Year Range Pct): | 91.5 | 11.0 | 53.6 |
| – Strength Index Reading (3 Year Range): | Bullish-Extreme | Bearish-Extreme | Bullish |
| NET POSITION MOVEMENT INDEX: | |||
| – 6-Week Change in Strength Index: | 1.6 | -1.3 | -2.1 |
LIVE CATTLE Futures:
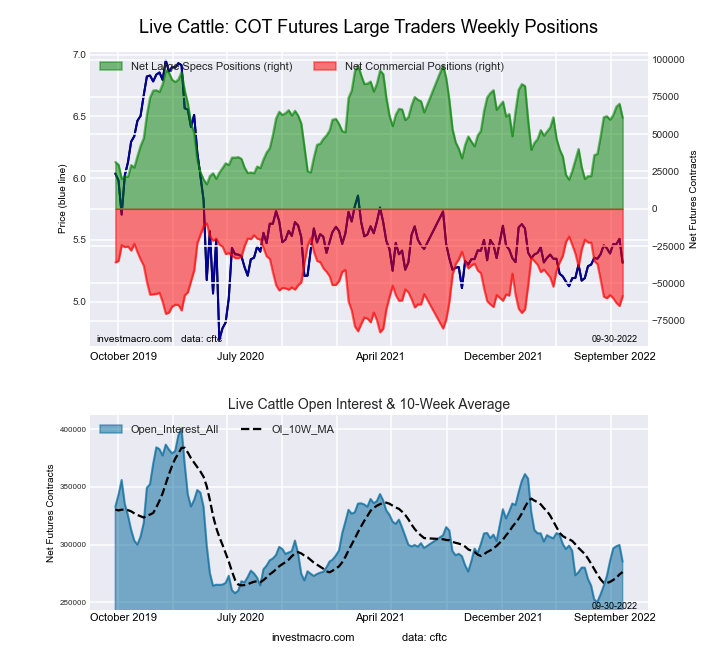 The LIVE CATTLE large speculator standing this week resulted in a net position of 60,967 contracts in the data reported through Tuesday. This was a weekly decline of -9,400 contracts from the previous week which had a total of 70,367 net contracts.
This week’s current strength score (the trader positioning range over the past three years, measured from 0 to 100) shows the speculators are currently Bullish with a score of 55.8 percent. The commercials are Bearish with a score of 33.4 percent and the small traders (not shown in chart) are Bullish-Extreme with a score of 86.5 percent.
| LIVE CATTLE Futures Statistics | SPECULATORS | COMMERCIALS | SMALL TRADERS |
| – Percent of Open Interest Longs: | 39.6 | 33.2 | 11.1 |
| – Percent of Open Interest Shorts: | 18.2 | 53.6 | 12.0 |
| – Net Position: | 60,967 | -58,327 | -2,640 |
| – Gross Longs: | 112,897 | 94,742 | 31,567 |
| – Gross Shorts: | 51,930 | 153,069 | 34,207 |
| – Long to Short Ratio: | 2.2 to 1 | 0.6 to 1 | 0.9 to 1 |
| NET POSITION TREND: | |||
| – Strength Index Score (3 Year Range Pct): | 55.8 | 33.4 | 86.5 |
| – Strength Index Reading (3 Year Range): | Bullish | Bearish | Bullish-Extreme |
| NET POSITION MOVEMENT INDEX: | |||
| – 6-Week Change in Strength Index: | -0.5 | 0.6 | -0.0 |
LEAN HOGS Futures:
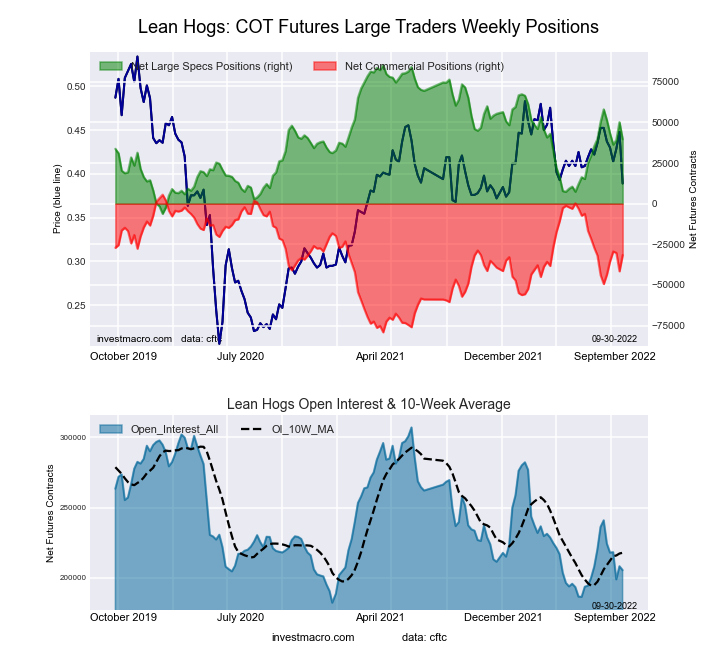 The LEAN HOGS large speculator standing this week resulted in a net position of 39,631 contracts in the data reported through Tuesday. This was a weekly decline of -10,484 contracts from the previous week which had a total of 50,115 net contracts.
This week’s current strength score (the trader positioning range over the past three years, measured from 0 to 100) shows the speculators are currently Bearish with a score of 49.9 percent. The commercials are Bullish with a score of 56.1 percent and the small traders (not shown in chart) are Bullish with a score of 54.8 percent.
| LEAN HOGS Futures Statistics | SPECULATORS | COMMERCIALS | SMALL TRADERS |
| – Percent of Open Interest Longs: | 40.7 | 34.9 | 8.8 |
| – Percent of Open Interest Shorts: | 21.4 | 50.3 | 12.7 |
| – Net Position: | 39,631 | -31,593 | -8,038 |
| – Gross Longs: | 83,521 | 71,741 | 18,012 |
| – Gross Shorts: | 43,890 | 103,334 | 26,050 |
| – Long to Short Ratio: | 1.9 to 1 | 0.7 to 1 | 0.7 to 1 |
| NET POSITION TREND: | |||
| – Strength Index Score (3 Year Range Pct): | 49.9 | 56.1 | 54.8 |
| – Strength Index Reading (3 Year Range): | Bearish | Bullish | Bullish |
| NET POSITION MOVEMENT INDEX: | |||
| – 6-Week Change in Strength Index: | -20.0 | 21.0 | 2.9 |
COTTON Futures:
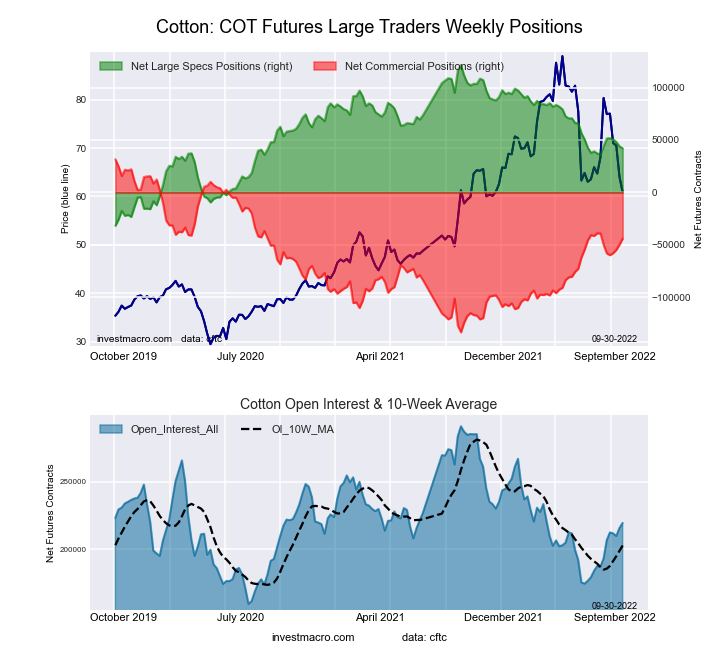 The COTTON large speculator standing this week resulted in a net position of 42,079 contracts in the data reported through Tuesday. This was a weekly reduction of -1,875 contracts from the previous week which had a total of 43,954 net contracts.
This week’s current strength score (the trader positioning range over the past three years, measured from 0 to 100) shows the speculators are currently Bearish with a score of 45.2 percent. The commercials are Bullish with a score of 57.5 percent and the small traders (not shown in chart) are Bearish with a score of 22.8 percent.
| COTTON Futures Statistics | SPECULATORS | COMMERCIALS | SMALL TRADERS |
| – Percent of Open Interest Longs: | 32.1 | 50.0 | 5.4 |
| – Percent of Open Interest Shorts: | 12.9 | 70.1 | 4.5 |
| – Net Position: | 42,079 | -44,016 | 1,937 |
| – Gross Longs: | 70,391 | 109,629 | 11,741 |
| – Gross Shorts: | 28,312 | 153,645 | 9,804 |
| – Long to Short Ratio: | 2.5 to 1 | 0.7 to 1 | 1.2 to 1 |
| NET POSITION TREND: | |||
| – Strength Index Score (3 Year Range Pct): | 45.2 | 57.5 | 22.8 |
| – Strength Index Reading (3 Year Range): | Bearish | Bullish | Bearish |
| NET POSITION MOVEMENT INDEX: | |||
| – 6-Week Change in Strength Index: | -1.5 | 3.9 | -25.5 |
COCOA Futures:
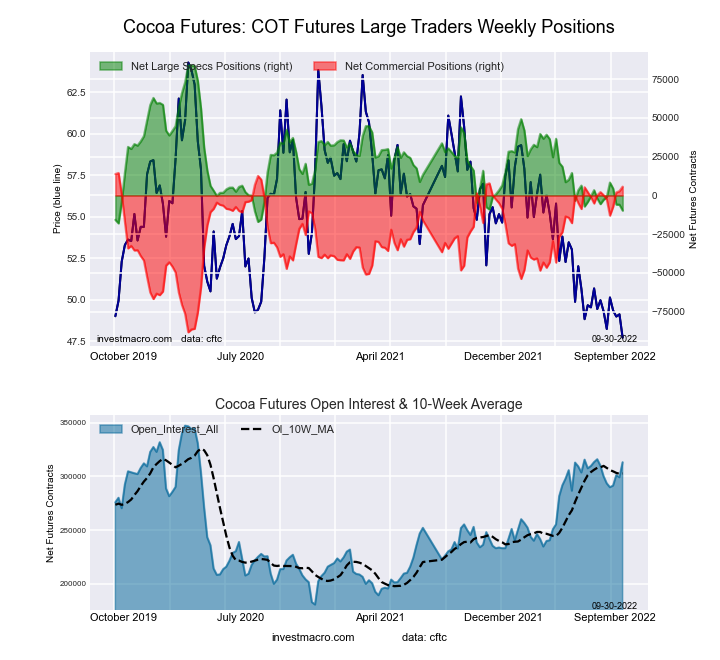 The COCOA large speculator standing this week resulted in a net position of -9,759 contracts in the data reported through Tuesday. This was a weekly decrease of -3,818 contracts from the previous week which had a total of -5,941 net contracts.
This week’s current strength score (the trader positioning range over the past three years, measured from 0 to 100) shows the speculators are currently Bearish-Extreme with a score of 7.2 percent. The commercials are Bullish-Extreme with a score of 93.1 percent and the small traders (not shown in chart) are Bearish with a score of 37.5 percent.
| COCOA Futures Statistics | SPECULATORS | COMMERCIALS | SMALL TRADERS |
| – Percent of Open Interest Longs: | 32.7 | 45.2 | 4.8 |
| – Percent of Open Interest Shorts: | 35.8 | 43.4 | 3.5 |
| – Net Position: | -9,759 | 5,660 | 4,099 |
| – Gross Longs: | 102,300 | 141,689 | 14,973 |
| – Gross Shorts: | 112,059 | 136,029 | 10,874 |
| – Long to Short Ratio: | 0.9 to 1 | 1.0 to 1 | 1.4 to 1 |
| NET POSITION TREND: | |||
| – Strength Index Score (3 Year Range Pct): | 7.2 | 93.1 | 37.5 |
| – Strength Index Reading (3 Year Range): | Bearish-Extreme | Bullish-Extreme | Bearish |
| NET POSITION MOVEMENT INDEX: | |||
| – 6-Week Change in Strength Index: | -6.9 | 5.4 | 15.1 |
WHEAT Futures:
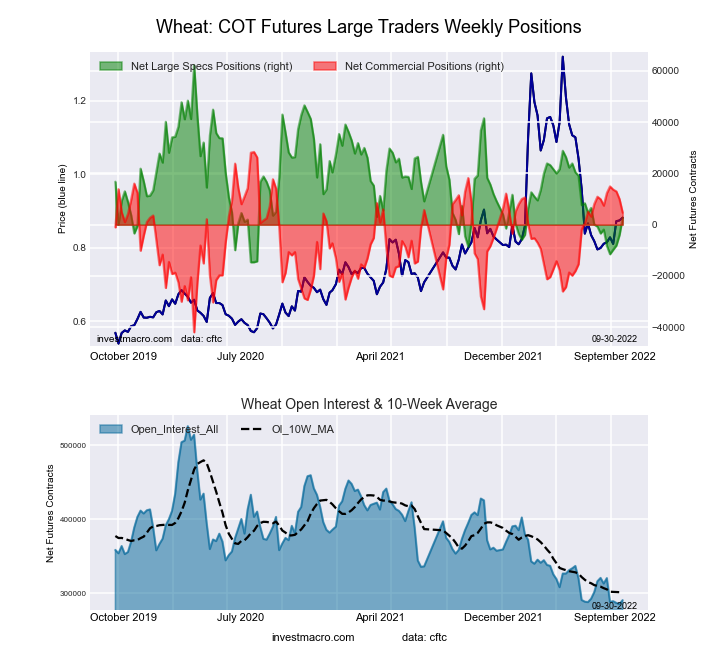 The WHEAT large speculator standing this week resulted in a net position of 2,735 contracts in the data reported through Tuesday. This was a weekly gain of 6,764 contracts from the previous week which had a total of -4,029 net contracts.
This week’s current strength score (the trader positioning range over the past three years, measured from 0 to 100) shows the speculators are currently Bearish with a score of 22.6 percent. The commercials are Bullish with a score of 66.3 percent and the small traders (not shown in chart) are Bullish with a score of 71.9 percent.
| WHEAT Futures Statistics | SPECULATORS | COMMERCIALS | SMALL TRADERS |
| – Percent of Open Interest Longs: | 30.2 | 40.7 | 9.3 |
| – Percent of Open Interest Shorts: | 29.3 | 39.1 | 11.9 |
| – Net Position: | 2,735 | 4,675 | -7,410 |
| – Gross Longs: | 87,885 | 118,360 | 27,059 |
| – Gross Shorts: | 85,150 | 113,685 | 34,469 |
| – Long to Short Ratio: | 1.0 to 1 | 1.0 to 1 | 0.8 to 1 |
| NET POSITION TREND: | |||
| – Strength Index Score (3 Year Range Pct): | 22.6 | 66.3 | 71.9 |
| – Strength Index Reading (3 Year Range): | Bearish | Bullish | Bullish |
| NET POSITION MOVEMENT INDEX: | |||
| – 6-Week Change in Strength Index: | 6.0 | -3.9 | -9.7 |
Article By InvestMacro – Receive our weekly COT Newsletter
*COT Report: The COT data, released weekly to the public each Friday, is updated through the most recent Tuesday (data is 3 days old) and shows a quick view of how large speculators or non-commercials (for-profit traders) were positioned in the futures markets.
The CFTC categorizes trader positions according to commercial hedgers (traders who use futures contracts for hedging as part of the business), non-commercials (large traders who speculate to realize trading profits) and nonreportable traders (usually small traders/speculators) as well as their open interest (contracts open in the market at time of reporting). See CFTC criteria here.

- Geopolitical and macroeconomic conditions continue to pressure market sentiment Jul 20, 2026
- USD/JPY Poised to Continue Gains as Expensive Oil and Lack of Support Weigh on Yen Jul 20, 2026
- COT Metals Charts: Weekly Speculator Bets led by Copper & Steel Jul 18, 2026
- COT Bonds Charts: Weekly Speculator Bets led by 2-Year, SOFR 3M & 5-Year Bonds Jul 18, 2026
- COT Energy Charts: Weekly Speculator Bets led by Brent Oil & Heating Oil Jul 18, 2026
- COT Soft Commodities Charts: Weekly Speculator Bets led by Wheat, Corn & Soybean Meal Jul 18, 2026
- The Bank of Canada kept its interest rate unchanged. Platinum prices reached a three‑week high Jul 16, 2026
- Stock indices rose after the release of US inflation data. China’s GDP slowed sharply Jul 15, 2026
- GBP/USD Awaits Political News: What Will Happen Next Jul 15, 2026
- USD/JPY Holds at Highs: Pressure Lingers on Yen Jul 14, 2026